 Open Access Article
Creative Commons Attribution 3.0 Unported Licence
Combination of theoretical and in situ experimental investigations of the role of lithium dopant in manganese nitride: a two-stage reagent for ammonia synthesis
Said
Laassiri
 *abc,
Constantinos D.
Zeinalipour-Yazdi
 d,
Nicolas
Bion
 e,
C. Richard A.
Catlow
fg and
Justin S. J.
Hargreaves
b
aUniv. Lille, CNRS, ENSCL, Centrale Lille, Univ. Artois, UMR 8181, UCCS - Unité de Catalyse et Chimie du Solide, F-59000, Lille, France. E-mail: Said.laassiri@um6p.ma
bWestCHEM, School of Chemistry, University of Glasgow, Glasgow, G12 8QQ, UK
cChemical & Biochemical Sciences, Green Process Engineering (CBS), Mohamed VI Polytechnic University, UM6P, 43150, Ben Guerir, Morocco
dSchool of Science, University of Greenwich, Central Avenue, Chatham Maritime, Kent, ME4 4TB, UK
eInstitut de Chimie des Milieux et Matériaux de Poitiers (IC2MP), University of Poitiers, CNRS, 4 Rue Michel Brunet, TSA51106, F86073 Poitiers Cedex 9, France
fSchool of Chemistry, Cardiff University, Park Place, Cardiff CF10 1AT, UK
gDepartment of Chemistry, University College London, 20 Gordon Street, London, WC1H 0AJ, UK
First published on 28th January 2020
Abstract
Manganese nitride related materials are of interest as two-stage reagents for ammonia synthesis via nitrogen chemical looping. However, unless they are doped with a co-cation, manganese nitrides are thermochemically stable and a high temperature is required to produce ammonia under reducing conditions, thereby hindering their use as nitrogen transfer materials. Nevertheless, when lithium is used as dopant, ammonia generation can be observed at a reaction temperature as low as 300 °C. In order to develop strategies for the improvement of the reactivity of nitride materials in the context of two-stage reagents, it is necessary to understand the intrinsic role of the dopant in the mechanism of ammonia synthesis. To this end, we have investigated the role of lithium in increasing the manganese nitride reactivity by in situ neutron diffraction studies and N2 and H2 isotopic exchange reactions supplemented by DFT calculations.
1. Introduction
In the design of a novel generation of materials for ammonia synthesis, metal nitrides have significant potential for the development of very active catalysts that could operate under less severe conditions than the conventional Haber Bosch Process. While the mechanism of ammonia synthesis is still not unequivocally elucidated for nitride based materials, lattice nitrogen mobility and reactivity have been demonstrated in a number of nitride materials including mono- and bimetallic nitrides such as Ta3N5, Mg3N2 and Co3Mo3N, leading to the possibility of ammonia production through pathways based upon the Mars–van Krevelen (MvK) mechanism.1–4 In this mechanism, some of the lattice nitrogen can react directly with dihydrogen to produce ammonia, resulting in the generation of nitrogen vacancies that can activate N2 to complete the cycle.Over the years, oxide materials operating via the MvK mechanism have inspired the development of chemical looping technology for combustion reactions. The idea is based upon separating the reaction into different steps where the combustion stage occurs in the absence of dioxygen and the oxygen required for the reaction is provided by an oxide-based material. The oxygen-depleted material is subsequently regenerated in a second reaction step. The possibility to deconstruct processes into multiple sub-reactions conducted under different conditions (such as temperature, pressure and gas composition) is an advantage of looping material design when compared to catalytic material design. Considering the thermodynamic limitation of the ammonia synthesis reaction, the application of the chemical looping principle in ammonia synthesis presents an interesting alternative to the Haber Bosch Process. In a similar manner to the oxide based chemical looping processes, ammonia synthesis can be deconstructed into sub-reactions undertaken in the presence of a nitride material acting as a nitrogen transfer agent, where the nitride can be reduced in a first step to produce ammonia and its resultant nitrogen deficiency replenished in a second step using N2.5,6 The sub-reactions could be conducted under different conditions which could alleviate some of the limitations related to the adsorption and dissociation of dinitrogen in the catalytic cycle. Amongst materials that can act as nitrogen transfer materials, manganese has attracted a degree of attention due to its ability to activate molecular dinitrogen at moderate temperature and ambient pressure to form a range of nitrides with different crystal structure and stoichiometry, including Mn4N, Mn3N2 and Mn6N5+x.7,8 Furthermore, previous studies have shown that the lattice nitrogen in manganese nitride is both labile and reactive under reducing conditions.5,9 When manganese nitride is reacted with hydrogen at ambient pressure, ammonia is produced. The possibility of manganese based systems to “breathe in” nitrogen and “breathe out” ammonia by simply cycling between different reaction environments at ambient pressure offers an interesting route for the development of alternative approaches for ammonia generation under milder reaction conditions. However, the thermochemical stability of manganese nitride and its apparent low selectivity towards ammonia generation hinder its application as a nitrogen transfer material. In order to improve the reactivity of nitride materials, we have demonstrated that doping with small amounts of lithium containing dopant results in high reactivity towards hydrogen at a reaction temperature as low as 300 °C.5 A related effect has been reported in the catalytic ammonia synthesis reaction, where the addition of LiH to transition metal-based materials as co-catalyst facilitated the production of ammonia at 350 °C.10
Historically, the development of highly active catalysts for ammonia synthesis is closely related to the use of suitable dopants to enhance performance. For example, in the case of promoted iron catalysts, Al2O3 is used as a structure promoter. The difference in terms of accessible surface area between promoted and bare iron catalysts is twenty-fold. However, the role of dopants is not only restricted to structural modification, but also includes modification of the electronic properties. In the case of the industrial ammonia catalyst, the addition of K2O in the doubly promoted iron catalyst considerably increases catalytic activity at higher pressure when compared to the singly promoted catalyst.11 In the context of the Ru based catalyst system, which is very active for ammonia generation at low pressure, density functional theory (DFT) indicated that the addition of Cs+ on the Ru(0001) surface reduced the N2 dissociation barrier and the coverage of other intermediates along the reaction path.11 However, to the authors’ current knowledge, the role of lithium doping in both catalytic and chemical looping ammonia synthesis is not yet clearly understood.
In order to investigate the origin of the increase in manganese reactivity upon lithium doping, a series of in situ neutron diffraction studies and N2 and H2 isotopic exchange reactions were performed and were supplemented by DFT calculations. Initially, a series of in situ neutron diffraction studies was conducted to provide information on the structural evolution of lithium doped and non-doped manganese nitride materials under reducing reaction conditions. Furthermore, the role of lithium in the process of hydrogen and nitrogen activation was studied by isotopic exchange reactions, while detailed DFT calculations provide insight into the energetic aspects of the interaction between the reactant and the surface in the presence and absence of the dopant.
2. Methods and materials
2.1 Experimental methods
![[thin space (1/6-em)]](https://www.rsc.org/images/entities/char_2009.gif) :
:![[thin space (1/6-em)]](https://www.rsc.org/images/entities/char_2009.gif) 1 H2
1 H2![[thin space (1/6-em)]](https://www.rsc.org/images/entities/char_2009.gif) :
:![[thin space (1/6-em)]](https://www.rsc.org/images/entities/char_2009.gif) N2 activation step at 700 °C for 1 h.
N2 activation step at 700 °C for 1 h.
2.1.2.1 Nitrogen activation process. The study of the nitrogen activation process was performed using labeled nitrogen 15N2 (98%+ purity, supplied by Cambridge Isotope Laboratories, Inc.). The mass-to-charge ratios of 28, 29 and 30 m/z were monitored as a function of time to follow the process.
2.1.2.2 Hydrogen activation process. Hydrogen activation was studied via the H2/D2 exchange reaction. Isothermal homoexchange experiments were conducted at temperatures ranging between 100 °C and 300 °C. After the activation step, D2 (20 mbar) and H2 (20 mbar) were introduced in the system and the evolution of the partial pressures of reactants and products was monitored by mass spectrometry.
2.2. Density functional theory
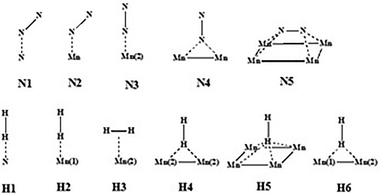
All DFT calculations were periodic Γ-point16 and spin-polarised calculations obtained with the use of the VASP 5.4.1 code.17,18 Exchange and correlation effects were considered within the generalized gradient approximation (GGA) using the revised Perdew–Burke–Ernzerhof (revPBE) exchange-correlation (XC) functional,19 with the projector augmented-wave (PAW) method20,21 used to represent core states. These were 1s to 3p for Mn and 1s for N and Li. Geometry optimizations were performed with a residual force threshold on each atom of 0.02 eV Å−1, using the conjugate-gradient algorithm. The convergence criterion for electronic relaxation was 10−1 eV. The initial charge density was obtained by superposition of atomic charges. Various initial adsorption configurations were considered where the adsorbate was either in a side-on or in an end-on configuration, and the adsorbate bond length for N2 (rN–N) = 1.11 Å, and that for H2 (rH–H) = 0.75 Å. The various adsorption sites were the symmetry unique surface sites shown in Scheme 1, which resulted in 8 sites. The adsorption energy was taken as the total energy difference between the fully relaxed bound state of the surface–adsorbate complex and the fully relaxed surface slab and the isolated molecules given by eqn (1),| ΔEads,D3 = Eslab-X − Eslab − EX, | (1) |
 | (2) |
3. Results and discussion
3.1. Structural evolution of manganese nitride materials under reducing conditions: in situ neutron diffraction
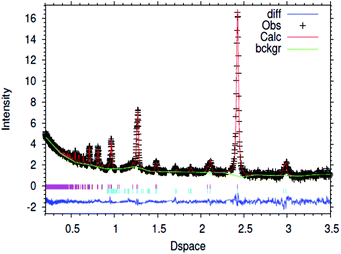 | ||
| Fig. 1 Fitted powder neutron diffraction profile from Rietveld refinement for the 1% wt Li/Mn6N5+x sample at ambient temperature. | ||
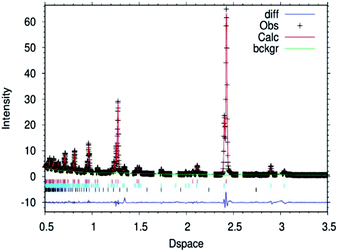 | ||
| Fig. 2 Fitted powder neutron diffraction profile from Rietveld refinement for the θ-Mn6N5+x sample at ambient temperature. | ||
In the case of the lithium doped material, the crystal structure derived from the Rietveld refinement, Fig. 1, corresponded closely to the to the θ-Mn6N5+x structure as described by Leineweber et al.8 In summary, it presented a defective NaCl type structure with tetragonal distortion (F4/mmm).The overall details of the refinement are summarized in Table 1. In the case of the non-doped manganese nitride, the material was found to comprise two phases, being predominantly composed of θ-Mn6N5+x and to a lesser extent of η-Mn3N2 (θ-Mn6N5+x/Mn3N2 = 1/0.2 weight ratio) as extracted from the Rietveld refinement as presented in Fig. 2. In the lithium doped manganese nitride, only the θ-Mn6N5+x phase was observed, indicating that the addition of lithium favours the formation of θ-Mn6N5+x. The application of powder neutron diffraction provides a much greater insight into the phase complexity of these materials, for which the powder X-ray diffraction pattern was assigned previously to Mn3N2.5
| Nuclear structure | Magnetic structure | |
|---|---|---|
| Space group | F4/mmm | FC2′/m′ |
| Cell parameter a/Å | 4.2195(3) | 4.2195(3) |
| Cell parameter c/Å | 4.1514(4) | 4.1514(4) |
| Occupancy for N site | 1.00 ± 0.02 | |
| R p | 0.041 | |
| wRp | 0.056 | |
| χ 2 | 1.396 |
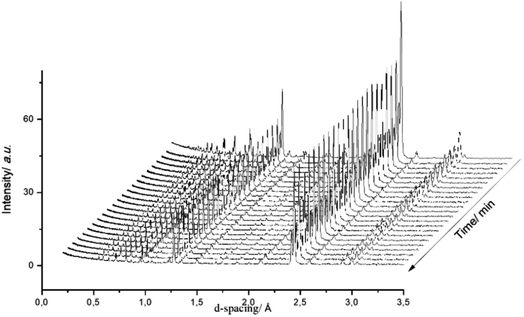
Fig. 3 presents a selection of in situ diffraction patterns collected at 400 °C for the undoped θ-Mn6N5+x sample. Following the reaction no structural changes were apparent in both the θ-Mn6N5+x and the η-Mn3N2 phase fractions, confirming the thermochemical stability of manganese nitrides during the discharge reaction as had been reported earlier in the literature.5 Furthermore, no changes were observed upon increasing the reaction temperature to 500 °C.
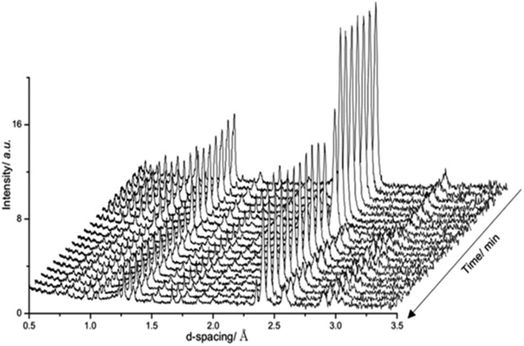
Fig. 4 presents in situ neutron diffraction patterns of the lithium doped manganese nitride material collected at different times on stream at 400 °C. At low temperature, ≤200 °C, no noticeable changes were detected in the sample and only the θ-Mn6N5+x phase was apparent. This observation is consistent with the low reactivity of θ-Mn6N5+x for ammonia production under reducing conditions at reaction temperatures below 300 °C.5 However, upon increasing the temperature, a linear decrease in the nitrogen occupancy was observed, indicating reduction of the θ-Mn6N5+x proceeding through a nitrogen vacancy creation pathway. However, when the concentration of nitrogen vacancies reached a critical concentration (n = 0.88), the reduction of the θ-Mn6N5+x was accompanied by a structural rearrangement, resulting in two inequivalent Mn sites, with the resulting structure being related to η-Mn3N2.
3.2. Effect of Li in the N2 and H2 activation processes: isotopic exchange experiment
 | ||
| Fig. 5 Evolution of the nitrogen isotopomer distribution during the heterolytic TPNIE experiment on the manganese related materials. (a) θ-Mn6N5+x and (b) 1% wt Li/Mn6N5+x. | ||
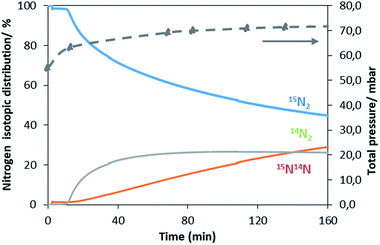
A similar exchange pattern was observed during the heterolytic isothermal nitrogen exchange experiment at 700 °C, as presented in Fig. 6. During the exchange reaction, a significant reduction in 15N2 concentration was observed accompanied by production of 14N2 during the first 40 minutes of reaction whilst 14N15N was only detected following 14N2 production. Simultaneously, an increase in the system pressure was observed during the initial stage of the experiment. This suggests possible reduction of the system prior to the activation of its exchange activity. In summary, the activation process is very limited in the non-doped system. However, a pronounced effect of lithium dopant upon the nitrogen activation process is observed, which may be a result of lowering of the nitrogen vacancy formation energy (NVFE) as suggested by the DFT calculations detailed later.
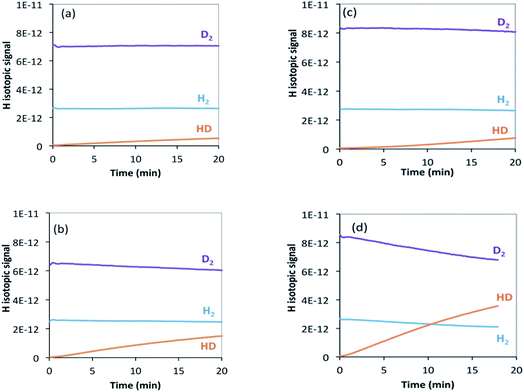 | ||
| Fig. 7 H2/D2 exchange reaction on (a) θ-Mn6N5+x at 200 °C, (b) θ-Mn6N5+x at 250 °C, (c) 1% wt Li/Mn6N5+x at 200 °C, (d) 1% wt Li/Mn6N5+x at 250 °C. | ||
In the case of the non-doped manganese nitride sample, the H2/D2 exchange reaction results indicate that at 200 °C the exchange starts occurring only at a very low rate and only a small amount of HD was detected (Fig. 7(a)). Conducting the exchange at 250 °C slightly increases the exchange rate (Fig. 7(b)). Hydrogen is usually expected to spontaneously dissociate on transition metal surfaces at low temperature (<200 °C). However, absence of the H2/D2 exchange reaction on θ-Mn6N5+x at room temperature and up to 150 °C was found. In the lithium promoted system, the exchange occurred at a very low rate at 200 °C, in a very similar manner to the non-doped system (Fig. 7(c)). However, at 250 °C the presence of lithium accelerated the H2/D2 equilibration reaction compared to its non-doped counterpart, as can be seen from the significant increase in the concentration of HD produced (Fig. 7(d)). This observation indicates that at 250 °C, the lithium dopant lowers the barrier for hydrogen dissociation and possibly increases the number of sites where H2/D2 can adsorb dissociatively via lithium-mediated chemisorption.
3.3. DFT study of H2 and N2 adsorption on manganese nitride materials
In order to elucidate the role of Li in the reactivity of manganese nitride in ammonia synthesis, H2 and N2 activation has been studied by DFT calculations.![[triple bond, length as m-dash]](https://www.rsc.org/images/entities/char_e002.gif) N activation was found to be less than 4% (in terms of bond length elongation). Hydrogen adsorption was found to be exclusively molecular with adsorption energies varying between −81 and −84 kJ mol−1.
N activation was found to be less than 4% (in terms of bond length elongation). Hydrogen adsorption was found to be exclusively molecular with adsorption energies varying between −81 and −84 kJ mol−1.
![[triple bond, length as m-dash]](https://www.rsc.org/images/entities/char_e002.gif) N activation. The adsorption and activation of nitrogen on η-Mn3N2 were studied on the (100) surface as it was identified previously as the preferred surface termination. The adsorption properties were calculated at the five symmetry unique sites of the (100) surface as depicted in Scheme 1, and the values are presented in Table 2. The adsorption energies of N2 were found to be very low, varying between −3.6 kJ mol−1 and −48 kJ mol−1. In fact, the adsorption energy for most adsorption sites (i.e. N1, N2, N4 and N5) was low, being between −3.6 and −10.8 kJ mol−1 and only reaching −48 kJ mol−1 for N2 adsorption at the Mn(2) site. In contrast with the situation for N2, H2 was found to interact more strongly with η-Mn3N2. The calculated adsorption energies ranged between −79.9 kJ mol−1 and −81.5 kJ mol−1. In this case, H2 adsorption is likely to be molecular and activated adsorption is not expected, at least for the studied (100) surface. A parallel can be established with the adsorption energy we previously reported for H2 adsorption over Ta3N5-(100), (010) and (001) surfaces, which was also reported as being mainly molecular.
N activation. The adsorption and activation of nitrogen on η-Mn3N2 were studied on the (100) surface as it was identified previously as the preferred surface termination. The adsorption properties were calculated at the five symmetry unique sites of the (100) surface as depicted in Scheme 1, and the values are presented in Table 2. The adsorption energies of N2 were found to be very low, varying between −3.6 kJ mol−1 and −48 kJ mol−1. In fact, the adsorption energy for most adsorption sites (i.e. N1, N2, N4 and N5) was low, being between −3.6 and −10.8 kJ mol−1 and only reaching −48 kJ mol−1 for N2 adsorption at the Mn(2) site. In contrast with the situation for N2, H2 was found to interact more strongly with η-Mn3N2. The calculated adsorption energies ranged between −79.9 kJ mol−1 and −81.5 kJ mol−1. In this case, H2 adsorption is likely to be molecular and activated adsorption is not expected, at least for the studied (100) surface. A parallel can be established with the adsorption energy we previously reported for H2 adsorption over Ta3N5-(100), (010) and (001) surfaces, which was also reported as being mainly molecular.
| a Percentage N2 activation is defined as [r(N2,ads) – 1.098] × 100/1.098. b Percentage H2 activation is defined as [r(H2,ads) – 0.74] × 100/0.74. | |||||||||
|---|---|---|---|---|---|---|---|---|---|
| N2 adsorption | |||||||||
| Bound to | N5 | N3 | N1 | N2 | N4 | N2 | N1 | N3 | |
| Type | Tilt | End-on | Tilt | Tilt | End-on | End-on | Tilt | End-on | |
| ΔEN2, D3 | −9.5 | −47.9 | −9.7 | −10.8 | −8.6 | −3.6 | −8.4 | −48.0 | kJ mol−1 |
| r(N–N) | 1.118 | 1.134 | 1.117 | 1.119 | 1.118 | 1.128 | 1.118 | 1.134 | Å |
| a(S–N–N) | 137 | 176 | 111 | 131 | 165 | 180 | 116 | 177 | ° |
| r(S–N) | 3.765 | 1.909 | 3.420 | 3.095 | 3.562 | 2.090 | 3.405 | 1.910 | Å |
| N2 activationa | 2 | 3 | 2 | 2 | 2 | 3 | 2 | 3 | % |
![[thin space (1/6-em)]](https://www.rsc.org/images/entities/char_2009.gif) |
|||||||||
| H2 adsorption | |||||||||
| Bound to | H5 | H3 | H1 | H4 | H4 | H3 | H1 | H3 | |
| Type | End-on | Side-on | End-on | End-on | End-on | End-on | End-on | Side-on | |
| ΔEH2, D3 | −81.0 | −81.5 | −80.4 | −80.6 | −80.5 | −79.9 | −80.3 | −81.4 | kJ mol−1 |
| r(H–H) | 0.752 | 0.749 | 0.749 | 0.750 | 0.749 | 0.748 | 0.749 | 0.749 | Å |
| a(S–H–H) | 137 | 98 | 173 | 140 | 152 | 176 | 173 | 97 | ° |
| r(S–H) | 3.177 | 2.791 | 2.661 | 3.014 | 2.948 | 2.881 | 2.646 | 2.869 | Å |
| H2 activationb | 2 | 1 | 1 | 1 | 1 | 1 | 1 | 1 | % |
In summary, hydrogen was found to adsorb end-on on N (H1) and Mn(1) (H2), changing to side-on for Mn(2) (H3). It can also adsorb end-on on a two-fold Mn bridge (H4) and a four-fold Mn hollow (H5). Nitrogen adsorbs in the tilt configuration on N (N1), Mn(1) (N2) and a four-fold Mn hollow (N5). We have previously attributed the three adsorption modes to the symmetry of the molecular orbitals closest to the highest occupied molecular orbital of N2.24 Nitrogen can also adsorb end-on on a Mn atom (N3) and a Mn–Mn bridge (N4).
3.3.3.1 Lithium adsorption on the η-Mn3N2 surface. The adsorption of Li on η-Mn3N2 has been studied by DFT calculations (Fig. 8). Five different adsorption configurations for Li on η-Mn3N2 have been identified and are depicted in Scheme 2. In particular, we find that Li chemisorbs strongly (−174 kJ mol−1 to −247 kJ mol−1) on each of the eight symmetry unique adsorption sites of the (100) surface. The adsorption of Li was found to be non-selective towards Mn or N. Therefore, Li may electronically affect both Mn and N when used as a dopant. This behaviour is in contrast with our observations for Co doped Ta3N5, for which Co was found to adsorb mostly on N-rich sites, which may be attributed to the metallic property of Co.23
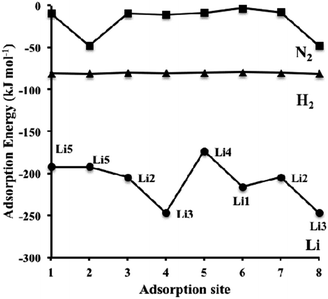 | ||
| Fig. 8 Dispersion-corrected (revPBE-D3) adsorption energies of Li (circles), H2 (triangles) and N2 (squares) over the symmetry unique adsorption sites on η-Mn3N2 depicted in Scheme 1 (for H2 and N2). The data for Li corresponds to the adsorption site configuration depicted in Scheme 2. Lines connecting the data points have been drawn to guide the eye. | ||
 | ||
| Scheme 2 Various binding configurations of Li atoms on η-Mn3N2 along with selected bond lengths given in Å. | ||
The adsorption energy of Li is much stronger than that of H2 or N2, as shown in Fig. 8; therefore, the adsorption of the reactants for ammonia synthesis is predicted not to perturb significantly the structure of the Li-η-Mn3N2 phase at low temperatures. Furthermore, it was observed that Li decreases the number of unpaired electrons on the Mn atoms as indicated by changes in their effective magnetic moment. In particular, we observe a decrease by an average value of 0.9 μB, indicating pairing of the lone electron of Li with the unoccupied d-orbitals of the Mn atoms. This observation suggests that the promoting effect of lithium on η-Mn3N2 is electronic in nature, which is a result of electron injection from Li into the unoccupied d-states of Mn.
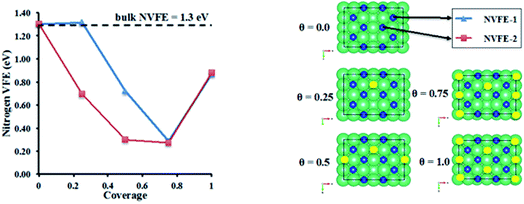
3.3.3.2 Nitrogen vacancy formation energy in Li doped η-Mn3N2. The evolution of the nitrogen vacancy formation energy (NVFE) was studied as a function of coverage of Li on the surface vacancies of η-Mn3N2. The results are presented in Fig. 9.
In the absence of Li, the NVFE of η-Mn3N2 in bulk is 1.3 eV, which is identical to the NVFE at the (100) surface. This indicates some degree of rehybridization of the bonding orbitals of surface-N compared to bulk-N in order to keep the NVFE of the 6-fold bound N in the bulk the same as the 5-fold bound N on the surface. A comparison of the band structures of bulk and surface η-Mn3N2 shows an up-shift of the N 2s band by about 0.5 eV in the slab DOS. Having examined the NVFE at two sites (i.e. NVFE-1 and NVFE-2), it was found that the location of the Li promoter with respect to the prospective N-vacancy determines the reducing effect on the NVFE (i.e. promoting effect). In particular, it appears that there is a promotional effect only when the Li promoter is separated from N, and a vacancy is formed by a Mn–Mn bond rather than a Mn atom (see θ = 0.25 in Fig. 9 for the position of Li compared to N for NVFE-1 and NVFE-2). Intriguingly, both NVFE curves (i.e. NVFE-1 and NVFE-2) as a function of coverage show that there is an optimum surface concentration for the Li atoms so that the promoting effect is maximized, which corresponds to a coverage of θ = 0.75 and a ratio of Mn![[thin space (1/6-em)]](https://www.rsc.org/images/entities/char_2009.gif) :
:![[thin space (1/6-em)]](https://www.rsc.org/images/entities/char_2009.gif) Li surface atoms (i.e. Mnsurf
Li surface atoms (i.e. Mnsurf![[thin space (1/6-em)]](https://www.rsc.org/images/entities/char_2009.gif) :
:![[thin space (1/6-em)]](https://www.rsc.org/images/entities/char_2009.gif) Lisurf) of 4
Lisurf) of 4![[thin space (1/6-em)]](https://www.rsc.org/images/entities/char_2009.gif) :
:![[thin space (1/6-em)]](https://www.rsc.org/images/entities/char_2009.gif) 1. Higher Li coverage appears to increase the NVFE and would additionally prevent the reactants from interacting directly with the η-Mn3N2 phase. Low Li coverage results in a NVFE which is almost 1 eV higher than that at θ = 0.75. The NVFE is an indication of the energy required to remove surface N via reactions with hydrogen:
1. Higher Li coverage appears to increase the NVFE and would additionally prevent the reactants from interacting directly with the η-Mn3N2 phase. Low Li coverage results in a NVFE which is almost 1 eV higher than that at θ = 0.75. The NVFE is an indication of the energy required to remove surface N via reactions with hydrogen:
Li-η-Mn3N2 + ![[/]](https://www.rsc.org/images/entities/char_e0ee.gif) H2 ↔ Li-η-Mn3N2−x + xNH3 H2 ↔ Li-η-Mn3N2−x + xNH3 |
On this basis, we expect that a Li surface concentration of Mnsurf![[thin space (1/6-em)]](https://www.rsc.org/images/entities/char_2009.gif) :
:![[thin space (1/6-em)]](https://www.rsc.org/images/entities/char_2009.gif) Lisurf = 4
Lisurf = 4![[thin space (1/6-em)]](https://www.rsc.org/images/entities/char_2009.gif) :
:![[thin space (1/6-em)]](https://www.rsc.org/images/entities/char_2009.gif) 1 to be specific for promoting ammonia synthesis reactions on η-Mn3N2.
1 to be specific for promoting ammonia synthesis reactions on η-Mn3N2.
3.4. Integration of experimental work and computational modelling in Li doped manganese nitride materials
The ability of manganese to activate nitrogen to form an array of nitrides with different structure and nitrogen content has attracted much interest for the development of two-stage reactants for ammonia synthesis by chemical looping. However, unless they are doped with Li, the reactivity of manganese nitrides was found to be limited in the low temperature range. The stability of manganese nitride was clearly observed by in situ neutron diffraction studies (Fig. 3) where no changes in the structural properties of θ-Mn6N5+x or of η-Mn3N2 (present as a minor phase) were observed during the discharge reaction conducted using 60 mL min−1 75 vol% H2 in Ar (BOC, 99.98%). To extend the study, H2 and N2 adsorption and activation have been studied using isotopic exchange and DFT modelling. The adsorption energies as evaluated using periodic DFT-D3 calculations showed that N2 only weakly interacted with η-Mn3N2 and θ-Mn6N5+x (with adsorption energy ranging between −3.6 kJ mol−1 and −48 kJ mol−1), ruling out an activated adsorption process. These results agree with those of nitrogen isotopic exchange where no significant N2 activation and dissociation was observable under the reaction conditions applied. The energy relating to H2 adsorption was also calculated for the non-doped nitrides and ranged between −79.9 kJ mol−1 and −81.5 kJ mol−1. Despite the stronger interaction, H2 was found to be adsorbed mainly in a molecular from. The H2 isotopic exchange reaction also showed limited activation of H2/D2 at temperatures below 250 °C and only limited production of HD was observed, indicating an important energy barrier for the dissociative chemisorption of H2 on manganese nitride materials.Li doping was found to be critical in the reactivity of manganese nitride during the discharge reaction. Doping with a low level of Li was found to enhance greatly the production of ammonia during the discharge reaction. The same positive effect was observed in the N2 and H2 isotopic exchange reactions. In situ neutron diffraction studies have shown that the reaction of 1% wt Li/Mn6N5+x is accompanied by significant structural changes. The reduction process started with nitrogen vacancy creation at low temperature followed by the transformation of θ-Mn6N5+x into η-Mn3N2 at ∼300 °C. A parallel might be established with the heterolytic TPNIE experimental results, where an increase in 14N2 concentration and total pressure occurred prior to the initiation of the 15N2/14N2 exchange reaction. Taking into account that the differences between the θ-Mn6N5+x and η-Mn3N2 structures lie in the presence of an ordered nitrogen vacancy array, the nitrogen vacancy formation energy as a function of Li concentration has been calculated (Fig. 9). The presence of Li was found to decrease the NVFE from 1.3 eV (in the absence of dopant, i.e. θ = 0) to 0.3 eV (θ = 0.75). Hence, doping with Li enhances greatly the formation of nitrogen vacancies, lowering the energy required to remove N from the surface. Such nitrogen vacancy sites have been reported as active sites for N2 activation in the case of Co3Mo3N,24 and this could explain the reactivity of doped manganese nitrides.
It is interesting to draw comparisons between the present study and previous investigations relating to manganese nitride being applied for solar ammonia synthesis upon reaction with water25 and the thermochemical synthesis of ammonia and syngas from natural gas at atmospheric pressure.6 In the former investigation, the inclusion of transition metal dopants to modify the reactivity of lattice nitrogen to generate desirable processes and redox properties was modelled using electronic structure theory, and experimental validation was undertaken using iron doped manganese nitride.25
4. Conclusion
A combined experimental and computational modelling based study has been undertaken to provide additional understanding of the beneficial role of lithium doping in the enhancement of ammonia synthesis upon hydrogenation of manganese nitride. Powder neutron diffraction demonstrates that lithium doping enhances the phase fraction of θ-Mn6N5+x which was shown to progressively lose nitrogen as a function of temperature upon reduction, yielding a structure related to η-Mn3N2. The observation of enhanced lattice nitrogen reactivity upon lithium doping was apparent in isotopic exchange studies, which also demonstrated that lithium enhanced hydrogen activation. Consistent with these experimental observations, in computational modelling studies, lithium doping is found to reduce the nitrogen vacancy formation energy which is anticipated to lead to enhanced reactivity.Conflicts of interest
There are no conflicts to declare.Acknowledgements
The authors acknowledge the support from the PRESTIGE H2020 program and the financial support from MOPGA and the Region Haut de France Research Funding Program. This study was supported by EPSRC funding (EP/L026317/1, EP/L02537X/1). Via our membership of the UK’s HEC Materials Chemistry Consortium, which is funded by EPSRC (EP/L000202/1), this work used the ARCHER UK National Supercomputing Service (http://www.archer.ac.uk). The authors acknowledge the use of the UCL Legion and Grace High Performance Computing Facility (Legion@UCL, Grace@UCL), and associated support services, in the completion of this work. European Union (ERDF) and Région Nouvelle Aquitaine region are also gratefully acknowledged for their financial support.Notes and references
- S. Laassiri, C. D. Zeinalipour-Yazdi, C. R. A. Catlow and J. S. J. Hargreaves, Catal. Today, 2017, 286, 147–155 CrossRef CAS.
- G. E. Veitch, K. L. Bridgwood and S. V. Ley, Org. Lett., 2008, 10, 3623–3625 CrossRef CAS PubMed.
- D. McKay, D. H. Gregory, J. S. J. Hargreaves, S. M. Hunter and X. Sun, Chem. Commun., 2007, 3051–3053 RSC.
- I. AlShibane, A. Daisley, J. S. J. Hargreaves, A. L. Hector, S. Laassiri, J. L. Rico and R. I. Smith, ACS Sustainable Chem. Eng., 2017, 5, 9214–9222 CrossRef CAS.
- S. Laassiri, C. D. Zeinalipour-Yazdi, C. R. A. Catlow and J. S. Hargreaves, Appl. Catal., B, 2018, 223, 60–66 CrossRef CAS.
- M. G. Heidlage, E. A. Kezar, K. C. Snow and P. H. Pfromm, Ind. Eng. Chem. Res., 2017, 56, 14014–14024 CrossRef CAS.
- M. Widenmeyer, T. C. Hansen, A. Leineweber, A. Weidenkaff and R. Niewa, Z. Anorg. Allg. Chem., 2017, 643, 1929–1938 CrossRef CAS.
- A. Leineweber, R. Niewa, H. Jacobs and W. Kockelmann, J. Mater. Chem., 2000, 10, 2827–2834 RSC.
- R. Michalsky, A. M. Avram, B. A. Peterson, P. H. Pfromm and A. A. Peterson, Chem. Sci., 2015, 6, 3965–3974 RSC.
- P. Wang, F. Chang, W. Gao, J. Guo, G. Wu, T. He and P. Chen, Nat. Chem., 2017, 9, 64 CrossRef CAS PubMed.
- R. Schlögl, Angew. Chem., Int. Ed., 2003, 42, 2004–2008 CrossRef PubMed.
- A. Miura, T. Takei and N. Kumada, Inorg. Chem., 2013, 52, 11787–11791 CrossRef CAS PubMed.
- S. Laassiri, N. Bion, D. Duprez, S. Royer and H. Alamdari, Phys. Chem. Chem. Phys., 2014, 16, 4050–4060 RSC.
- B. Toby, J. Appl. Crystallogr., 2001, 34, 210–213 CrossRef CAS.
- A. C. Larson and R. B. V. Dreele, Gsas General Structure Analysis System, Los Alamos National Laboratory, 2000, pp. 86–748 Search PubMed.
- H. J. Monkhorst and J. D. Pack, Phys. Rev. B: Solid State, 1976, 13, 5188–5192 CrossRef.
- G. Kresse and J. Hafner, Phys. Rev. B: Condens. Matter Mater. Phys., 1993, 47, 558–561 CrossRef CAS PubMed.
- G. Kresse and J. Furthmüller, Phys. Rev. B: Condens. Matter Mater. Phys., 1996, 54, 11169–11186 CrossRef CAS PubMed.
- J. P. Perdew, K. Burke and M. Ernzerhof, Phys. Rev. Lett., 1996, 77, 3865–3868 CrossRef CAS PubMed.
- G. Kresse and D. Joubert, Phys. Rev. B: Condens. Matter Mater. Phys., 1999, 59, 1758–1775 CrossRef CAS.
- P. E. Blöchl, Phys. Rev. B: Condens. Matter Mater. Phys., 1994, 50, 17953–17979 CrossRef PubMed.
- S. Grimme, J. Antony, S. Ehrlich and H. Krieg, J. Chem. Phys., 2010, 132, 154104 CrossRef PubMed.
- C. D. Zeinalipour-Yazdi, Phys. Chem. Chem. Phys., 2019, 21, 19365–19377 RSC.
- C. D. Zeinalipour-Yazdi, J. S. J. Hargreaves and C. R. A. Catlow, J. Phys. Chem. C, 2015, 119, 28368–28376 CrossRef CAS.
- R. Michalsky, P. H. Pfromm and A. Steinfeld, Interface Focus, 2015, 5, 20140084 CrossRef PubMed.
| This journal is © The Royal Society of Chemistry 2021 |

