
 Open Access Article
 This Open Access Article is licensed under a Creative Commons Attribution-Non Commercial 3.0 Unported Licence
Membrane composition and lipid to protein ratio modulate amyloid kinetics of yeast prion protein†
Arnab
Bandyopadhyay
,
Achinta
Sannigrahi
* and
Krishnananda
Chattopadhyay
 *
*
Structural Biology & Bio-Informatics Division, CSIR-Indian Institute of Chemical Biology, 4, Raja S. C. Mullick Road, Kolkata 700032, India. E-mail: krish@iicb.res.in; sannigrahiachinta@gmail.com
First published on 5th February 2021
Abstract
Understanding of prion aggregation in a membrane environment may help to ameliorate neurodegenerative complications caused by the amyloid forms of prions. Here, we investigated the membrane binding-induced aggregation of yeast prion protein Sup35. Using the combination of fluorescence correlation spectroscopy (FCS) at single molecule resolution and other biophysical studies, we establish that lipid composition and lipid/protein ratio are key modulators of the aggregation kinetics of Sup35. In the presence of a zwitterionic membrane (DMPC), Sup35 exhibited novel biphasic aggregation kinetics at lipid/protein ratios ranging between 20![[thin space (1/6-em)]](https://www.rsc.org/images/entities/char_2009.gif) :1 and 70:1 (termed here as the optimum lipid concentration, OLC). In ratios below (low lipid concentration, LLC) and above (ELC, excess lipid concentration) that range, the aggregation was found to be monophasic. In contrast, in the presence of negatively charged membranes, we did not observe any bi-phasic aggregation kinetics in the entire range of protein to lipid ratios. Our results provide a mechanistic description of the role that membrane concentration/composition-modulated aggregation may play in neurodegenerative diseases.
:1 and 70:1 (termed here as the optimum lipid concentration, OLC). In ratios below (low lipid concentration, LLC) and above (ELC, excess lipid concentration) that range, the aggregation was found to be monophasic. In contrast, in the presence of negatively charged membranes, we did not observe any bi-phasic aggregation kinetics in the entire range of protein to lipid ratios. Our results provide a mechanistic description of the role that membrane concentration/composition-modulated aggregation may play in neurodegenerative diseases.
Introduction
Prion proteins are involved in several fatal and transmissible neurodegenerative diseases, including transmissible spongiform encephalopathies, human Creutzfeldt–Jacob disease and sheep scrapie, in which they have been shown to transmit their misfolded shape onto normal variants.1–3 On microscopic examination, the brains of patients with prion disease typically reveal characteristic histopathologic changes, consisting of neuronal vacuolation and degeneration.4–6 In humans, a conformational change of the prion protein between its non-toxic PrPc and a toxic PrPsc form is believed to be responsible for the disease pathology.7–9 PrPsc contains the significant beta sheet, which facilitates the formation of highly insoluble aggregates.10,11 These aggregates are partially resistant to proteolytic digestion.12–14 It is known that amyloidogenic proteins can populate numerous structurally distinguished amyloid forms or strains with distinct phenotypes.15,16 However, little is known about the structural morphology of the diverse amyloid conformers formed under different environmental conditions.There are several prion-like proteins that exist in different fungi including yeast.17 Previous studies suggested that aggregation of Sup35 prion protein may form functional beneficial amyloids for yeast since interaction of prions causes heritable traits.18 Although these yeast prion proteins are not infectious to humans, they carry the same transmissible phenotype as human prion protein. With human prions, an infectious disease propagates through a self-sustaining modification in the structure of a normal protein within the cell, seemingly without the help of any nucleic acid.19 With yeast prions, a similar mechanism yields a new heritable metabolic state, seemingly without a change in any nucleic acid. In addition, the yeast Sup35 protein contains a human prion-like domain.20 A conformation change similar to human prion protein between the PrPC and PrPSC forms has also been found with Sup35 and the proposed mechanism of the propagation of Sup35 aggregation has been found to be identical to that of mammalian prion protein.21,22 Hence, Sup35 has been used extensively and widely as a model protein to study the mechanism of the prion disease.20
Because of the presence of glycosylphosphatidylinositol (GPI)-anchor, human prion proteins are often found associated with lipid membranes.23–26 It is well acknowledged that lipids/membranes induce the aggregation of human prion proteins.24 Whatley et al. have shown that the vacuolation in nerve cells is drastically increased during prion aggregation, which further emphasizes the effect of membrane environments towards the aggregation of prion protein.27 Fei Wang et al., found that the PrP–lipid interaction can be initiated by electrostatics, which can be followed by hydrophobic interactions.14 They show that the protein–lipid interaction can convert full-length R-helix-rich PrP to a PrPSc-like conformation under physiological conditions, supporting the relevance of lipid-induced PrP conformational change to in vivo PrP conversion. Similar to its human counterpart, yeast protein Sup 35 and its interactions with lipids have also been studied. For example, Ganusova et al. and Chernova et al. have shown that lipids/membranes play a role in the aggregation of Sup35 inside yeast cells.28,29 It has been shown by different research groups that Sup35 may propagate as a prion in mammalian cells and the presence of GPI anchoring facilitates aggregate propagation between N2a cells, resembling mammalian prion behaviour.30–33
Here, we report a detailed study on the aggregation kinetics of Sup35 protein in the presence of model phospholipid vesicles using FCS and other biophysical methods. FCS offers a sensitive and convenient method to study biomolecular diffusion under single molecule resolution. In this study, we chose physiologically relevant lipids, DMPC or 1,2-dimyristoyl-sn-glycero-3-phosphocholine and DMPS or 1,2-dimyristoyl-sn-glycero-3-phospho-L-serine, since these are the most abundant components of the membranes of synaptic vesicles.34 We chose the phospholipid DMPC (14:0 saturated, transition temperature ∼24 °C), since it exists in the fluid phase at the physiologically relevant temperature of 37 °C.35 We understand that the use of different chain lengths of the unsaturated and saturated lipids is not ideal, and the same chain length should be used for better comparison.36 Therefore, we used DMPS lipid for studying the effect of a negative lipid component. Our work showed a noble mechanistic pathway of Sup35 aggregation, which is greatly modulated by the lipid concentration and composition.
Our results suggest that at a particular lipid/protein ratio (defined as OLC, optimum lipid concentration from now on) the aggregation kinetics followed an interesting biphasic pattern. In contrast, the aggregation profile of Sup35 attained the monophasic nature when the aggregation occurred in the presence of high (ELC, excess lipid concentration) and low lipid/protein ratios (LLC, low lipid concentration). The kinetics is monophasic, also in the absence of lipid. The presence of a negatively charged membrane also showed the monophasic aggregation kinetics of Sup35.
Results
The model structure of Sup35NM
For the present study, we used the NM region of Sup35NM protein, which has been shown by in vivo and in vitro studies to govern the prion status of the protein.20,37–39This NM domain is responsible for the formation of toxic amyloid structures after a lag phase.20,40 Since the understanding of the lipid binding site would require structural insights of the protein, we developed a model structure using its sequence homology with structurally known prion proteins including that from S. pompe (Fig. S1A, ESI†) and humans (Fig. S1B, ESI†). For the model generation, we used a composite approach through iterative threading assembly refinement (ITASSER) of the Zhang lab server. This method combined threading, ab initio modelling and atomic level structure refinement methods, and the model with the best confidence score was accepted as the optimum structure (Fig. 1).
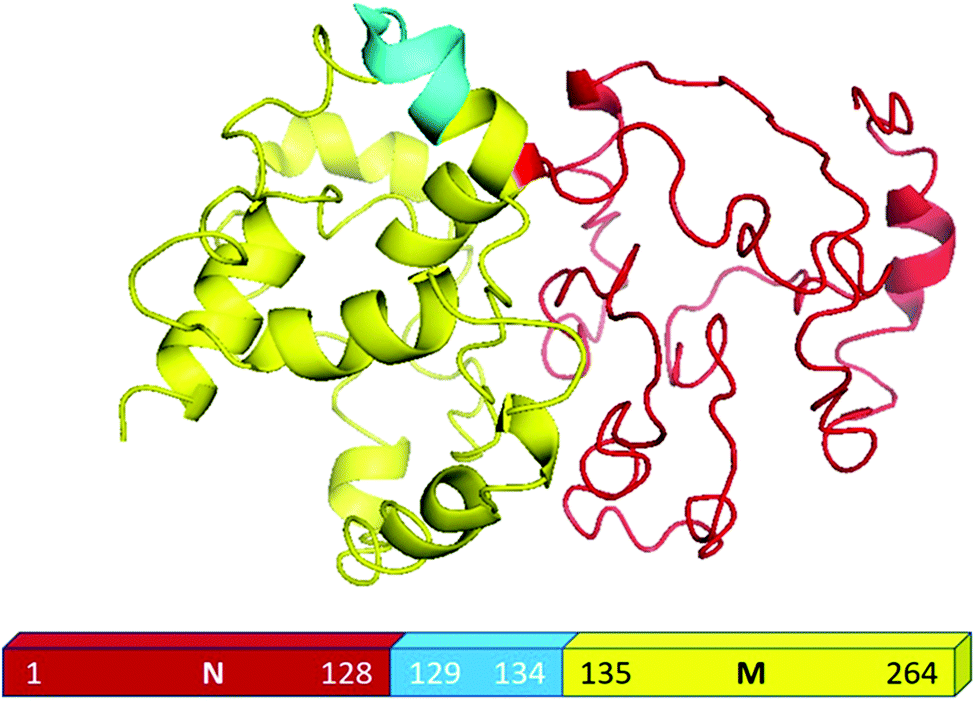 | ||
| Fig. 1 Structural modelling of Sup35NM. This model structure provided the best confidence score from the I-TASSER analyses. The structure of the NM region of Sup35NM has been given. The palindromic sequence stretch129[QKQQKQ]134 in the NM region of Sup35NM has been marked in blue. | ||
We validated the model structure using a number of computational methods. Ramachandran plot analysis (https://swift.cmbi.umcn.nl/cgi//PictureCGI.py) showed that all residues in the model occupied the generously allowed region. In the generously allowed region, 70% of the residues were found inside the favoured region (Fig. S1C, ESI†), while the rest were predominantly turns, loops and disordered. In addition to the Ramachandran analyses, we also used the proSA algorithm (https://prosa.services.came.sbg.ac.at/prosa.php) to study the overall quality of the model (Fig. S1D, ESI†), using which we compared the Z score of the present model against all other experimentally determined structures available in the current PDB database. Z score represents the deviation of total energy of the structure with respect to an energy distribution derived from random conformations. The NMR and X-ray crystal structures in Fig. S1D (ESI†) are shown using dark and light blue colours respectively, while the black dots represent the predicted model of Sup35NM. We observed that the Z score value of the predicted model was located well within the region of structures determined by X-ray methods. The plot of the local model quality predicted by the proSA program by plotting energies vs. amino acid sequence over the window of 40 residues and 10 residues showed that the energy values of all residues in our predicted model are under zero (Fig. S1E, ESI†). We estimated that the model structure would contain approximately 25% alpha helix and 2% beta sheet, while the rest would be random coil/disordered. It has been previously shown that the short prion recognition elements within the N-terminal domain (N), termed as the head and tail may form homotypic intermolecular contacts. While both regions undergo nucleation, the head region is known to acquire the productive interactions first.41
Interaction of Sup35NM with lipid vesicles
To obtain a preliminary understanding of the membrane binding affinity of Sup35NM, we used a computational method using the OPM (orientation of protein in membrane) server. Using the model structure as its input, the OPM server calculated the free energy of membrane binding to be −3.6 kcal mole−1 (Fig. 2A). The calculation predicted that the sequence stretch between 130 and 143, which is mostly a flexible loop region, would potentially be the membrane interacting region. We observed an average tilt angle of 53° between the membrane surface and the interacting stretch of the protein (Fig. 2A). Interestingly, we found in this sequence stretch of Sup35NM the presence of a polar palindromic sequence stretch129[QKQQKQ]134, which may have an important role to play. We noted that a hydrophobic palindromic sequence stretch112[AGAAAAGA]119 in the human prion protein is found to be a key motif for membrane binding and aggregation progression.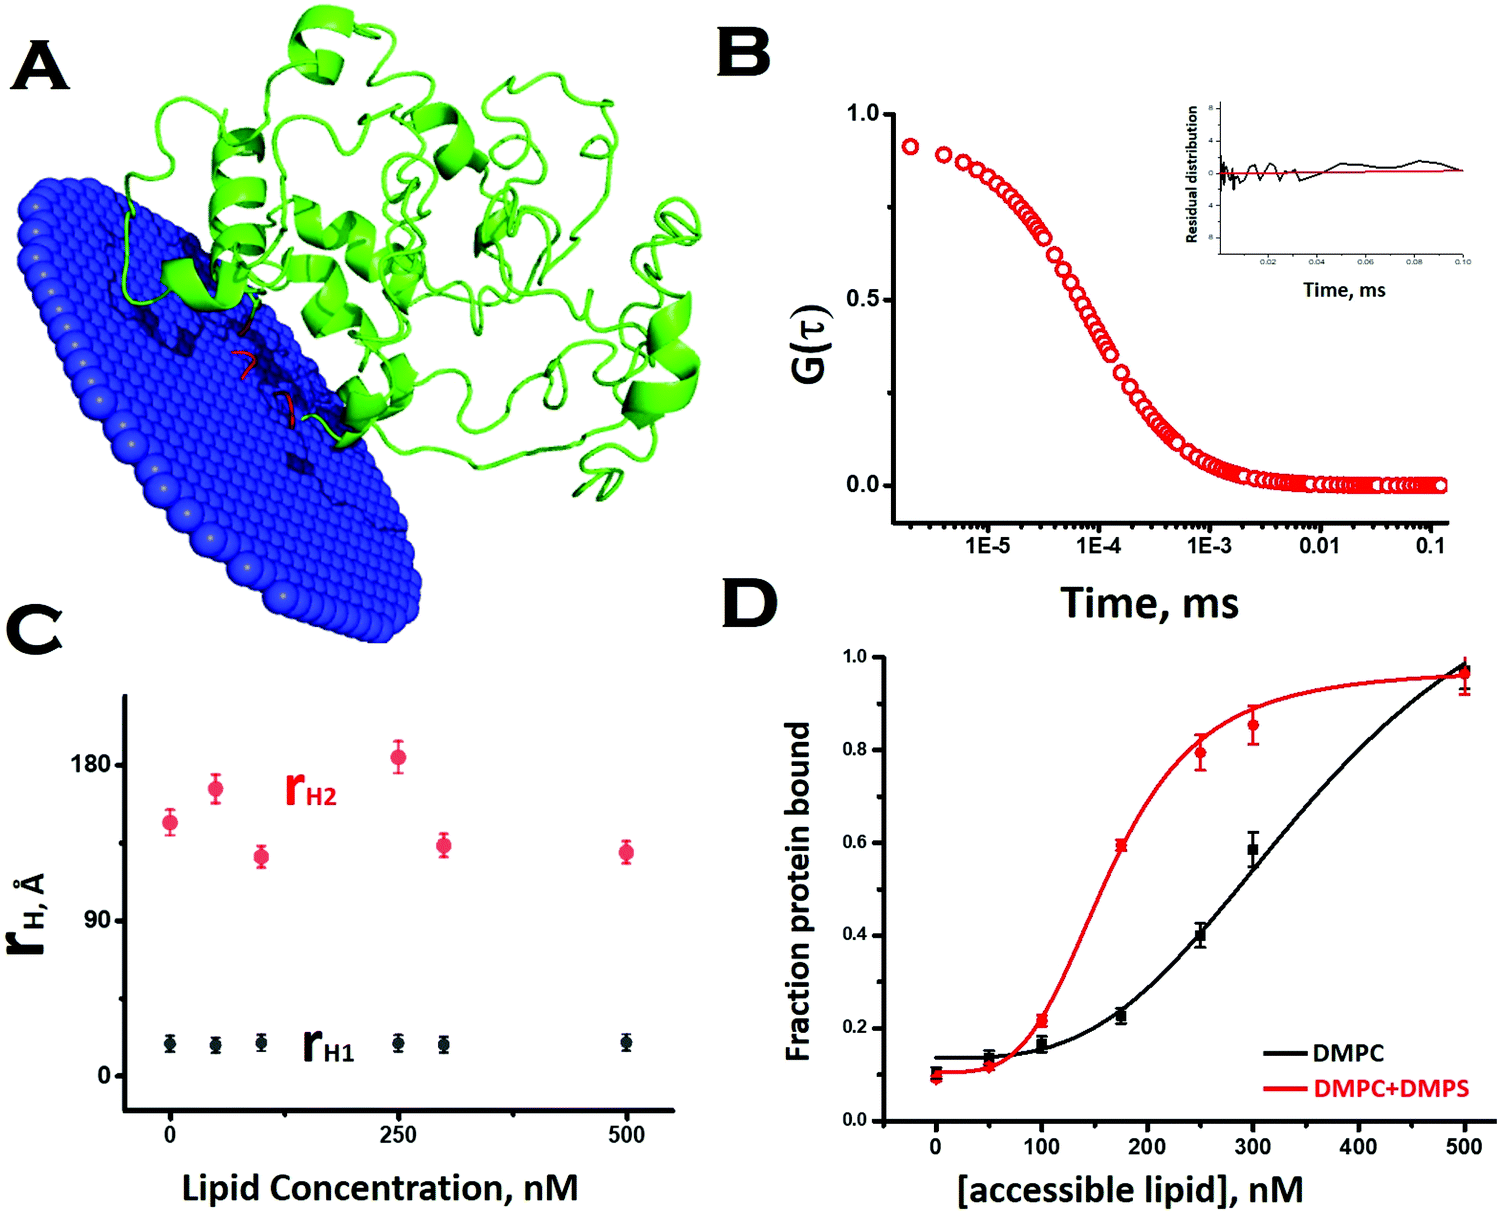 | ||
| Fig. 2 Interaction of Sup35NM with lipid vesicles. (A) OPM (orientation of protein in membrane) server to calculate the free energy of membrane binding of Sup35NM. Lipid interacting (or membrane inserting) region of the modelled protein is highlighted in red. The lipid interacting residues of Sup35 are 134, 137–138, and 143. (B) Correlation function obtained from FCS experiments using 10 nM Rho-Sup35NM in an aqueous buffer at pH 7.5. Inset shows the residual distribution with respect to time. (C) rH values for both components, which remained constant throughout the concentration range of DMPC SUVs. (D) The increase in the fraction/ratio of the membrane bound form of Sup35 with increasing concentration of lipid, the black line for protein binding to DMPC vesicles only and the red line for protein binding to phospholipid vesicles composed of DMPC and DMPS (50:1). | ||
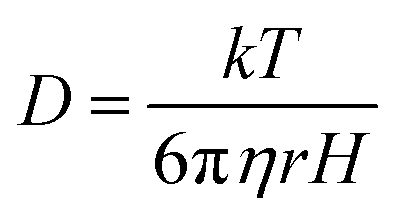
To investigate experimentally the membrane binding, we resorted to fluorescence correlation spectroscopy (FCS). For FCS experiments, we labelled the N-terminal of Sup35NM using Rhodamine Green (Rho-Sup35NM). Fig. 2B shows a typical correlation function, which was obtained from FCS experiments using 10 nM Rho-Sup35NM in an aqueous buffer at pH 7.5. In the absence of lipid, the correlation function was fit to a model containing a single diffusion component, and the goodness of the fit was established using the randomness of the residual distribution. Using the value of diffusion coefficient (D) obtained from FCS, we determined the experimental value of rH (rH,exp) for Rho-Sup35NM to be 18.5 Å. We compared the value of rH,exp with the theoretical value of rH (rH,theo), which we calculated using the Hydropro42 by inputting the model structure of Sup35NM and observed the hydrodynamic radius of Sup35NM to be 16 Å.
In the presence of zwitterionic (DMPC) and negatively charged (DMPS) SUVs, the correlation functions were fit using a model of two diffusing components in which the rapidly diffusing fast component represented the unbound monomeric protein, while the slow component would be the membrane bound protein. In the presence of different concentrations of DMPC SUVs, the values of rH corresponding to the fast (monomeric protein, 18.5 Å) and slow (membrane bound, 140 Å) components remained constant (Fig. 2C). In contrast, as we increased SUV concentrations, we observed an increase in the fraction of the membrane bound Sup35NM (slow component) with a decrease in the fraction of the free monomer (fast component) (Fig. 2D). The increase in the fraction/ratio of the membrane bound form of Sup35 with increasing concentration of lipid is shown in Fig. 2D, where the black line represents protein binding to DMPC vesicles only and the red line represents protein binding to phospholipid vesicles composed of DMPC and DMPS (50:1). We used a sigmoidal fitting function to fit the dependence of these fractions with DMPC concentrations to determine the values of association constant (Ka ∼ 2.7 × 10³ M−1). It was observed that the presence of a negatively charged component (DMPC:DMPS 50:1), significantly increased the membrane binding affinity (Ka = 6 × 10³ M−1).
We used far UV CD to investigate the change in protein secondary structure as a result of membrane binding.43 Far UV CD experiments show double minima at 208 nm and 222 nm suggesting an alpha helical structure (Fig. 3A). In the presence of DMPC vesicles, CD data suggested a decrease in helical structure (Fig. 3A). In the presence of negatively charged vesicles (DMPS/DMPC 50:1), the helical content of Sup35NM decreased further. Far UV CD data were complemented by measuring FT-IR. From the carbonyl (C![[double bond, length as m-dash]](https://www.rsc.org/images/entities/char_e001.gif) O) stretching vibrations of amide-I (beta sheet: 1633–38 cm−1, alpha helix: 1649–1656 cm−1, disordered (1644 cm−1), and turns and loops (1665–1672 cm−1), we calculated the percentages of secondary structures (Fig. 3B). We found from the FT-IR data that Sup35NM contained a 35% alpha helical structure, which was similar to the helical contents determined from the model structure (25%). Similar to what was observed with far UV CD, FT-IR analyses suggested a decrease in helical content (to 22%), as DMPC vesicles were added (Fig. 3C). The alpha-helical content of Sup35NM was found to be about 19% in the presence of a lipid vesicle composed of DMPC/DMPS 50:1 (Fig. 3D).
O) stretching vibrations of amide-I (beta sheet: 1633–38 cm−1, alpha helix: 1649–1656 cm−1, disordered (1644 cm−1), and turns and loops (1665–1672 cm−1), we calculated the percentages of secondary structures (Fig. 3B). We found from the FT-IR data that Sup35NM contained a 35% alpha helical structure, which was similar to the helical contents determined from the model structure (25%). Similar to what was observed with far UV CD, FT-IR analyses suggested a decrease in helical content (to 22%), as DMPC vesicles were added (Fig. 3C). The alpha-helical content of Sup35NM was found to be about 19% in the presence of a lipid vesicle composed of DMPC/DMPS 50:1 (Fig. 3D).
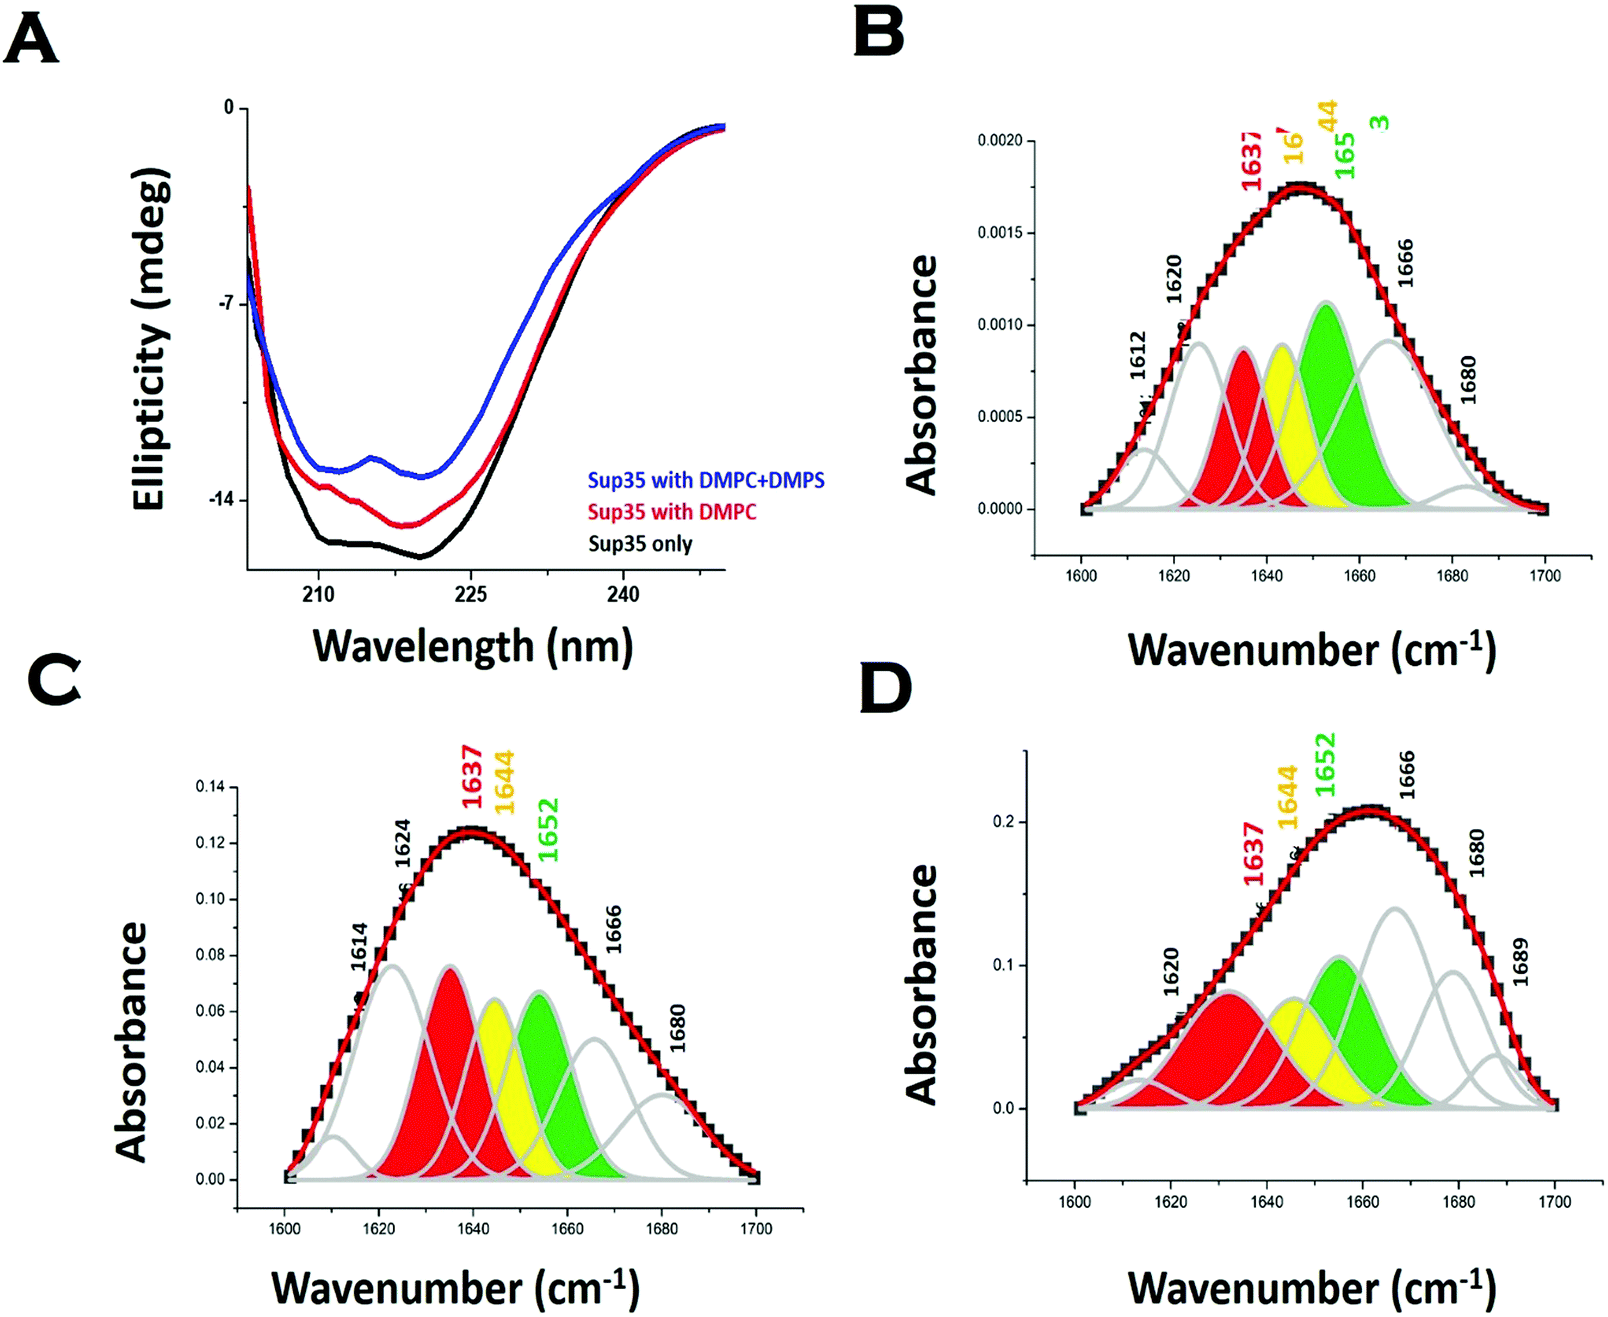 | ||
| Fig. 3 Membrane binding leads to a change in Sup35NM structure. (A) Far UV-CD spectra of Sup35NM in the absence and presence of lipids. FTIR spectra of the amide-I region of CO vibrational frequency of Sup35NM in (B) the absence of lipid, (C) the presence of DMPC and (D) the presence of phospholipid vesicles composed of DMPC and DMPS (50:1). The concentration of Sup35 protein was 20 μM and the concentration of lipids was 5 μM for the FT-IR studies. The color-coded regions signified different conformational states of the protein. Red region indicates the beta-sheet conformation; yellow region belongs to the disorder conformation, whereas the green region stands for the alpha helical structure. | ||
Aggregation kinetics of Sup35NM in the absence and presence of a membrane
We subsequently studied the effect of the interacting membrane on the aggregation kinetics of Sup35NM. For the initial assessment of the aggregation kinetics, we used the fluorescence intensity enhancement of Thioflavin T (ThT). ThT is known to bind to protein aggregates with cross beta structure giving rise to a large increase in its fluorescence intensity.44 In the absence of membranes, the aggregation kinetics did not show any significant extent of lag phase, suggesting the possibility of the seeded aggregation. Although the ThT fluorescence assay showed that Sup35NM aggregation kinetics reached the saturation phase at ∼54 hours, we continued the experiment for more than 150 hours to observe the saturation phase of aggregation. Glover et al. have recently carried out extensive characterization of Sup35NM aggregation kinetics using Congo red assay with different concentrations of the protein. They found that the aggregation kinetics became faster as the concentration increased. We found that our aggregation kinetics was somewhat slower than the kinetics they observed using a similar concentration.19 There are three main differences in the experimental conditions between the present and those of Glover et al.: (a) the probe: while we used ThT fluorescence, Glover et al. measured aggregation kinetics using Congo red, (b) the protein stock: we used protein stock freshly prepared for our measurements, while Glber et al. used diluted protein from stored stocks. In addition, while we used dialysis to remove the small molecule aggregates, Glover et al. used column chromatography using a Q-sepharose fast flow column and (c) the assay conditions: for the present assay we used 20 mM sodium phosphate buffer in contrast to Glover et al., who used potassium phosphate as their buffer of choice. We are currently trying out different experimental conditions to understand the roles of these and other contributing factors towards Sup35NM aggregation.Since ThT fluorescence has small dependence on lipid concentrations (Fig. S4, ESI†), suitable background correction was used for each time point of aggregation kinetics carried out in the presence of lipids. The concentration of Sup35 protein used for the experiments was 30 μM. In our work, low lipid concentration or LLC refers to a lipid concentration below 300 μM (or lipid to protein ratio of 10:1). The optimum lipid concentration or OLC was between the lipid concentrations of 600 μM and 2100 μM (or between lipid to protein ratios of 20:1 and 70:1). The excess lipid concentration was above 2400 μM to 3000 μM (or between lipid to protein ratios of 80:1 and 100:1). We have grouped these lipid concentrations based on their abilities to modify the aggregation landscapes of the Sup35 protein. At a certain lipid concentration range, the aggregation landscape of Sup35 attained a novel bi-phase pattern, so we labelled it as the optimum lipid concentration. Below and above this optimum concentration, the aggregation landscape was mono-phasic, so we labelled them as low lipid concentration range and excess lipid concentration range.
In the presence of low lipid to protein ratio (LLC condition), we observed a slight increase in the rate of aggregation (the exponential increase started at an earlier time point). Interestingly, the extent of aggregation (as measured by the intensity of ThT fluorescence at the saturation phase) remained similar in both conditions (Fig. 4A). In the presence of high lipid to protein ratios of DMPC (OLC condition), both the rate and extent of Sup35NM aggregation increased as the concentration of SUVs increased (Fig. 4B). More importantly, we found that in these ratios, the aggregation kinetics consisted of two sigmoidal phases. At an ELC condition of DMPC, the rate of aggregation was slightly increased with lipid concentration with a small change in the extent of aggregation. In these ratios, the aggregation kinetics became mono-phasic again (Fig. 4C). Subsequently, we studied the aggregation kinetics in the presence of a negatively charged lipid membrane (phospholipid vesicles composed of a mixture of DMPC and DMPS in the ratio of 50:1). Surprisingly, it was found that the aggregation kinetics followed a monophasic character in the entire range of L/P ratio (Fig. 4D).
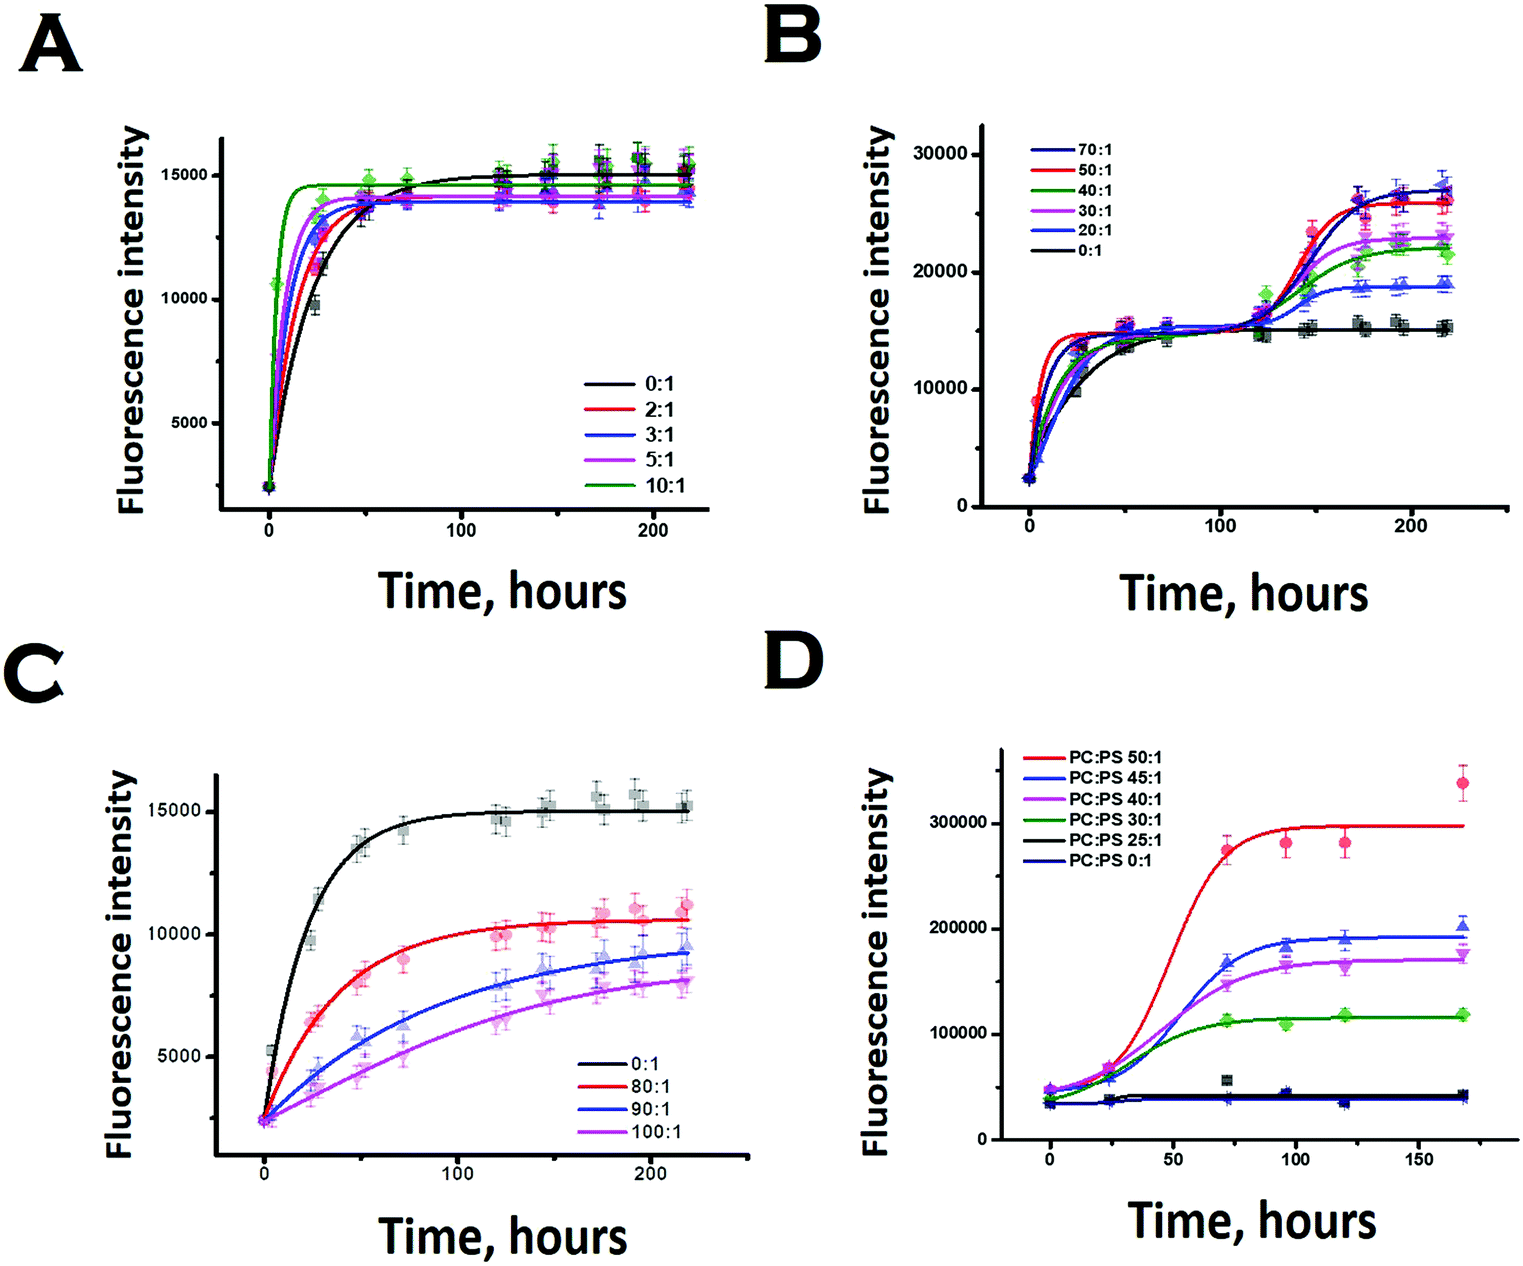 | ||
| Fig. 4 Thioflavin T fluorescence assay showing aggregation of Sup35NM in the absence and presence of lipid vesicles. (A) At LLC of DMPC. (B) Increase in the rate and the extent of Sup35NM aggregation with increase of DMPC concentration at OLC. (C) Rate of aggregation was slightly increased with a concomitant sharp decrease in the extent of aggregation in the presence of ELC of DMPC. (D) Aggregation kinetics in the presence of a negatively charged lipid membrane (DMPC:DMPS, 50:1 and lower ratios) and by maintaining the L/P ratio at 50:1. | ||
We then complemented ThT aggregation data using FCS. For the FCS experiments, we used 10 nM labelled protein in the presence of excess unlabelled Sup35NM for the aggregation to occur. We used three different lipid-to-protein ratios (0:1, 50:1 and 100:1) of DMPC SUVs. A lipid to protein ratio of 0:1 represents the absence of lipid. In the absence of lipids, correlation functions at different incubation times were fit to a sum of two components using the following Scheme 1:
 | ||
| Scheme 1 | ||
In this scheme, the monomeric protein (denoted by P) would form aggregates (denoted by P–P) and the correlation function data could be analyzed by a two component model with the diffusion time of τD,M for the monomer (with amplitude of aM) and of τD,Agg (amplitude of aAgg) for the aggregates, respectively. As expected, aM + aAgg = 1. Similar terminology and parameter notations are used subsequently for Schemes 2 and 3 below.
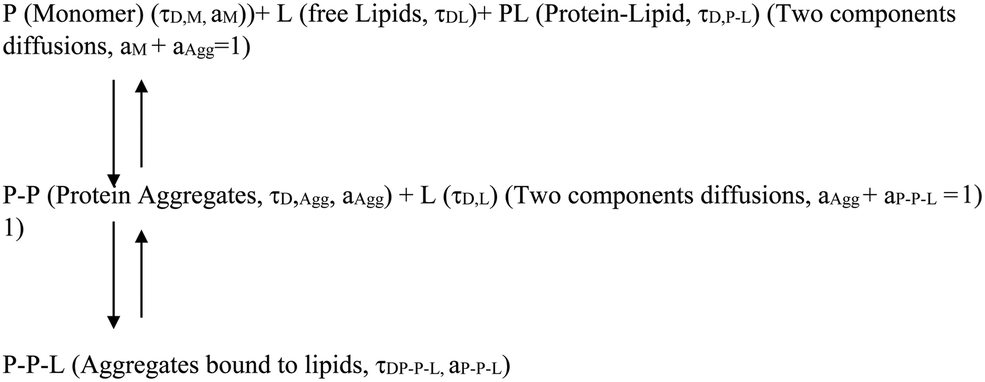 | ||
| Scheme 2 | ||
 | ||
| Scheme 3 | ||
Please note that P–P in the above equation indicates a multimolecular aggregate, and not necessarily a dimer. Since FCS data analyses required multiple components and the number of components varied for different conditions, we determined the values of average diffusion times (τDav) from individual components using eqn (5). Fig. 5D shows the variations of τD,av with time in the absence of lipids. The values of τD,av increased with incubation time following sigmoidal aggregation kinetics. Comparing the aggregation kinetics monitored by ThT fluorescence and FCS, we noted that they did not superimpose. Although the kinetics measured by both methods saturated approximately at similar hours, ThT monitored kinetics is hyperbolic, while the FCS monitored one is sigmoidal (Fig. S5, ESI†). In order to get further insights into this difference, we have plotted in Fig. 5G, the fractional population of the monomer (P) and (P–P) aggregates with respect to incubation time. As observed in Fig. 5G, the amplitude of the aggregated component increased in a sigmoidal fashion, while that of the monomer decreased. The data suggest that the difference (hyperbolic in ThT fluorescence vs. sigmoidal in FCS, Fig. S5, ESI†) comes from a relatively small fraction of ThT active aggregates at the beginning of the aggregation kinetics. Further studies would be needed to further characterize the nature of these early aggregates.
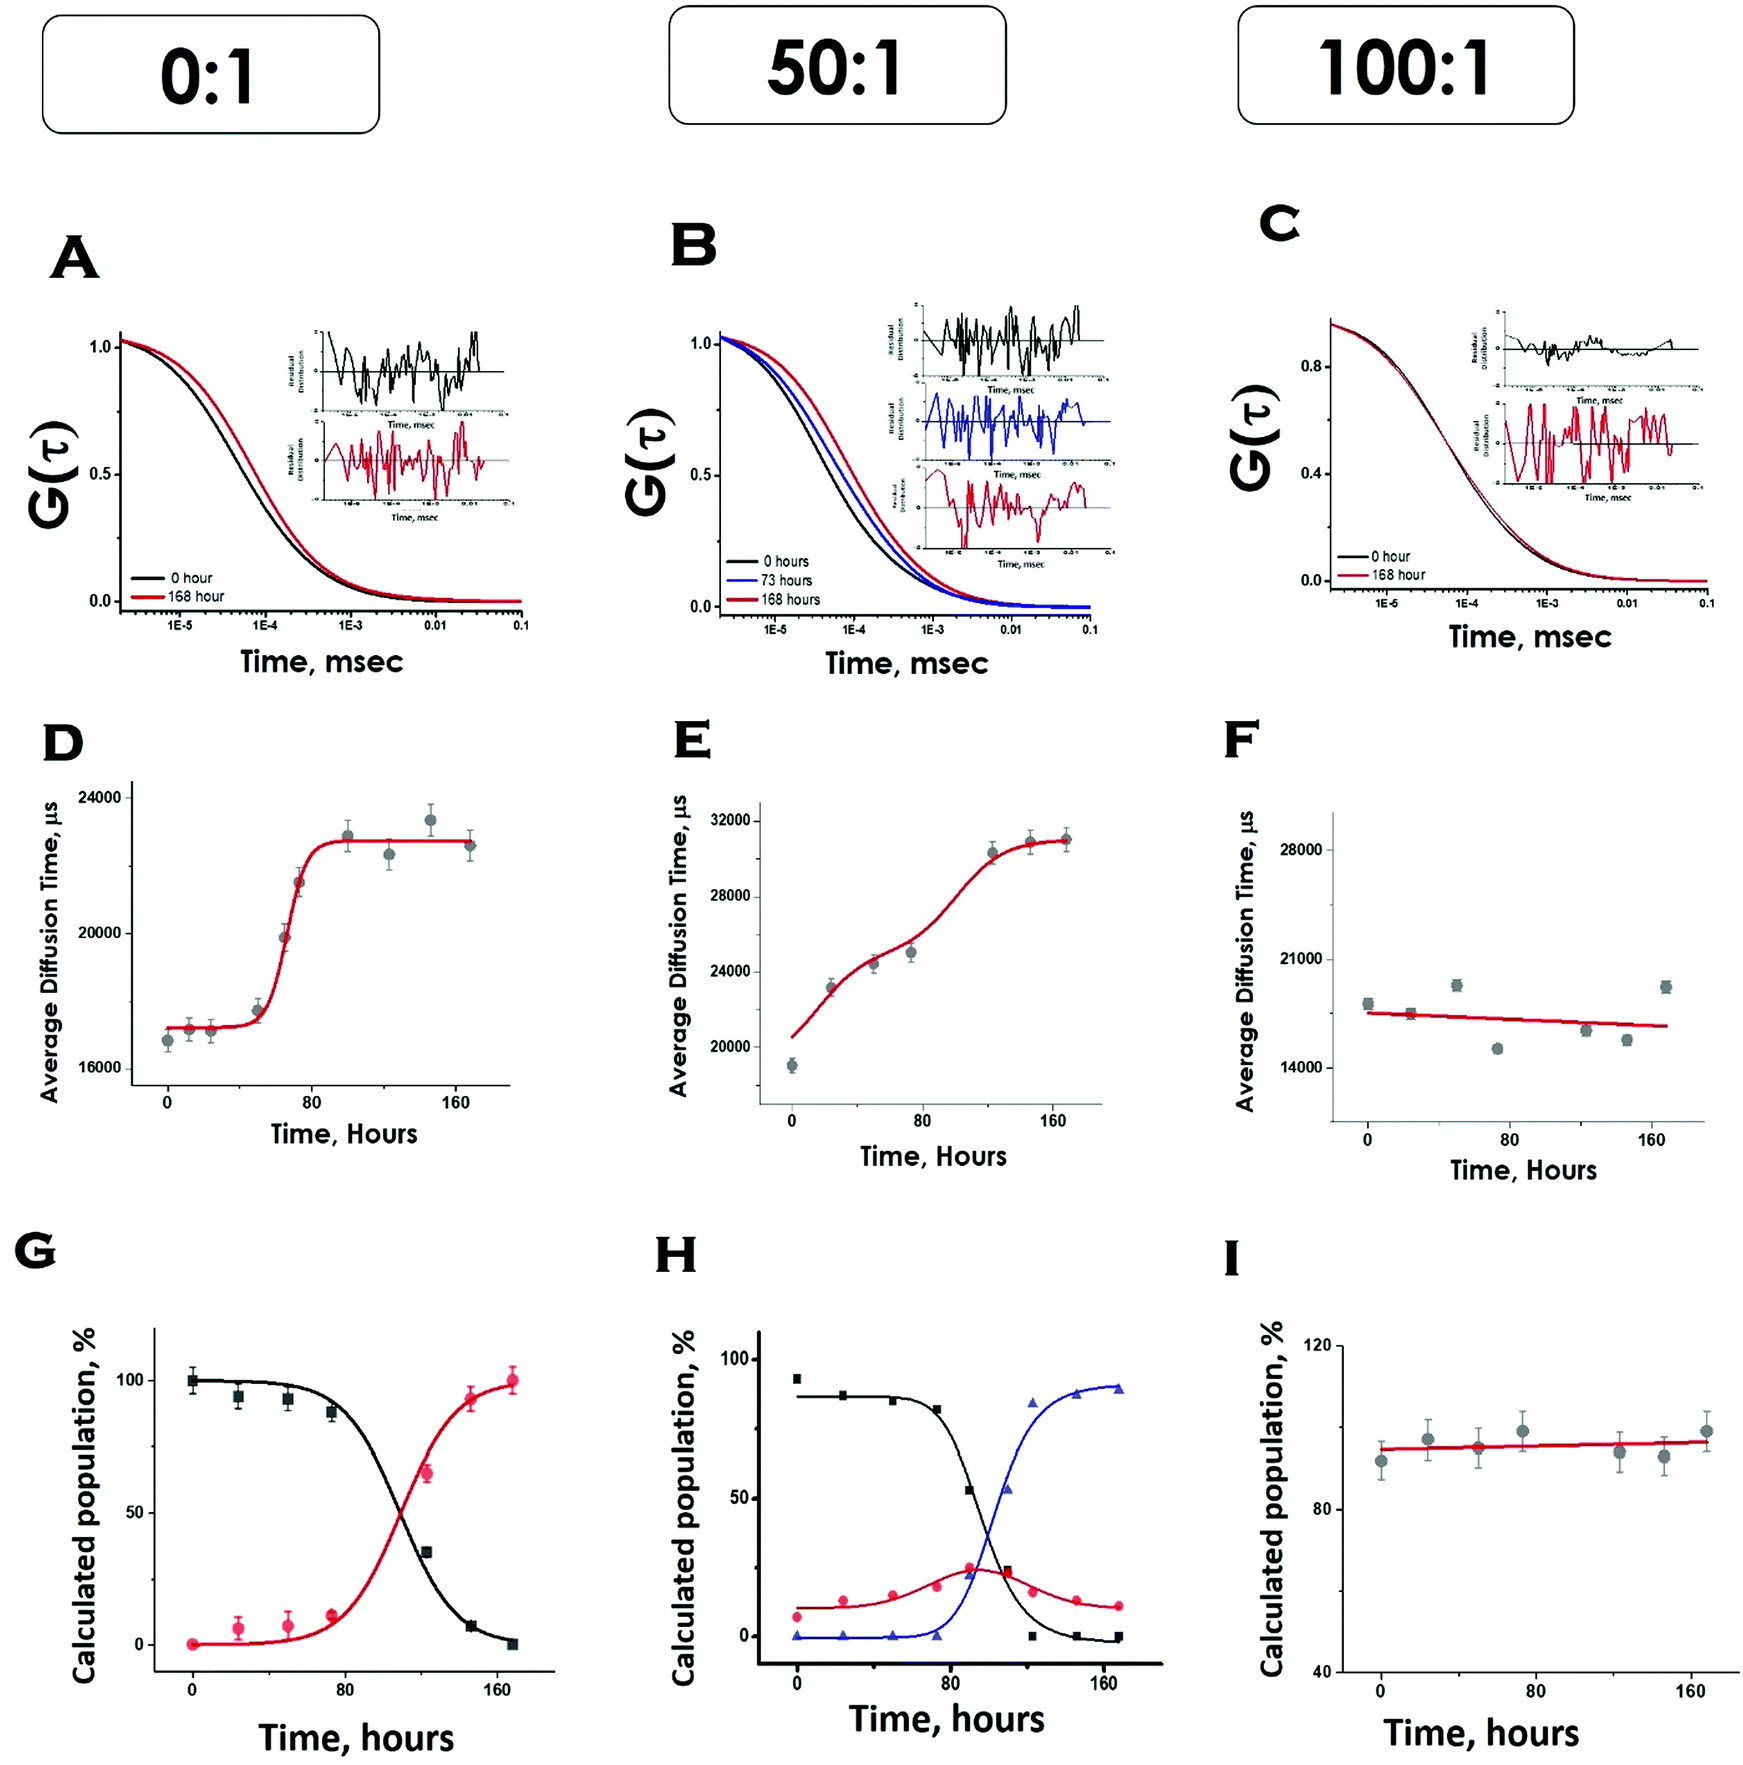 | ||
| Fig. 5 FCS data showing aggregation of Sup35NM in the absence and presence of lipid vesicles. The G(τ) was plotted with time as shown in A, B and C. The average diffusion time of the protein aggregates were plotted with time as shown in D, E and F. The relative populations or amplitudes of fast (monomer) and slow (aggregates) with respect to time were elucidated from their amplitudes as shown in G, H and I. In G and H black, red and blue lines show the populations of protein monomers, protein–protein aggregates and membrane bound protein aggregates, respectively. In I, the red line shows the population of membrane-bound protein aggregates in figure A, B and C, the insets show the residual distribution of the fitted curves. | ||
Under OLC conditions of DMPC (lipids to protein ratio of 50:1), the correlation functions were initially fit to a two-component diffusion model. Under this condition, the variation of the amplitude of the aggregated component with incubation time followed two-phase aggregation kinetics (Fig. 5E), the trend of which was similar to that observed with ThT fluorescence. We used the following equation scheme (Scheme 2) to analyse the FCS data obtained under this condition.
We can ignore τD,L because the lipid is not labelled and hence free lipid would not contribute to the correlation function. In this condition (OLC), the protein remained mostly free at the zero time point and at room temperature, and hence τD,P–L can also be ignored. The first part of Scheme 2 assumes the formation of protein–protein aggregates, which binds to the lipid in the second part. The component analyses from the FCS fit show the decrease in the amplitude of the monomeric protein as the amplitude of an intermediate aggregate species (P–P) formed. The amplitude of the intermediate decreased with time, as a final aggregated species (P–P–L) started forming (Fig. 5H).
In contrast, in the presence of high DMPC concentration (ELC condition of DMPC, lipids to protein concentration of 100:1), we did not see any variation in the amplitude of the aggregated component with incubation time. As a matter of fact, the correlation functions obtained in this condition were fit optimally using a single component, and the amplitude of this component remained unaltered with incubation time (Fig. 5I). The following Scheme 3 was used to analyse the FCS data for this condition.
The species (P–L)n indicates the possibility of combining several protein–lipid complexes, which do not seem to be happening. The species P–P′–L is also an aggregated protein species, which is bound to lipid molecules (see Scheme 2 above). Since FCS data are fit to only one component diffusion model, the analyses suggest that the species P–L (monomeric protein bound to lipid) and P–P′–L (a protein aggregate bound to the lipid) have similar values of rH. This condition is satisfied when a fibril-like aggregate is wrapped around a large lipid molecule, in which condition there would not be much difference between a lipid bound monomer and a lipid bound aggregate. In the next section, we used AFM to validate this possibility.
We used AFM to substantiate the above FCS analyses in the absence and presence of membranes.45 Control DMPC SUVs showed a round-shaped morphology of the diameter ∼180 nm (Fig. 6A and L in Scheme 2 above). In the absence of the membrane, Sup35NM (P in Scheme 1) formed aggregates of elongated fibrillar shape (Fig. 6B and P–P in Scheme 1). The average length of Sup35NM fibrils was found to be ∼2.5 μm with a height of 3.4 nm (Fig. 6B). In the presence of DMPC under the OLP condition, AFM images at the first plateau (∼100 hours) (Fig. 6C) suggested the coexistence of few fragmented fibrils (P–P) along with intact lipid vesicles (L). AFM images at the second plateau (∼200 hours) clearly show the association of the vesicles with the fibrillar aggregates forming a “curved-branched” morphology (Fig. 6D). Similar morphology of Sup35NM aggregates were observed in the presence of negatively charged vesicles (DMPC:DMPS, 50:1) at the saturation level (∼100 hours) of aggregation (Fig. 6E). The average size/length of Sup35NM aggregates was found to be ∼1.8 μm in the presence of a membrane (15 nm in height). At the ELP conditions, tiny fragmented Sup35 fibrils associated with lipid vesicles were observed. AFM imaging showed spherical species of free lipid-like particles (Fig. 6F), which were bound onto protein aggregates.
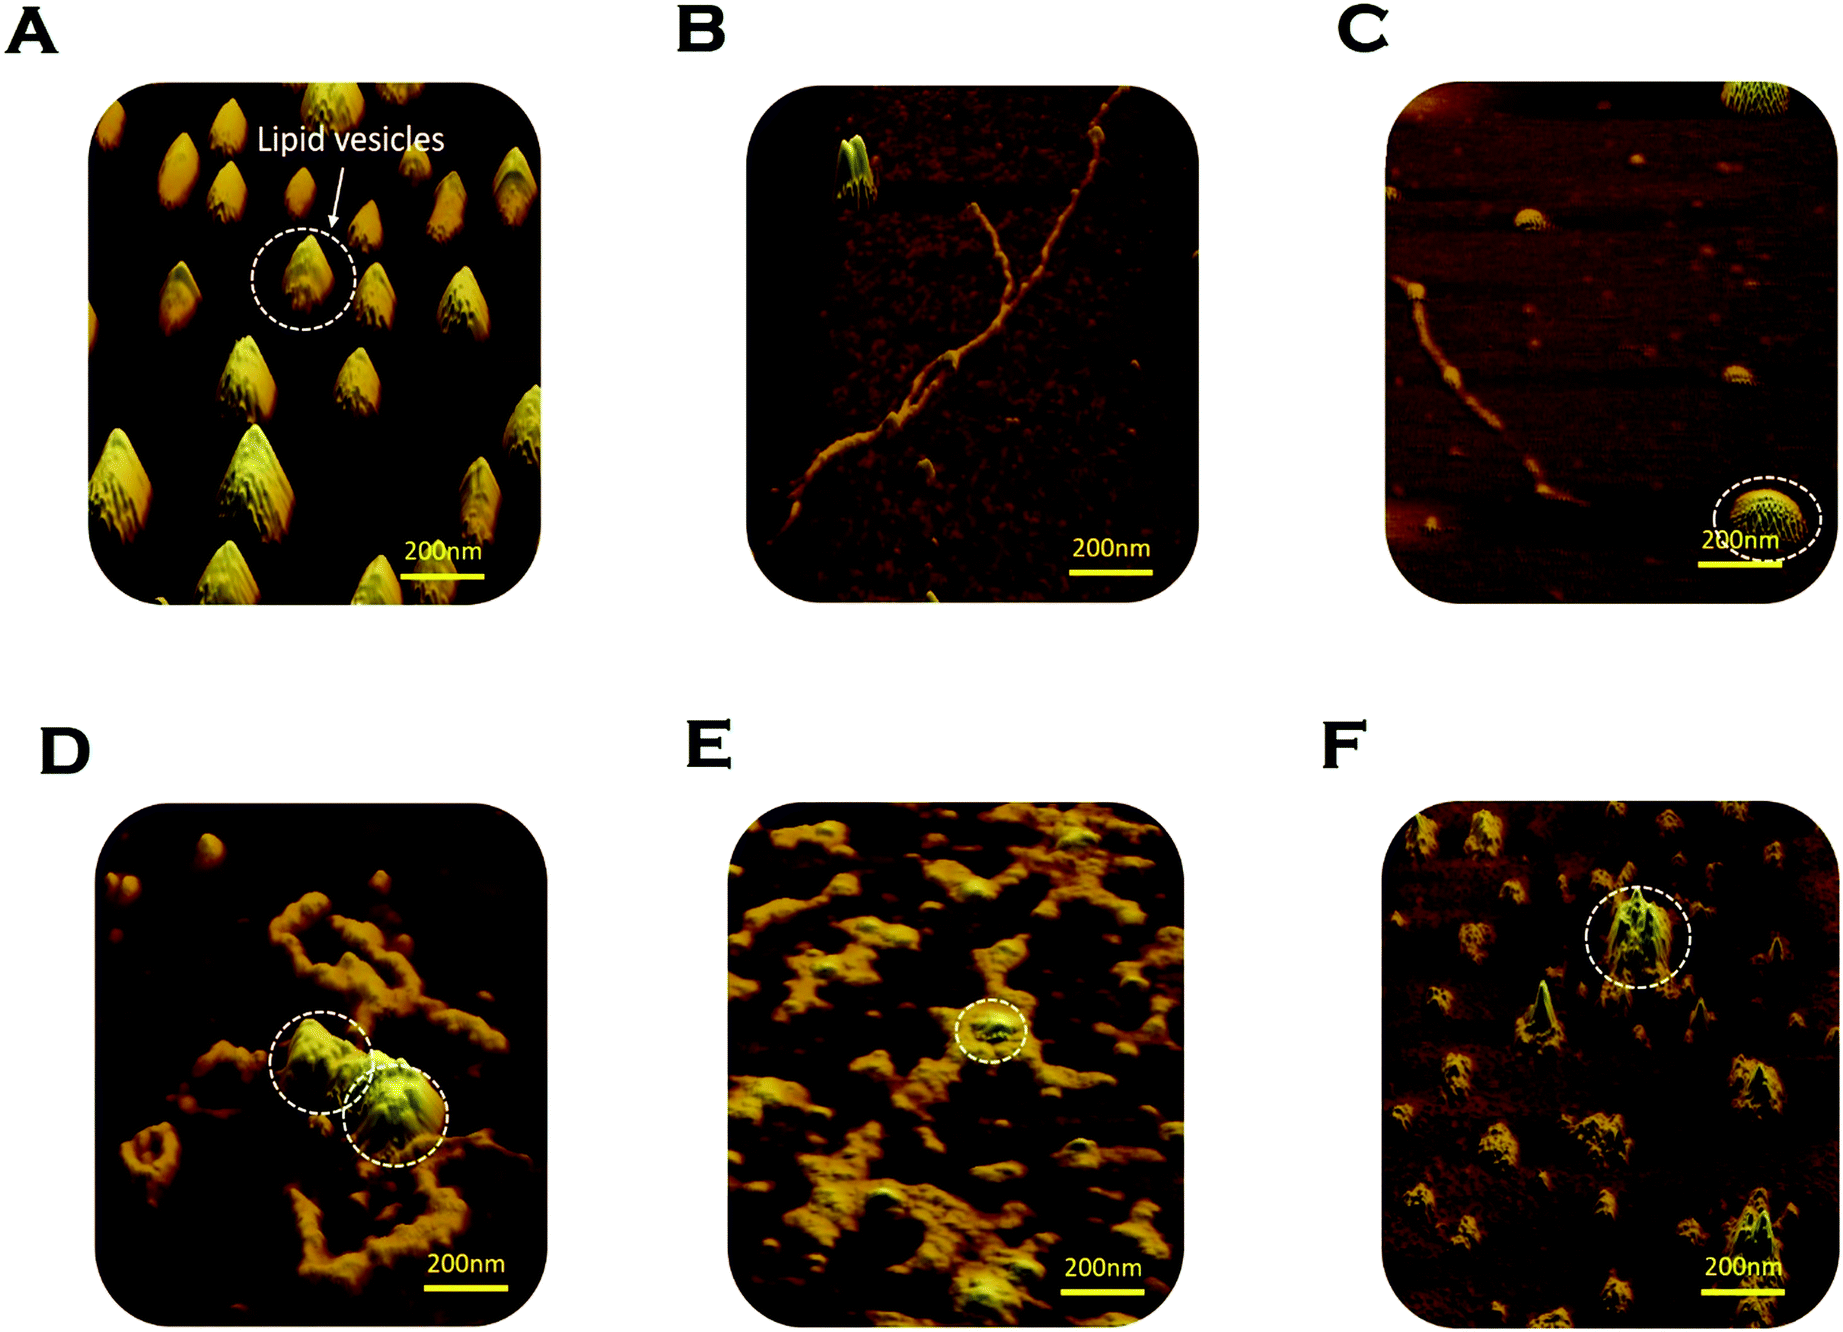 | ||
| Fig. 6 Morphological features of Sup35NM aggregates studied by atomic force microscopy (AFM). (A) DMPC SUVs were observed as “round balls”. These lipid vesicles are marked by the white circle. (B) Sup35NM aggregates looked like elongated fibrils in the absence of lipid vesicles. (C) Coexistence of small Sup35NM fibrils and intact DMPC lipid vesicles imaged at the first plateau (100 hours) of the aggregation curve of lipid to protein ratio of 50:1. (D) Curvy and branched fibrillar structures of Sup35NM aggregates were found to protrude around the lipid vesicles when incubated with DMPC SUVs (L/P, 50:1) for 200 hours. (E) AFM image of Sup35NM in the presence of negatively charged membrane, (DMPC:DMPS, 50:1) by maintaining the L/P ratio at 50, showed curvy and branched fibrillar structures, which protruded around the lipid vesicles at 100 hours. (F) Existence of a crowd of DMPC lipid vesicles associated with tiny fragmented fibrils was imaged at L/P 100:1 at 200 hours. | ||
Aggregate-induced toxicity in mammalian cells
Subsequently, we studied the toxicity profiles of Sup35NM aggregates. SH-SY5Y cells were incubated for 12 h with Sup35NM aggregates (aggregates formed at 200 h of incubation). An MTT assay was performed under the treatment of Sup35NM aggregates formed in different lipid/protein ratios (0:1, 50:1 and 100:1) of DMPC vesicles. Three different concentrations of each aggregate sample were used for the assay to trace the dose-dependent cell viability (Fig. S2A, ESI†). The error bars represent the standard deviation. A slight reduction in the cell viability (89% viability) was observed, while the cells were treated with only lipid vesicles. The viable cell population was found to be higher for the treatment of the aggregates in the absence of membrane (lipid/protein ratio of 0:1), than that in the presence of membrane in the lipid/protein ratio of 50:1. In contrast, cell viability was found to be the highest after treatment with aggregates that were formed in the presence of membrane with a lipid/protein ratio of 100:1. For each ratio, a successive decrease in the viable cell population was observed with an increase in the concentration of aggregates. The presented results suggest that there was a nice correlation between the cellular toxicity and the lipid/protein ratio, with a DMPC L/P ratio of 100:1 being the least toxic and an L/P ratio of 50:1 having the highest toxicity toward the mammalian cells.
These experiments were further complemented by calcein release assay using a dye entrapped model membrane system. A calcein release assay suggested the fast release and rupture of the membrane by the aggregates formed in the presence of a membrane at the L/P ratio of 50:1 (release 83%), (Fig. S2B, ESI†). The rate and extent of dye release was significantly dropped when entrapped vesicles were treated with aggregates formed in the presence of membrane at the L/P of 100:1 (release 60%), whereas Sup35NM aggregates formed in the absence of DMPC SUVs showed intermediate release and rupture of the membrane (release 72%). It may be mentioned that the toxicity experiments have been carried out in mammalian neuroblastoma cell lines and these experiments do not represent viability measurements in yeast.
Discussion
Our representation of the OLC condition, where two transitions depict protein aggregation followed by binding, is a minimal model that supports the presented FCS, AFM and lipid binding data. However, we do not rule out the possibility of the phenomenon, where under the optimal lipid concentration, a fraction of the monomer–protein molecules can bind to vesicles instantly, even before 100 hours. Due to pore formation on the membrane, this would be a slow process, thereby destabilizing the fibril formation. Over time some of the membrane vesicles will fuse resulting in more stability and creation of a larger surface area that would then allow further fibrillation to take place supporting the biphasic observation. While this process is silent towards the spectroscopic and imaging characterization described in the present work, this may have important implications in the observed toxicity in mammalian cells under the OLC conditions. Fig. 7 shows the scheme of Sup35NM aggregation in the presence of various concentrations and compositions of lipid vesicles. Sup35NM binds both to the membrane (membrane binding regime) and to itself (self-association regime). A lipid to protein ratio of 0:1 is a convenient example of a boundary condition of the self-association regime, in which membrane binding is completely absent. AFM images of Sup35NM aggregates in the absence of a membrane looked like elongated fibrils. Next, the conditions with lipid to protein ratios of 50:1 and 100:1 (where the membrane was present) were convenient examples, which showed that the membrane binding regime and aggregation regimes modulated each other depending on the lipid to protein ratio. At a lipid to protein ratio of 100:1 with DMPC vesicles (ELC condition), where there was an excess amount of lipids, the AFM image showed the existence of a crowd of lipid vesicles associated with tiny fragmented fibrils. However, at a lipid to protein ratio of 50:1 for DMPC vesicles (OLC condition), AFM analysis unveiled that a stretch consisting of oligomers was formed initially, which got elongated on the surface of the DMPC vesicles exhibiting curvy and branched fibrillar structures, which were found to protrude around the lipid vesicles. We performed ITC experiments and found that the binding isotherm showed greater binding affinity for protein–protein interactions in comparison to Sup35NM–membrane interactions (Fig. S3, ESI†). Moreover, lipid molecules (under OLC conditions) might provide the increased local concentration of protein molecules, which in turn facilitated the short chain fibril formation of Sup35NM. Hence, we believe that, at the initial stage of aggregation, protein–protein interactions predominate over protein–membrane interactions producing oligomeric ensembles of protein molecules. With time, these short chain fibrils interacted with the membrane and formed higher order fibrils. As discussed before, FCS analysis at different time points of Sup35NM aggregation in the presence of DMPC vesicles (at a lipid to protein ratio of 50:1) shows the existence of various Sup35NM populations (Fig. 5H). At around 0 hour, a high amount of monomeric population (amplitude of the fast component) of Sup35NM was present. With time, the monomeric protein gave rise to protein–protein aggregates (amplitude of the second component). During the ∼100th hour, the monomeric population was minimized with a significant increase in the population of protein–protein aggregates. With a further increase of incubation time, these protein–protein aggregates started binding to the membrane surface resulting in the formation of membrane-associated protein aggregates (amplitudes of the third component). Thus, at the final point of aggregation, the population of membrane-associated protein aggregates was dominantly higher than the population of protein–protein aggregates.
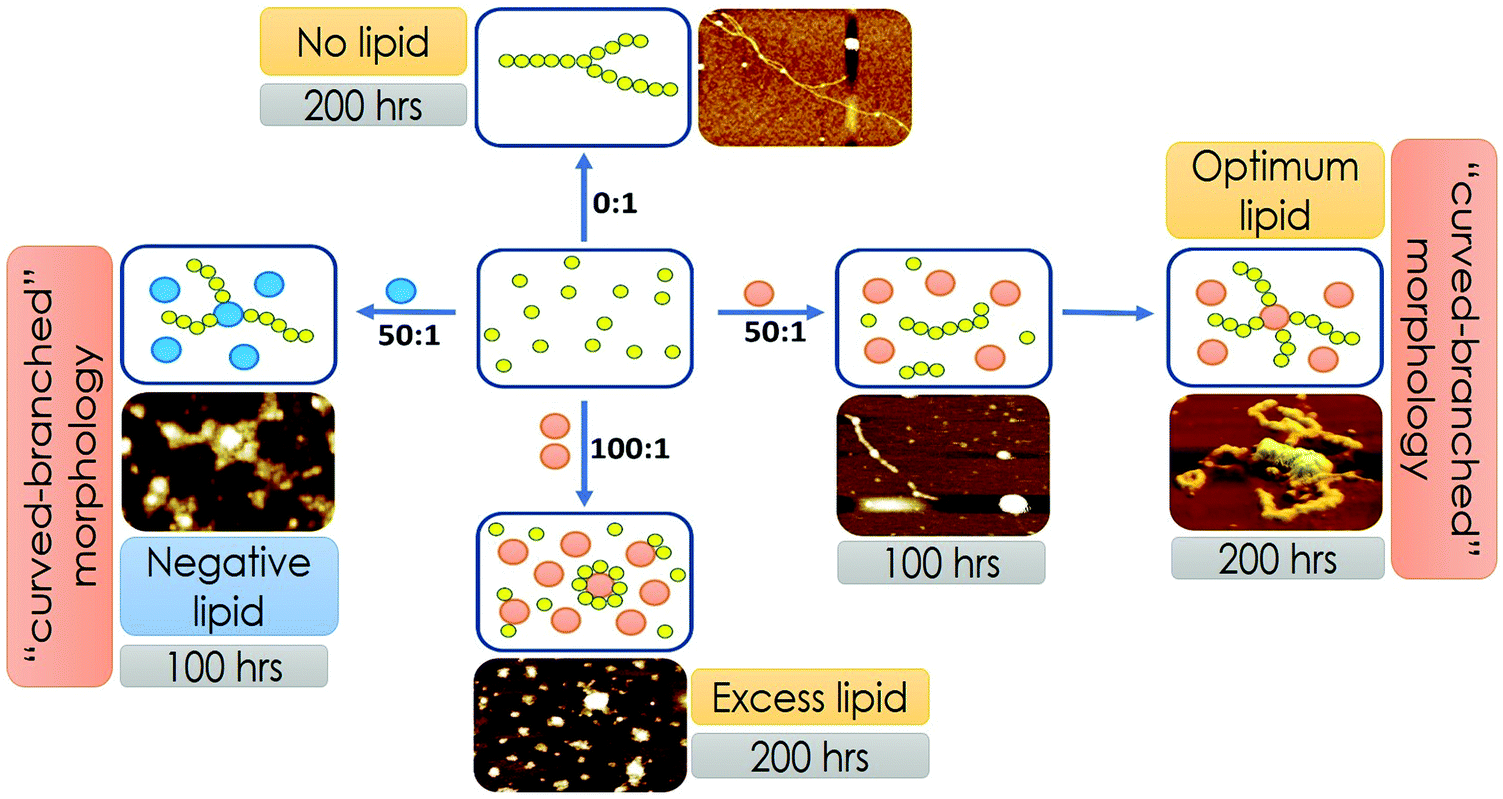 | ||
| Fig. 7 Scheme of Sup35NM aggregation in the presence of various concentrations and compositions of lipid vesicles. The membrane binding regime and the aggregation regimes modulated each other depending on the lipid composition and lipid to protein ratio. Yellow circles represent Sup35NM protein molecules. Orange balls represent DMPC lipid vesicles. Blue balls represent lipid vesicles made of a mixture of DMPC and DMPS in the ratio of 50:1. | ||
To obtain a mechanistic insight into this phenomenon, DMPC vesicles with an L/P ratio of 100:1 (ELC condition) was added to the pre-aggregated Sup35NM and incubated for further aggregation, which showed a biphasic aggregation profile with ThT-fluorescence assay (Fig. S6A, ESI†). This result further confirmed that the already preformed Sup35NM aggregates were further elongated on the surface of the vesicles. CD experiments of the pre-aggregated Sup35NM samples were found to exhibit predominantly beta-sheet conformation as confirmed by the existence of a major component at 216 nm (Fig. S6B, ESI†). Addition of DMPC vesicles at the L/P ratio of 100:1, significantly altered the secondary conformation from beta sheet to alpha helix. As discussed earlier in the case of alpha synuclein,46 this change in conformation may happen due to dissociation of some Sup35NM protein molecules from the fibrils to populate the lipid-bound monomeric α-helical state.
Nevertheless, Sup35NM aggregation was also significantly modulated by the lipid composition of the membrane. We found that the increase in the negatively charged component (DMPS) significantly increased the aggregation propensity of the protein. It is interesting to note that the biphasic behaviour (observed with zwitterionic lipids) disappeared when the negatively charged lipid composition was introduced even at an L/P ratio of 50:1. This happened because the presence of anionic lipid component appreciably increased the binding affinity of Sup35NM towards the phospholipid membrane.
We have shown that a good correlation exists between membrane binding affinity, the ability of the aggregates towards pore formation and their extent of cytotoxicity in mammalian cells. The extent of membrane deformation and pore formation correlated well with the reduction in cell viability in mammalian cells.
Conclusions
Although the fate of proteins with amyloidogenic properties depends critically on their immediate biochemical environment, the role of biological interfaces such as membrane surfaces, as promoters of pathological aggregation of amyloidogenic protein Sup35, is rarely studied. Here, we investigated in detail the stimulation of the aggregation kinetics of yeast prion protein Sup35 in the presence of membranes with varying membrane compositions. Using single molecule FCS and other biophysical methods, we showed for the first time that the prion conversion-prone NM region of Sup35 exhibited single phase aggregation kinetics at LLC when the lipid component was zwitterionic in nature. In contrast, Sup35 exhibited novel biphasic aggregation kinetics at a lipid/protein ratio ranging between 20:1 and 70:1 (at OLC) whereas, the ratio above OLC (ELC) and negatively charged membrane reverted back the amyloid kinetics to monophasic. This variation in kinetics appeared due to the slight change in membrane binding affinity and protein/lipid stoichiometry. We have shown that a good correlation exists among different parameters i.e. membrane binding affinity, protein aggregation, the ability of the aggregates towards pore formation and their extent of cytotoxicity in mammalian cells. The extent of membrane deformation and pore formation correlated well with the reduction in cell viability. Aggregates formed in the presence of a membrane were significantly more toxic in nature than those formed in the absence of a membrane. So, our results have provided a mechanistic description of membrane concentration/composition-modulated aggregation of Sup35NM and shed some light on aggregation-moderated membrane deformation, which is associated with neuronal diseases.
Materials and methods
Chemicals
DMPC (1,2-dimyristoyl-sn-glycero-3-phosphocholine) and DMPS (1,2-dimyristoyl-sn-glycero-3-phospho-L-serine) were purchased from Avanti Polar Lipids Inc. (Alabaster, Alabama, USA). The amine-reactive compound, Invitrogen Rhodamine Green Carboxylic Acid, Succinimidyl Ester, Hydrochloride (5(6)-CR 110, SE), mixed isomers, Catalogue number: R6107 was obtained from Invitrogen (Eugene, USA) and acrylamide, from Sigma-Aldrich (St. Louis, USA). All other necessary chemicals were obtained from Aldrich (St. Louis, USA) and Merck (Mumbai, India).Purification of Sup35NM protein
Purification of Sup35NM was performed by following the protocol of Glover et al.20 Recombinant Sup35NM was over-expressed in E. coli (BL21 DE3 strain). The plasmid used for Sup35NM overproduction in E. coli is pJCSUP35NM (1–253) (Addgene Plasmid number #1089). The over-expression of Sup35NM was induced using 1 M IPTG. After induction, the cells were allowed to grow for 3.5 hours. The cells were pelleted down by centrifuging at 6000 rpm for 15 minutes at 4 degrees, which was followed by resuspension in a pre-chilled lysis buffer (20 mM Tris–HCl + 500 mM NaCl, pH 8.0). The purification of Sup35NM protein was done in the presence of 8 M urea. After thorough resuspension in lysis buffer the cells were subjected to sonication (20 pulses, each for 30 seconds pulse time and an interim time frame of 1 minute). Unbroken cells and debris were removed by another act of centrifugation at 10000 rpm for 10 minutes. The soluble fraction obtained thereafter was carefully removed and allowed to bind to Ni–NTA agarose resin. The Ni–NTA column was washed with 40 ml of wash buffer (20 mM Tris–HCl, 500 mM NaCl and 50 mM imidazole, pH 8.0) followed by elution with 20 mM Tris HCl, 500 mM NaCl and 500 mM imidazole, pH 8.0. The eluted fractions were pulled according to their tentative protein contents as per their absorbance at 280 nm. The post-elution fractions were subjected to dialysis in a 20 mM Na–phosphate buffer pH 7.5. In all our protein concentration measurements, UV-VIS was deployed and Sup35NM concentration was determined by considering the monomeric molar extinction coefficient of 29000M−1cm−1 at 280nm. The identity of the protein was confirmed by SDS PAGE.
Preparation of lipid vesicles
An appropriate amount of lipid in chloroform (concentration of stock solution is 25 mg mL−1) was transferred to a 10 mL glass bottle.35 The organic solvent was removed by gently passing dry nitrogen gas. The sample was then placed in a desiccator, which was connected to a vacuum pump for a couple of hours to remove traces of leftover solvent. The required volume of phosphate buffer saline (PBS) at pH 7.4 was added to the dried lipid film so that the final desired concentration (10 mM) was obtained.47 The lipid film with the buffer was kept overnight at 4 °C to ensure efficient hydration of the phospholipid heads. Vortexing of the hydrated lipid film for about 30 min produced multilamellar vesicles (MLVs). Long vortexing was occasionally required to make uniform lipid mixtures. Small unilamellar vesicles (SUVs) were prepared by extruding the MLV with LiposoFast using an AVESTIN extruder (Ottawa, Canada). The MLV suspensions were extruded through polycarbonate membranes having pore diameters of 80 and 120 nm. This resulted in the formation of LUVs (average diameter ∼200 nm) with well-defined sizes, as measured by dynamic light scattering (DLS). Extrusion was carried out 20 times for the preparation of LUVs. Then sonication was done to these LUVs to obtain SUVs, which had an average dimeter of 90 nm. The vesicle solutions were degassed prior to all measurements, as air bubbles introduced into the sample during extrusion may lead to artifacts.FTIR measurements
FTIR spectra of Sup35NM were acquired using a Bruker 600 series FTIR spectrometer. The FTIR spectral readouts were collected at pH 7.5 immediately after dispensing the proteins in the buffer solution. The concentration of Sup35 protein was 20 μM and the concentration of lipids was 5 μM for FTIR studies. The buffer baseline was subtracted before obtaining each spectrum. The deconvolution of raw spectra in the amide I region (1700 cm−1 to 1600 cm−1) was done using least-squares iterative curve fitting to Gaussian/Lorentzian line shapes. The assignment of peaks was done using previously described spectral components associated with different secondary structures. To investigate the morphological changes of bilayer due to interaction of protein variants and preformed aggregates, FTIR spectroscopy was utilized by using a typical lipid concentration of 2 mM.47 All possible background corrections were done for each and every experiment.AFM studies
Aliquots of aggregated samples were withdrawn after prolonged incubation of ∼200 h at 37 °C and were diluted with 10 mM phosphate buffer, pH 7.4. A 5–8 μl aliquot was taken from the diluted sample and deposited on freshly cleaved mica for 10 min. After removing the excess liquid, the aggregates were rinsed with MilliQ water and then dried with a stream of nitrogen. Images were acquired at room temperature using a Bioscope Catalyst AFM (Bruker Corporation, Billerica, MA) with silicon probes. The standard tapping mode was used to image the morphology of the aggregates.47 The nominal spring constant of the cantilever was kept at 20–80 N m−1. The spring constant was calibrated by a thermal tuning method. A standard scan rate of 0.5 Hz with 512 samples per line was used for the imaging of the samples. A single third order flattening of height images with a low pass filter was done followed by section analysis to determine the dimensions of aggregates.ThT fluorescence assay
The protein Sup35NM was subjected to mechanical agitation at 200 rpm at 37 °C for ∼200 hours.47 The protein concentration for the aggregate preparation was kept at 30 μM in 20 mM sodium phosphate buffer at pH 7.5. We have used 30 μM of the protein for all ThT kinetics. For the measurement of membrane-induced protein aggregation, Sup35NM was incubated at various protein to lipid ratios from 1:0 to 1:100. Aliquots were thereafter subjected to ThT addition and fluorescence measurements were taken using an integration time of 0.3 s. The steady state fluorescence was monitored using an excitation wavelength of 450 nm, and the values of emission intensity at 485 nm were recorded.
Circular dichroism
Far-UV CD spectra of Sup35NM were recorded using a JASCO J720 spectropolarimeter (Japan Spectroscopic Ltd). Far-UV CD measurements (between 200 and 250 nm) were performed using a cuvette of 1 mm path length. A protein concentration of 10 μM was used for CD measurements.47 The scan speed was 50 nm min−1, with a response time of 2 s. The bandwidth was set at 1 nm. Three CD spectra were recorded in the continuous mode and averaged.Assay for permeabilization of lipid vesicles
The ability of protein aggregates to cause release of calcein from entrapped DMPC vesicles was checked by monitoring the increase in fluorescence intensity of calcein. Calcein-loaded liposomes were separated from non-encapsulated (free) calcein by gel filtration using a Sephadex G-75 column (Sigma). We used an elution buffer of 10 mM MOPS, 150 mM NaCl and 5 mM EDTA (pH 7.4), and lipid concentrations were estimated by complexation with ammonium ferro thiocyanate. Fluorescence was measured at room temperature (25 °C) using a PTI spectrofluorometer using a cuvette of 1 cm path length. The excitation wavelength was 490 nm and emission was set at 520 nm. Excitation and emission slits with nominal bandpasses of 3 and 5 nm were used, respectively. The high concentration (10 mM) of the entrapped calcein led to self-quenching of its fluorescence resulting in low fluorescence intensity of the vesicles (IB). Release of calcein caused by addition of protein aggregates (formed at 200 hours) led to the dilution of the dye into the medium, which could therefore be monitored by an enhancement of fluorescence intensity (IF). This enhancement of fluorescence is a measure of the extent of vesicle permeabilization. The experiments were normalized relative to the total fluorescence intensity (IT) corresponding to the total release of calcein after complete disruption of all the vesicles by addition of Triton X-100 (2% v/v). The percentage of calcein release in the presence of melittin was calculated using the equation: | (1) |
Cell culture and cytotoxicity assays
SHSY5Y cells were cultured in DMEM accompanied with 10% foetal bovine serum (FBS) and 1% antibiotic (PSN) under 5% CO2 in a humidified atmosphere at 37 °C.30,49 After 75–80% confluence, cells were harvested with 0.52 mM EDTA and 0.25% trypsin in phosphate buffered saline (PBS) and plated at the required density to allow them to re-equilibrate for a day before starting the experiment. MTT assay was used to evaluate the cell cytotoxicity. For the initial screening experiment, the SHSY5Y cells (4 × 10³ cells per well) were seeded in a 96-well plate and left in an incubator followed by treatment with different concentrations of protein aggregates (5, 10 and 15 μM) for 12 h. After 12 h of incubation, cells were washed with PBS, and then the MTT solution was added to each well and kept in an incubator for 4 h to form formazan salt. Then the formazan salt was solubilized using DMSO and the absorbance was observed at 595 nm using an ELISA reader (Emax, Molecular device, USA).OPM (orientation of proteins in membranes)
To obtain an insight into how the Sup35NM protein interacts with the membrane, we resorted to computational approaches. Protein orientations in membranes were theoretically calculated by minimizing a protein's transfer energy from water to a planar slab that serves as a crude approximation of the membrane hydrocarbon core. The membrane binding propensity was calculated using the OPM server (https://opm.phar.umich.edu/server.php). A protein was considered as a rigid body that freely floats in the planar hydrocarbon core of a lipid bilayer. Accessible surface area is calculated using the subroutine SOLVA from NACCESS with radii of Chothia and without hydrogen. In OPM, solvation parameters are derived specifically for lipid bilayers and normalized by the effective concentration of water, which changes gradually along the bilayer normal in a relatively narrow region between the lipid head group regions and the hydrocarbon core.ITC (isothermal titration calorimetry)
The heat flow obtained from the binding of Sup35NM with phospholipid vesicles was measured using high-sensitivity ITC (MicroCaliTC 200, UK). All experiments were performed at 30 °C. Solutions were degassed under vacuum prior to filling the sample and reference cells. Protein solution (10 μM) and DMPC SUVs (2 mM) were loaded in a calorimetric cell of volume 350 μL and a syringe of volume 40 μL, respectively. In an experiment, a series of 20 injections, 2 μL each, with the syringe was performed into the ITC cell containing Sup35NM at 240 s intervals. Each injection produced a characteristic heat signal, arising from the released or absorbed heat from the lipid–protein interaction, leading to exothermic and endothermic signals. The heat of dilution was determined by injecting the buffer into the ITC cell containing Sup35NM. An ITC thermogram was obtained from the integration of a heat signal and subtracting the heat of dilution arising from each injection. The ITC thermogram was then fitted to a model (one-site binding) provided by Microcal Origin to determine the binding constant (K) and molar enthalpy of interaction (ΔH). The Gibbs free energy, G, was obtained from the relation ΔG = −RTln(55.5 K) and hence the entropic contribution can be estimated as follows: ΔG = ΔH − TΔS. Here, the concentration of water of 55.5 M was used to correct the unit of K to molar fraction.
Labelling of SUP35NM
10 mg of the protein was dissolved in 1 mL of 0.1 M sodium bicarbonate buffer. The protein concentration in the reaction was 10 mg mL−1. The amine-reactive compound, Invitrogen Rhodamine Green Carboxylic Acid, Succinimidyl Ester, Hydrochloride (5(6)-CR 110, SE), mixed isomers, Catalogue number: R6107 (Rhodamine dye), was dissolved in DMSO at 10 mg mL−1. Vortexing and sonication were done. Incubation of the reaction was done for 1 hour at room temperature with continuous stirring. Equilibration was done using a 10 × 300 mm column with PBS or the buffer of choice. Measurement of the absorbance of the protein–dye conjugate at 280 nm (A280) was taken and at the λmax for the dye.Fluorescence correlation spectroscopy
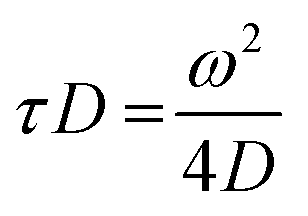
FCS experiments were carried out using a dual channel ISS Alba V system (ISS, IL) equipped with a 60× water-immersion objective (NA 1.2). Samples were excited with an argon laser at 488 nm. All protein data were normalized using the τD value obtained with the free dye (Alexa488), which was measured under identical conditions. For a single-component system, diffusion time (τD) of a fluorophore and the average number of particles (N) in the observation volume can be calculated by fitting the correlation function [G(τ)] to eqn (2):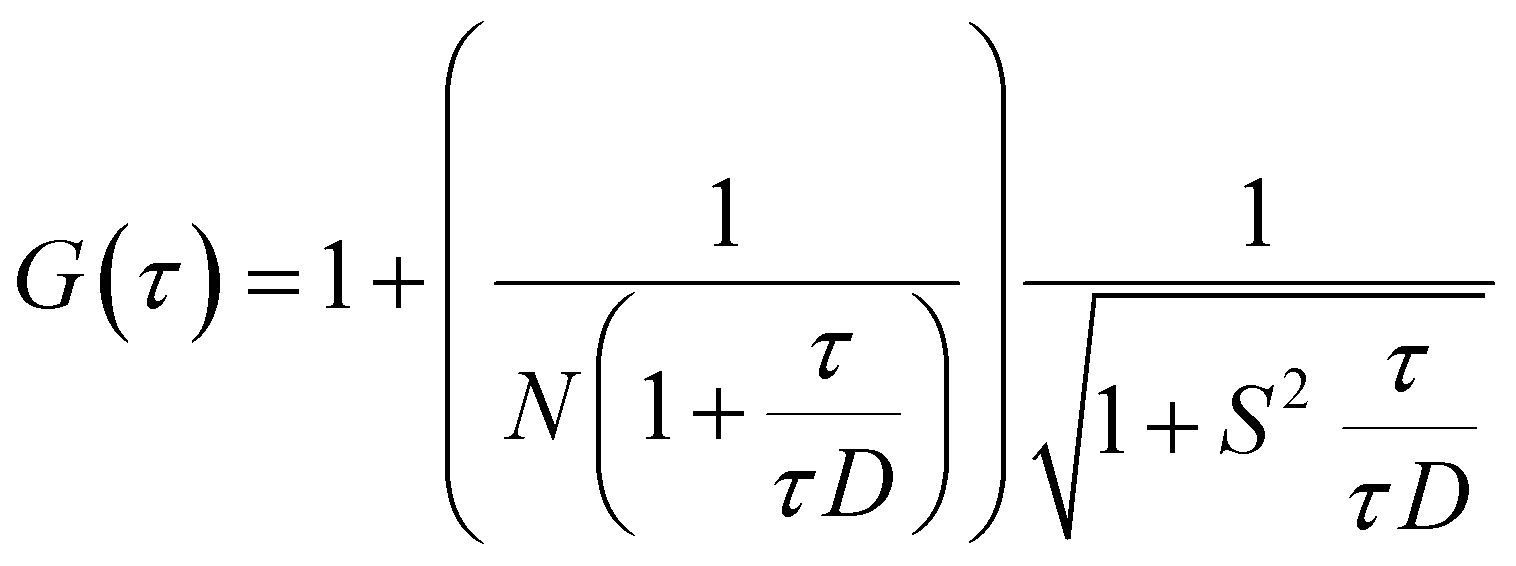 | (2) |
 | (3) |
 | (4) |
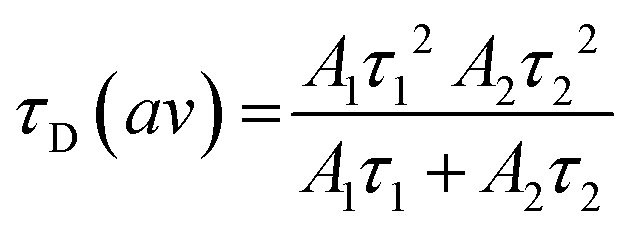
Calculation of the average diffusion time was carried out using eqn (5), where A1 and τ1 are the amplitudes and diffusion times of the fast component and A2 and τ2 are the amplitudes and diffusion times of the slow component, respectively.
 | (5) |
We have followed the procedure of Middleton et al. for the calculation of the percentages of the bound/free Sup35.51
Author contribution
Conceptualization: KC; Supervision: AS; Formal analysis and investigation: AB; Methodology: AS and AB; Manuscript writing: KC, AS and AB.Conflicts of interest
There are no conflicts to declare.Acknowledgements
This work received funding from CSIR (MIND), Govt. of India. AS and AB are grateful to UGC for providing their research fellowships. The authors thank the Central Instrument Facility of CSIR-IICB for providing the instruments and facilities. AB thanks Mr T. Muruganandan, technical officer in charge of the AFM instrument for helping out with the AFM images. AB thanks Trishika, Basudha, and Sanchari (project-trainees) for their help and support. KC thanks the director, CSIR-IICB for his help and encouragement.References
- S. B. Prusiner, Science, 1991, 252, 1515–1522 CrossRef CAS.
- J. Collinge, Lancet, 1999, 354, 317–323 CrossRef CAS.
- S. Jain and J. B. Udgaonkar, Curr. Sci., 2011, 101, 1311–1327 Search PubMed.
- P. W. Lampert, D. C. Gajdusek and C. Gibbs Jr, Am. J. Pathol., 1972, 68, 626 CAS.
- K. E. Nazor, T. Seward and G. C. Telling, Biochim. Biophys. Acta, Mol. Basis Dis., 2007, 1772, 645–653 CrossRef CAS.
- J. W. Ironside, Prion diseases, Springer, 1996, pp. 35–57 Search PubMed.
- J. Singh and J. B. Udgaonkar, Angew. Chem., 2015, 127, 7639–7643 CrossRef.
- G. Jackson, L. Hosszu, A. Power, A. Hill, J. Kenney, H. Saibil, C. Craven, J. Waltho, A. Clarke and J. Collinge, Science, 1999, 283, 1935–1937 CrossRef CAS.
- C. Soto and J. Castilla, Nat. Med., 2004, 10, S63–S67 CrossRef.
- B. L. Kagan and J. Thundimadathil, Proteins Membrane Binding and Pore Formation, Springer, 2010, pp. 150–167 Search PubMed.
- R. Moulick and J. B. Udgaonkar, Biophys. J., 2014, 106, 410–420 CrossRef CAS.
- K. Kaneko, D. Peretz, K.-M. Pan, T. C. Blochberger, H. Wille, R. Gabizon, O. H. Griffith, F. E. Cohen, M. A. Baldwin and S. B. Prusiner, Proc. Natl. Acad. Sci. U. S. A., 1995, 92, 11160–11164 CrossRef CAS.
- R. Moulick and J. B. Udgaonkar, J. Mol. Biol., 2017, 429, 886–899 CrossRef CAS.
- F. Wang, F. Yang, Y. Hu, X. Wang, X. Wang, C. Jin and J. Ma, Biochemistry, 2007, 46, 7045–7053 CrossRef CAS.
- S. L. Masters and L. A. O’Neill, Trends Mol. Med., 2011, 17, 276–282 CrossRef CAS.
- J. W. Kelly, Curr. Opin. Struct. Biol., 1998, 8, 101–106 CrossRef CAS.
- C.-Y. King and R. Diaz-Avalos, Nature, 2004, 428, 319 CrossRef CAS.
- A. A. Nizhnikov, T. A. Ryzhova, K. V. Volkov, S. P. Zadorsky, J. V. Sopova, S. G. Inge-Vechtomov and A. P. Galkin, PLoS Genet., 2016, 12, e1006504 CrossRef.
- G. C. Telling, M. Scott, J. Mastrianni, R. Gabizon, M. Torchia, F. E. Cohen, S. J. DeArmond and S. B. Prusiner, Cell, 1995, 83, 79–90 CrossRef CAS.
- J. R. Glover, A. S. Kowal, E. C. Schirmer, M. M. Patino, J.-J. Liu and S. Lindquist, Cell, 1997, 89, 811–819 CrossRef CAS.
- S. B. Prusiner, Annu. Rev. Microbiol., 1994, 48, 655–687 CrossRef CAS.
- A. L. Horwich and J. S. Weissman, Cell, 1997, 89, 499–510 CrossRef CAS.
- N. Sanghera and T. J. Pinheiro, J. Mol. Biol., 2002, 315, 1241–1256 CrossRef CAS.
- S. A. Thody, M. Mathew and J. B. Udgaonkar, Biochim. Biophys. Acta, Rev. Biomembr., 2018, 1860, 1927–1935 CrossRef.
- F. Wang, S. Yin, X. Wang, L. Zha, M.-S. Sy and J. Ma, Biochemistry, 2010, 49, 8169–8176 CrossRef CAS.
- B. Puig, H. Altmeppen and M. Glatzel, Prion, 2014, 8, 11–18 CrossRef CAS.
- B. R. Whatley, L. Li and L.-S. Chin, Biochim. Biophys. Acta, Mol. Basis Dis., 2008, 1782, 700–712 CrossRef CAS.
- E. E. Ganusova, L. N. Ozolins, S. Bhagat, G. P. Newnam, R. D. Wegrzyn, M. Y. Sherman and Y. O. Chernoff, Mol. Cell. Biol., 2006, 26, 617–629 CrossRef CAS.
- T. A. Chernova, Z. Yang, T. S. Karpova, J. R. Shanks, N. Shcherbik, K. D. Wilkinson and Y. O. Chernoff, Int. J. Mol. Sci., 2020, 21, 5038 CrossRef CAS.
- J. O. Speare, D. K. Offerdahl, A. Hasenkrug, A. B. Carmody and G. S. Baron, EMBO J., 2010, 29, 782–794 CrossRef CAS.
- C. Krammer, H. M. Schätzl and I. Vorberg, Prion, 2009, 3, 206–212 CrossRef CAS.
- C. Krammer, D. Kryndushkin, M. H. Suhre, E. Kremmer, A. Hofmann, A. Pfeifer, T. Scheibel, R. B. Wickner, H. M. Schätzl and I. Vorberg, Proc. Natl. Acad. Sci. U. S. A., 2009, 106, 462–467 CrossRef CAS.
- Y. Duernberger, S. Liu, K. Riemschoss, L. Paulsen, R. Bester, P.-H. Kuhn, M. Schölling, S. F. Lichtenthaler and I. Vorberg, Mol. Cell. Biol., 2018, 38, 15 CrossRef.
- D.-S. Lee, K. Anzai, N. Hirashima and Y. Kirino, J. Biochem., 1998, 124, 798–803 CrossRef CAS.
- D. Needham and E. Evans, Biochemistry, 1988, 27, 8261–8269 CrossRef CAS.
- J. McLaughlin, M. G. Lucà, M. N. Jones, M. D'Amato, G. J. Dockray and D. G. Thompson, Gastroenterology, 1999, 116, 46–53 CrossRef CAS.
- M. D. Ter-Avanesyan, A. R. Dagkesamanskaya, V. V. Kushnirov and V. N. Smirnov, Genetics, 1994, 137, 671–676 CrossRef CAS.
- S. Paushkin, V. Kushnirov, V. Smirnov and M. Ter-Avanesyan, EMBO J., 1996, 15, 3127–3134 CrossRef CAS.
- M. M. Patino, J.-J. Liu, J. R. Glover and S. Lindquist, Science, 1996, 273, 622–626 CrossRef CAS.
- R. Kodali and R. Wetzel, Curr. Opin. Struct. Biol., 2007, 17, 48–57 CrossRef CAS.
- R. Krishnan and S. L. Lindquist, Nature, 2005, 435, 765–772 CrossRef CAS.
- A. Ortega, D. Amorós and J. G. De La Torre, Biophys. J., 2011, 101, 892–898 CrossRef CAS.
- J. Kazlauskaite, N. Sanghera, I. Sylvester, C. Vénien-Bryan and T. J. Pinheiro, Biochemistry, 2003, 42, 3295–3304 CrossRef CAS.
- C. Xue, T. Y. Lin, D. Chang and Z. Guo, R. Soc. Open Sci., 2017, 4, 160696 CrossRef.
- Z. Jiang, J. D. Flynn, W. E. Teague Jr, K. Gawrisch and J. C. Lee, Biochim. Biophys. Acta, Biomembr., 2018, 1860, 1840–1847 CrossRef CAS.
- C. Galvagnion, A. K. Buell, G. Meisl, T. C. Michaels, M. Vendruscolo, T. P. Knowles and C. M. Dobson, Nat. Chem. Biol., 2015, 11, 229–234 CrossRef CAS.
- A. Sannigrahi, P. Maity, S. Karmakar and K. Chattopadhyay, J. Phys. Chem. B, 2017, 121, 1824–1834 CrossRef CAS.
- A. Halder, A. Sannigrahi, N. De, K. Chattopadhyay and S. Karmakar, Langmuir, 2020, 36, 3522–3530 CrossRef CAS.
- R. Chakraborty, S. Sahoo, N. Halder, H. Rath and K. Chattopadhyay, ACS Chem. Neurosci., 2018, 10, 573–587 CrossRef.
- K. Chattopadhyay, E. L. Elson and C. Frieden, Proc. Natl. Acad. Sci. U. S. A., 2005, 102, 2385–2389 CrossRef CAS.
- E. R. Middleton and E. Rhoades, Biophys. J., 2010, 99, 2279–2288 CrossRef CAS.
Footnote |
| † Electronic supplementary information (ESI) available: Validation of the model structure of Sup35NM, aggregate-induced differential toxicity of Sup35NM in the absence and presence of DMPC vesicles, ITC experiments, ThT fluorescence showing binding of ThT to lipid vesicles, average diffusion time of aggregates superimposed with ThT fluorescence intensity, mechanistic insight on Sup35NM aggregation, OPM server results table and secondary derivative of the absorbance data of the FTIR spectra. See DOI: 10.1039/d0cb00203h |
| This journal is © The Royal Society of Chemistry 2021 |