Field-flow fractionation and inductively coupled plasma mass spectrometer coupling: History, development and applications
S.
Dubascoux
a,
I.
Le Hécho
*a,
M.
Hassellöv
b,
F.
Von Der Kammer
c,
M.
Potin Gautier
a and
G.
Lespes
a
aLCABIE CNRS UMR 5254 IPREM, Helioparc, av du Président P. Angot, 64053, Pau, France. E-mail: isabelle.lehecho@univ-pau.fr; Tel: +46 33540175017
bDepartment of Chemistry, University of Gothenburg, SE-412 96, Göteborg, Sweden
cCenter of Earth Sciences, Nanogeosciences, Vienna University, Althanstrasse 14, A-1090, Wien, Austria
First published on 31st March 2010
Abstract
Field-Flow Fractionation (FFF) is now recognised as a versatile pool of techniques allowing particle size or molar mass to be obtained in a wide variety of samples covering numerous applications in the fields of environment, materials or biology. In the same time, Inductively Coupled Plasma-Mass Spectrometry (ICP-MS) has an indisputable place in the field of elemental detectors and the coupling between FFF and ICP-MS can be considered as an emerging technique capable to reach relevant physico-chemical information at sub-micrometre scale and trace element concentration level. This paper gives some key elements of FFF-based fractionation linking theory and practical analytical aspects, from injection and preconcentration to analysis. The different components of the coupling are described. Summary tables of the main operating conditions of FFF-ICP-MS coupling are presented and operating conditions such as carrier composition, flow and nebulizers are discussed. Special attention is given to the FFF-ICP-MS interface. Qualitative and quantitative analysis is also discussed. Applications in the fields of environment, bioanalysis and nanoparticles are presented in order to illustrate the potentialities of such coupling.
 S. Dubascoux | Stéphane Dubascoux obtained his PhD (Analytical Chemistry and Environment) in 2007 at the LCABIE on the development of a fractionation method (FFF) associated to multi-detection for natural colloid characterization. Since October 2007, he has been a teaching assistant at the University of Pau. His main topics are the study and fractionation of colloids (natural and anthropogenic) by As-Fl-FFF, colloid–metal relationships, analytical development and speciation of metals and metalloids in environmental matrices. |
 I. Le Hécho | Isabelle Le Hécho is titular of a PhD in Water Chemistry and Microbiology obtained in 1995 at the University of Pau, France. She worked as a research scientist in a post-doctoral position at the French geological survey (BRGM) from 1996 to 1999. Since 1999, she occupies a position of Assistant Professor at the University of Pau and has joined the research team of the LCABIE. Its research tasks concern the physicochemistry and the reactional mechanisms at environmental interfaces (soil-plant systems) and the colloid reactivity and their role in the transfer of metals, metalloids. |
Introduction
Field Flow Fractionation (FFF) is a versatile hydrodynamic fractionation technique used to separate macromolecules, colloids, nano- and microparticles according to their size or mass. This technique was introduced by Giddings from Utah University forty years ago. Until now, FFF has not gained its rightful place among the range of analytical tools. Nevertheless, FFF is the only technique offering an analytical continuous size fractionation range from 1 nm up to several micrometres with high resolution. FFF has been successfully used in numerous applications to fractionate a large number of materials.1 It can be forecast that FFF will find many new applications for separating and characterizing various nanoparticles, with the emergence of nanotechnology. However the applications of this technique still remain confidential.In colloid or particle analysis the use of FFF coupled with several detectors allows complementary data and finally relevant physico-chemical information to be obtained. Generally, multidetection involves UV, light scattering, differential refractometer or fluorescence.
In the same time, from the beginning of the 1980s and until now, Inductively Coupled Plasma-Mass Spectrometry (ICP-MS) has acquired an indisputable main place in the range of elemental detectors because of its sensitivity, speed and multi-element capability.
The range of samples that could be fractionated by FFF combined to the high potential of ICP-MS considerably improves the application field of FFF and opens new ways of investigations for colloidal material analyses.
This review presents the current knowledge about FFF-ICP-MS hyphenation, its history, its state-of-the-art concerning qualitative and quantitative analysis, applications and further challenges with this technique.
History of the coupling
Historically, Beckett et al. were the first to propose FFF-ICP-MS coupling in 1990/1991 in order to extend the range of aquatic colloid adsorbates that can be studied using FFF coupling and determine chemical composition as a function of colloidal size.2,3In 1992, Chittleborough et al. and Taylor et al. were the first to use off-line ICP-MS after Sedimentation FFF (Sd-FFF) to define the chemistry and mineralogy of soil colloidal fractions and characterize river suspended matters.4,5 One year later, Murphy et al. were the first to couple on-line Sd-FFF and ICP-MS for quantitative analysis.6 They monitored Al, Fe, Mg, Rb, Si and Sr on clay mineral samples and river suspended particulate matter. Moreover, they plotted atomic ratios (Si/Al, Mg/Al for example) versus particle size to evaluate changes in particle composition. Internal standards (Rh, Pr and Bi) were used to control the signal drift and quantification was performed by standard injection.
The first coupling between Flow-FFF and ICP-MS was then proposed by Hasselöv et al. in 19997 and permitted to monitor 28 elements (including carbon) in natural colloids from freshwater samples. Moreover they modified the FFF injection system for large volume analyses (up to 50 mL). Thus, the sample could be on-line pre-concentrated before fractionation, improving the limits of detection and quantification.
Since 2000, the number of papers focusing on the coupling on various applications has increased, enlarging the application field and potentiality of such device.
Until now, more than 90% of papers dealing with FFF coupled with ICP (with Optical Emission–OES–or Mass Spectrometry–MS–detection) referred to environmental applications on various matrices such as air particulates,8 compost leachates,9 sewage plant colloids,10 landfill leachates,11 river colloids,12,13 groundwater,14 and seawater15. Only a few papers enlarge the application field with industrial applications,16 food sciences17,18 and life sciences.19–21
Coupling development
Introduction to FFF
Field Flow Fractionation is a pool of techniques where colloids, macromolecules and particles are size-separated in a thin channel with laminar flow under the influence of a perpendicular field. The nature of this field (sedimentation, flow, electrical, thermal…) defines the type of FFF separation. Several types of FFF are developed and used for various applications: Flow FFF (Fl-FFF), Sedimentation FFF (Sd-FFF), Electrical (El-FFF) and Thermal (Th-FFF). However, until now only Fl-FFF and Sd-FFF have been proposed hyphenated to ICP-MS. In addition, FFF theory is now well known and a wide range of size separation using this fractionation technique has been carried out.1Briefly, concerning Sd-FFF, the field is a centrifugal force applied at right angles to the channel flow with the help of a centrifugal apparatus. For Fl-FFF, the field is a second flow stream of carrier liquid (named crossflow). Although the aim of this paper is not to explain the FFF theory, some elements of this theory are important to remember. In all FFF fractionation techniques, elution generally occurs in normal mode (from small to larger colloids). When colloid size becomes too important repulsion forces are predominant with regards to diffusion phenomenon so elution occurs in steric/hyperlayer mode (Fig. 1). The transition from normal to steric/hyperlayer mode is called steric transition. Operation conditions are generally optimized to avoid a mix of the two modes during analysis.
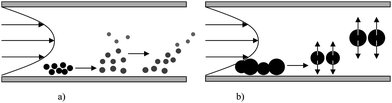 | ||
| Fig. 1 The different elution modes in FFF: a) normal mode, b) steric/hyperlayer mode. | ||
The retention parameter (λ) is one of the most important parameters related to elution. This parameter defines the distance between the accumulation wall of the channel and the mean cloud thickness of the analyte zone which depends on the sample/field interactions. The mathematical expression of this parameter allows the physical parameters playing a role in the fractionation process to be extracted. Equations below are established for normal mode.
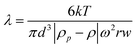
For Sd-FFF the retention parameter (λ) is defined as:
 | (Equation 1) |
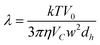
With k: Boltzman constant, T: absolute temperature, m: particle mass, ρp: particle density, ρ: solvent density, ω: angular rotation frequency, r: distance from rotor center and w: channel thickness also expressed as a function of equivalent spherical volume diameter (d):
 | (Equation 2) |
Concerning Fl-FFF, λ is obtained from:
 | (Equation 3) |
The retention parameter can be also related to the retention ratio ( , with t0 and tR the void and retention times respectively) by:
 | (Equation 4) |
This relation has several approximations, one of the most known being:
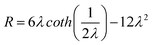
| R = 6λ − 12λ2 | (Equation 5) |
This can be also expressed as:
 | (Equation 6) |
From all these equations, and more especially those linking λ and R, it can be noticed that the retention time and the particle diameter (spherical volume diameter, d, or hydrodynamic particle, dh, according to the FFF technique used) are dependant. Thus, it can be obtained by assuming that R≪1:
For Sd-FFF:
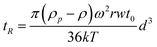 | (Equation 7) |
For Fl-FFF:
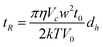 | (Equation 8) |
According to eqn (2), (3), (7) and (8), Sd-FFF separations are based on the equivalent spherical volume diameter (d) and density of the particle (ρ) whereas Fl-FFF ones take place according to the hydrodynamic particle diameter (dh).
One of the major advantages concerning Fl-FFF and Sd-FFF is the absence of a stationary phase as in chromatography, with virtually absence of interactions with the analytical system (in optimized operational conditions). However in Fl-FFF, the membrane could interact with analytes. Thus its choice must be carefully done in order to avoid any interactions leading to abnormal elution.
The main advantage of Sd-FFF compared to Fl-FFF is the higher size selectivity (since it separates according to particle volume, also expressed as a function of d3). The advantages of Fl-FFF compared to Sd-FFF are lower minimum size limit (1 nm compared to ∼30 nm) and the removal of the truly dissolved part of the sample during the separation through the membrane placed on the accumulation wall. In Fl-FFF more specifically, the fractionation can be performed in symmetrical or asymmetrical system (noted As-Fl-FFF). Historically, symmetric system was first proposed. It involves that the crossflow goes through the upper to the accumulation walls, crossing the channel perpendicularly to the elution flow. Later on, an asymmetrical system was developed. The differences with the symmetrical one rely on the use of a fractionation channel with only one permeable wall corresponding to the accumulation wall, the upper wall being in Plexiglas. In order to maintain a constant elution flow all along the channel, the channel is larger at its entrance than at its exit. The main advantages of As-Fl-FFF compared to symmetrical Fl-FFF are less dilution and shorter analysis duration. Moreover, the plexiglas upper wall allows the elution as well as the membrane to be visually controlled.1
Interest of FFF-ICP-MS coupling
The partial knowledge about colloids and nanomaterials leads to an important need for information about their structure, characterization and physico-chemical properties. To overcome this ignorance, authors used FFF on-line coupled with lots of different detectors (Ultra Violet – UV, Multi Angle Laser Light Scattering – MALLS, Fluorescence, Molecular Mass Spectrometer…) acquiring complementary and essential information about sample.In the field of size- based fractionation methods, on-line techniques are recognized to have the highest fractionation power compared to sequential ones. 9 The fractionation power can be evaluated by using the selectivity, defined as: 1
 | (Equation 9) |
Among on-line fractionation techniques, FFF ones have a selectivity generally higher than size exclusion chromatography (SEC).1 Typically, for Fl-FFF selectivity is in the range of 0.6–1 and can reach 3 for Sd-FFF, whereas it is equal to 0.1 in SEC. Moreover due to the lack of stationary phase in FFF channel analyte interaction with analytical system and analyte modification risks are minimized. Additionally, colloid size range that can be fractionated is larger in FFF than in SEC.
The hyphenation of FFF with a sensitive and multi-elemental detector as Inductively Coupled Plasma Mass Spectrometer (ICP-MS) can give relevant information about the distribution of elements throughout the sample size distribution, including both major composition of the colloids and associated trace elements. This is especially convenient for determining the different types of colloids present in samples of environmental, biological or manufacturing interest.16,19,22 Trace element complexation with colloids (e.g. complex structure or stoechiometry) can be also studied.9,14,21 In this way, isotopic monitoring is a powerful tool allowing kinetics of complexation between colloids and trace elements and more generally colloidal reactivity to be studied.12 FFF- ICP-MS coupling is also intrinsically able to provide any information on trace element distribution. Moreover it is possible to cross information from trace element distribution (obtained by FFF-ICP coupling) with those obtained from chemical speciation in order to obtain the distribution of the different chemical species of an element (speciation) on the different colloidal populations.11
Dilution/preconcentration
One of the major drawbacks mentioned during FFF analysis is the high dilution associated with the inherent principle of the fractionation (the sample is separated into fractions that each are eluting in a much larger volume than the sample fraction were originally dispersed in). Additionally, in environmental applications and mainly in natural waters, the colloidal concentration is generally low leading to difficult elemental detection for colloidal constituents such as trace elements. To overcome this analytical limitation, pre concentration procedures have been developed. In the way, external preconcentration setup as crossflow or frontal/tangential ultrafiltration of the sample before analysis is usually used. However, in Fl-FFF, one of the major advantages is the possibility to achieve an on-line preconcentration during the focusing step. Thus, in 1997, Lyven et al. optimized an on-channel preconcentration with injected volume up to 100 mL for natural waters.23 This preconcentration step was used in Fl-FFF-ICP-MS study by Hassellöv et al.7 and then repeated in other works.12,13,24–28Other methods have been developed to concentrate the sample before detection. Frit oulet Fl-FFF (FO-Fl-FFF) is one of these methods but to our knowledge, it has never been used in FFF-ICP-MS study. The principle is to remove some of the carrier that is overlying the sample cloud in the end of the fractionation channel. Removal of this excess liquid leads to less dilution than would otherwise occur if this would be mixed with the sample towards the detector. This technique therefore seems to improve sensitivity, reduce baseline noise while preserving satisfactory reproducibility, but there is a risk of losing finer components of the sample if more than a 1![[thin space (1/6-em)]](https://www.rsc.org/images/entities/char_2009.gif) :1 removal is used.29–31
:1 removal is used.29–31
In a similar way, Prestel et al. elaborated an enrichment way of the FFF outlet: the slot outlet technique.32 In this approach, the upper carrier stream is removed with the help of a slot in the upper block of an asymmetrical Fl-FFF channel and an additional pump. The slot outlet flow rate was adjusted to a value ranging from 0 to 80% of the initial carrier flow. They tested this technique with different samples (wastewater, liquid manure, serums, and artificial inorganic particles). The authors found an enrichment factor up to 14 depending on the sample and the conditions retained. They tested As-Fl-FFF ICP-MS with slot outlet for the fractionation of spherical Thulium phosphate (TmPO4) and obtained valuable fractograms with a slot outlet flow of 50% whereas no interpretable signal was obtained without slot outlet.
Analytical conditions
As mentioned in the historic part, the first FFF-ICP-MS coupling was performed with a sedimentation FFF. More generally during the 90s, all the coupling were carried out using Sd-FFF. The Table 1 summarizes the Sd-FFF-ICP-MS coupling reported in the literature. In the last decade, the major part of the papers deals with Fl-FFF ICP-MS coupling. The Table 2 condenses the Fl-FFF-ICP-MS coupling with retained analytical conditions.| FFF (commercial denomination) | Flow/mL min−1 | Initial centrifugal speed/rpm | Carrier | Injection | ICPMS | Nebulizer | Other online detectors | Internal standard | Monitored elements | Quantitative approach | Samples | Applications | Ref |
|---|---|---|---|---|---|---|---|---|---|---|---|---|---|
| Sd S101 FFFractionation (Postnova) | 2 | 1500/1000/150 | 1.3mM Na4P2O7, 10H2O | 10/20μL | Sciex Elan Model 250 (Perkin Elmer) | Babington | UV | Rh, Pr, Bi | Al, Mg, Fe, Sr, Rb, Si | ✗ | Clay Natural suspended particulate matter from river | Environmental | 6 |
| Sd S100 FFFractionation (Postnova) | 1 | 1000/800 | 5.10−4 M SPP 0.02% NaN3 | 10μL | VG plasmaquad (Thermo) | nd | UV | In, Co | 23.5 to 210.41 a.m.u (Al, Fe, Mg) | ✗ | Soil suspension River samples | Environmental | 33 |
| Sd S100 FFFractionation (Postnova) | 1 | 1500 | 0.05%SDS 0.02%NaN3 | 30μL | VG plasmaquad (Thermo) | nd | UV | In, Cs | 23.5 to 210.41 a.m.u (Fe) | ✗ | River samples | Environmental | 34 |
| Sd S101 FFFractionation (Postnova) | 1 | 1500 | 2.10−3M Na4P2O7 0.02% (w/v) NaN3 | nd | VG plasmaquad (Thermo) | nd | UV | nd | Fe, Al, Mg | River particles Kaolin sample | Environmental | 35 | |
| Sd S101 FFFractionation (Postnova) | 1 | 1500 | 0.1mM SPP | 20μL | ICP HRMS – Element (Thermo) | Meinhard | UV | nd | Al, Si, Fe, Mn, Cs, La, Cu, Zn, Cd, Pb | Clay sediment | Environmental | 36 | |
| Sd S101 FFFractionation (Postnova) | 1 | 800 | 1mM SPP 0.02% NaN3 | nd | VG plasmaquad (Thermo) | Pneumatic | UV | In 100 μg L−1 | 23 to 208 a.m.u. Al, Si, Fe, Ba, Sr, Ti, Mg, Rb, Ce, Nd | ✗ | Soil colloids | Environmental | 37 |
| Sd S100 FFFractionation (Postnova) | 1 | 1500 | 0.0005%SDS 0.0002%NaN3 | 90μL | ICP HRMS – Element (Thermo) | nd | UV | Co, Cs | Mg, Al, Si, P, Mn, Co, Cs | ✗ | River sediments Soil samples | Environmental | 38 |
| Sd S101 FFFractionation (Postnova) | 1 | 800/700 | 0.0005%SDS 0.0002%NaN3 | 50μL | ICP HRMS – Element (Thermo) | V-groove | UV | Co 100μg L−1 | Al, Fe, Co, Cu | ✗ | Soil Sediment Goethite oxide kaolin | Environmental | 39 |
| Sd S101 FFFractionation (Postnova) | 1 | 700 | 0.0005%SDS 0.0002%NaN3 | 50μL | ICP HRMS – Element (Thermo) | Meinhard concentric | UV | Co, Cs 100μg L−1 | Mg, Al, Ti, Mn, Fe, Co, Cu, Cs, Pb | ✗ | Sewage contaminated soil | Environmental | 40 |
| Sd FFFractionation (Postnova) | 2 | 300/1000 | 0.1mM NaOH or MQ water | 100μL | Elan 6000 (Perkin Elmer) | nd | UV | Ir, Pb, Zn and Mg | Al, Pb, Zn | ✗ | Clay minerals | Environmental | 41 |
| Sd S101 FFFractionation (Postnova) | 1 | 800 | 1mM SPP 0.02% NaN3 | 100/200μL | VG plasmaquad (Thermo) | Pneumatic | UV | In 100 μg L−1 | Al, Fe, Mg | ✗ | Soil colloids | Environmental | 42 |
| FFF (commercial denomination) | Flow | Crossflow/mL min−1 | Carrier | Injection | ICPMS | Nebulizer | Other online detectors | Internal standard | Monitored elements | Quantitative approach | Sample | Applications | Ref |
|---|---|---|---|---|---|---|---|---|---|---|---|---|---|
| FFFractionation (Postnova) | 0.5 | 2.96 | 5mM borate 10mM NaCl pH 8.1 | up to 50mL | VG plasmaquad (Thermo) | Meinhard | UV | In | 28/ 32 elements | ✗ | Natural water/ Freshwater | Environmental | 7, 12 |
| F1000 with FO FFFractionation (Postnova) | 1 | 2 | 100mM Tris-HNO3 pH 8 | 20μL | Elan 250 (Perkin Elmer) | Corssflow | UV | nd | 112Cd, 114Cd, 63Cu, 65Cu, 64Zn, 66Zn, 127I | Proteins | Bioapplications | 19 | |
| F1000 FFFractionation (Postnova) | 2 | 0.5 | 0.01% Tween20 0.1mM NaClO4 5mM Tris pH 9 | 20μL | Elan 6000 (Perkin Elmer) | Corssflow | MALLS | nd | Mg | Bentonite colloids | Environmental | 43 | |
| F1000 S FFFractionation (Postnova) | 1 | 2 | 10mM Tris HNO3 pH 7.3 / water | 20μL-1mL | Elan 5000a (Perkin Elmer) | Gem tip cross flow | UV | nd | 27Al, 35Cl, 54Fe, 63Cu, 64Zn, 79Br, 127I, 208Pb | HA from soil peat and compost samples Wastewater samples | Environmental | 24 | |
| FFFractionation - symetric (Postnova) | 1 | 5 → 0.5 | 5mM Tris buffer pH 9 | 100μL | Elan 6000 (Perkin Elmer) | nd | UV | Rh 50ppb | Eu, Th, La, Ce, Si | Groundwater | Environmental | 14 | |
| F1000 with FO FFFractionation (Postnova) | 1 | 2 | 30mM Tris buffer pH 7.5 | 20μL | Elan 5000a/6000 (Perkin Elmer) | Gem-Tip Crossflow | UV | nd | 48Ti, 55Mn, 57Fe, 63Cu, 64Zn, 88Sr, 208Pb | Sediment HA & FA | Environmental | 44 | |
| F1000 with FO FFFractionation (Postnova) | 1 | 0.6 | 0.1% FL70 | 20μL | Elan 5000a (Perkin Elmer) | Gem-Tip Crossflow | UV | nd | 27Al, 29Si, 48Ti, 57Fe, 90Zr, 208Pb | Chemical mechanical polishing slurries | Industrial | 16 | |
| FFFractionation - symetric (Postnova) | 1/2 | 5 → 0.5/0.5 | 5mM Tris buffer pH 9 / + 0.01% wt tween 20 0.1mM NaClO4 | 100μL | Elan 6000 (Perkin Elmer) | nd | UV MALLS | Rh 50ppb | Mg, Al, Fe, U, Ca, Th, La, Ce | Aquatic colloids (natural bentonite sediment, groundwater) | Environmental | 45 | |
| As-Fl-FFF Consenxus | 0.6 | 0.5 | 0.025%SDS 0.02%NaN3 | nd | Elan 5000 (Perkin Elmer) | nd | UV FLD MALS | nd | Fe, Zn Cu, Pb, Zn | ✗ | Pore water samples from sediment cores | Environmental | 46 |
| F1000 FFFractionation (Postnova) | 0.5 | 3 | 15mM NH4NO3 pH 7 | up to 45mL | ICP HRMS – Element (Thermo) | Burgener mira mist | UV Fluorescence | nd | Fe, Sb, V, Cu, Zr, Al, Mn, Pb, U, Rb, S, … > 40 element | ✗ | River colloids | Environmental | 13, 25, 27 |
| F1000 FFFractionation (Postnova) | 4 | 0.4 | 10mM NH4Cl 0.005%v/v Triton | 25μL | Elan DRC (Perkin Elmer) | Concentric | UV | nd | 238U | Bacterial cell suspensions | Bioapplications | 20 | |
| F1000 FFFractionation (Postnova) | 1 | 0.2/4 | 10mM NH4Cl pH 6 | 50μL | Perkin Elmer | Pneumatic | UV | nd | 27Al, 54Fe, 57Fe, 55Mn, 58Ni, 60Ni, 62Ni, 238U | Water extracts of sediment | Environmental | 47 | |
| AF4 Postnova | 1 | 6.67 → 0 | 1mM NaCl | 10–1000μL | Elan 6100 (Perkin Elmer) | Crossflow | UV Fluorescence | nd | 27Al, 52Cr, 55Mn, 57Fe, 58Ni, 65Cu, 68Zn | ✗ | Sewage plant hydrocolloids | Environmental | 10 |
| PN 1021 (Postnova) | 1 | 2 | 30mM Tris buffer pH 7.5 | 20μL | Elan 6000 (Perkin Elmer) | Crossflow | UV | nd | 63Cu, 65Cu, 111Cd, 114Cd, 206Pb, 208Pb | Humic acids | Environmental | 48 | |
| F1000 FFFractionation (Postnova) | 0.5 | 4 | 15mM NH4NO3 pH 7 | 45mL | ICP HRMS – Element 2 (Thermo) | Concentric | UV | In 1μg L−1 | 68 elements | ✗ | Natural water sample | Environmental | 26 |
| AF 2000 (Postnova) | 1 | 0.1 | 50mM NH4Cl pH8 | Inj 250μL | ICP HRMS – Element 2 (Thermo) | Concentric | DRI LS | In 1μg L−1 | 208Pb, 111Cd | ✗ | Alginate | Metal - alginate | 21 |
| HR FFF10000 (Postnova) | 0.6 | 3.4 → 0 | MQ water pH9.3 (NaOH) | 100μL | Elan 6000 (Perkin Elmer) | nd | UV | Rh | Co, Cu, Zn, Ni, Al, Fe, Pb, Sn, Ag, U, Ca, As, Mg, Rb, Sr | Compost leachates | Environmental | 9 | |
| F1000 FFFractionation (Postnova) | 1 | 0.25 → 0.1 | 0.02% SDS | nd | 7500c (Agilent) | Babington | UV-DAD FLD MALLS | nd | Al, Fe, Mn, Pb, Cu, Ni | ✗ | River Samples | Environmental | 49 |
| AF4 with SO (Postnova) | 0.5/1 | Depend of applications | Depends on applications | 5–1000μL | Elan 6100 (Perkin Elmer) | Seaspray | UV | nd | 169Tm, | Sewage plant Nanoparticles Proteins Liquid manure | Analytical development | 31 | |
| (Postnova) | 0.9 | 4.8 | 1mM NaCl 3mM NaN3 | 100μL | Micromass Platform ICPMS (Micromass) | Meinhard concentric | UV | nd | U | ✗ | Groundwater | Environmental | 50 |
| HR FFF10000 (Postnova) | 1.5 | 3.5 | 5mM Na2SO4 3mM NaN3 | 100μL | Micromass Platform ICPMS (Micromass) | nd | UV TOC | nd | Cu, Mn, Mo, Ni, Sr, U, Zn, Fr | ✗ | DOC in clay aquitard | Environmental | 51 |
| HR FFF10000 (Postnova) | 0.5 | 0.5 | 5mM Trisbuffer pH8.6 | 500μL | Elan 6000 (Perkin Elmer) | nd | — | Rh | 133Ca, 57Fe, 28Si, 88Sr, 44Ca | Aquatic groundwater | Environmental | 52 | |
| AF 2000 (Postnova) | 0.5 | 3 | 55mM NH4Cl pH 8 (15mM NH4Cl pr 1 each) | 45mL | ICP HRMS – Element 2 (Thermo) | nd | UV Fluorescence detector | nd | 24 elements | ✗ | Freshwater colloids during estuarine mixing | Environmental | 15 |
| PN 1021 FO (Postnova) | 1 | 2 | 30mM tris buffer pH7.5 | Inj 5mL | Elan 6000 (Perkin Elmer) | Gem tip cross flow | UV | nd | Br, Ca, Cl, Cu, Fe, I, Mg, Si, Sr, U, W | Natural seep water | Environmental | 28 | |
| Eclipse 2 (Wyatt) | 1 | 0.5 | CH3COONH4 30mM | 100–400μL | 7500 CE (Agilent) | Micromist | UV DR MALLS | nd | 27Al, 75As, 54Fe, 55Mn, 208Pb, 120Sn | Landfill leachates | Environmental | 11 | |
| Eclipse 2 (Wyatt) | 1 | 0.5 | NH4NO3 10mM SDS 0.3mM pH 8 | 100μL | 7500 CE (Agilent) | Meinhard | UV MALLS | nd | 75As, 111Cd, 113Cd, 121Sb, 123Sb, 78Se, 80Se, 116Sn, 118Sn, 120Sn,206Pb and 208Pb | ✗ | Soil leachates | Environmental | 53 |
| HR FFF10000 (Postnova) | 0.8 | 2.4 → 0 | MQ water pH 9.3 (NaOH) | 100μL | Elan 6000 (Perkin Elmer) | Crossflow type | UV | 103Rh | 49 elements | ✗ | Mixture of HA and clay colloids Synthetic nanoparticles | Environmental Industrial | 54 |
| HR FFF10000 (Postnova) | 0.8 | 3.2 → 0 | MQ water pH 5.7 | 100μL | Elan6000 (Perkin Elmer) | Crossflow type | UV | Rh | Eu | ✗ | Polyacrylic acid | Environmental | 55 |
One of the major advantages of FFF, promoting its easy coupling with ICP-MS, is the similar outlet flow range to this one from High Performance Liquid Chromatography (HPLC). All outlet flows reported in the literature were ranged from 0.5 to 2 mL min−1 except in the study of Jackson et al. in 2005 where a channel main flow of 4 mL min−1 was used.20 In this last study, the flow was then split before ICP-MS introduction in order to obtain a flow at 2 mL min−1. Currently, lots of authors split the flow to both reduce the inlet flow in the ICP nebulizer and/or introduce internal standard or acid (see quantification part).
However, a split connection is very sensitive to small changes in back pressure. Thus, ICP-MS being very sensitive to nebulizer flow rate, its sensitivity strongly depends on this split connection. This drawback can be resolved by using an internal standard. The most robust solution is to avoid a split if the flows are compatible with the nebulizer (typically ∼0.1–1.0 mL min−1) and then add a small flow of acid and internal standard. If not using a split system the tubing is directly connected to the nebulizer.
All common nebulizers have been employed (micromist, crossflow, concentric, babington…) (see Tables 1 and 2). No systematic studies comparing them for FFF applications have been presented, and so no conclusion and tendencies could be derived.
One of the major interrogations concerns the non size-dependence of nebulisation, atomization and ionisation of colloids (macromolecules and nanoparticles) after FFF separation. In fact, with analytes in a large size range (from some nanometres up to few micrometres), this question is understandable. Some authors have examined this point and Murphy et al. showed that in the range of large particles (> 2000nm), the size effect on the degree of atomization and ionization of the elements by the ICP torch would need to be carefully tested.6 Prestel et al. pointed out that the atomization was complete with monodisperse silica colloids with particle diameters <500 nm.10 Over this diameter, they noticed a deviation from the expected concentration but without size dependence. However, the results obtained with a 1000 nm diameter particle presented a shift compare to those <500nm. In a study on natural clays, Schmitt et al. did not observe any change of metal concentration between ICP-AES measurements after acid digestion and direct Flow Injection Analysis (FIA) ICP-MS for the clays in a size range of 100 to 1000 nanometres.41 Contado et al. conducted a work on slurry analysis by Sd-FFF coupled with a Graphite Furnace Atomic Absorption Spectrometry (GFAAS) and ICP-MS.35 They observed the effect of sample digestion on direct GFAAS and ICP-MS analysis of slurries. They concluded that the direct slurry nebulization method may be effective for Sd-FFF eluate analyses with ICP-MS and support an earlier result obtained where the submicron slurry direct injection is accurate to within 1%. In the same way, Ebdon & Collier pointed out a cut-off point for the particle size at approximately 2000 nm where particles are selectively rejected by the spray chamber.57 This is starting to coincide with the smallest droplet size in the nebulisation. The spray chamber designs are selected to remove the droplets larger than ∼10μm.
In the light of these results, it seems that the presented results indicate that for normal mode FFF which is typically below 600–800nm there is no sign of particle selectivity in the nebulizer-spraychamber system, especially in Sd-FFF because of its higher upper limit of potentially separable size range.
Quantitative analysis
Quantitative analysis methods are among the first objectives of FFF-ICP-MS coupling.Even if a large part of papers used various quantification approaches, details about the set up and the analytical procedure to quantify are not well documented. Few authors detail their quantification methods and the analytical development of this process.7,12,26,37,53,54
The different procedures generally described in the literature are based on two consecutive steps.60 The sample is first injected via the FFF system and elemental signals monitored with the ICP-MS. Then, injections of standard solutions generally prepared with the carrier flow are performed directly in the ICP-MS. Injections are made with a syringe or with the help of an external pump in order to evaluate the ICP-MS response. When a syringe or a small loop is used, the time resolved analysis mode of the ICP-MS gives peaks which can be integrated and linked to the amount of element injected (see an example in Dubascoux et al.53). Fig. 2A gives an example of this methodology. Alternatively a large loop volume or direct continuous standard injections give a flat topped peak. The level of the flat topped peak directly gives the ICP-MS intensity for a known concentration (see examples in Lyven et al. and Bouby et al.12,54). Fig. 2B gives an example of this kind of quantification. The left and right parts present the signal of sample fractionation and standard injection respectively. These two steps (i.e. colloidal fractionation and elemental injection) could be inverted.
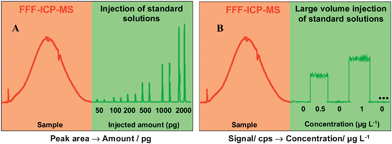 | ||
| Fig. 2 Quantification procedures. | ||
In the same way, the outlet flow of the FFF system is generally split in order to decrease the flow before ICP introduction and/or to mix this flow with a second acidified flow. Acidification of the flow is generally performed with nitric acid (HNO3) ranging from 1 to 6% and is realized to avoid memory effect in the introduction system and thus improves the signal stability.7 Moreover, this adding flow could serve to introduce an internal standard (-IS- as In, Rh, Co, Cs, Pr or Bi – see Tables 1 and 2) at fixed concentration. This IS serves to correct ICP-MS signal during elemental monitoring from fractionation or standard injections and thus corrects baseline drift, artifact or unusual signal.37
With regard to the high potential of FFF-ICP-MS coupling and in order to insure accurate quantitative analysis, some important things have to be checked, especially concerning recovery and interferences (including spectral ones).
For complex matrix analysis, spectral interferences could also occur. The use of Collision Reaction Cell (CRC) can avoid some of them as for As or Se quantification (with interferences mainly due to ArCl+ and ArAr+ respectively).53 Spectral interferences can be also removed by using High Resolution (HR) ICP-MS. Thus, the coupling of Fl-FFF and HR ICP-MS allows the quantification of elements such as As, Se, Ge, P, S, K, Cr and V.26 Using medium or high resolution undeniably improves quantification reliability and enlarges the number of elements that can be studied.
FFF-ICPMS applications
Environmental
As already mentioned, applications of FFF-ICP-MS are mainly environmental. It is generally admitted that Fl-FFF is the most versatile and used technique among FFF techniques for environmental studies.22 However Sd-FFF is generally more adapted for large nanoparticles (in ∼100–800 nm range), especially when there is a density difference between particles that one can utilize. FFF-ICP-MS hyphenation could have various applications as a function of the study objectives. In fact, this set up could be used to monitor colloidal most abundant elements as a function of particle size. For example, Berkel et al. used Sd-FFF-ICP-MS to monitor elemental composition according to the size and linked this composition with adsorption of pollutants (orthophosphate) on river and soil colloids.33,34 Plotting the elemental ratios versus the size also permits to evaluate changes in particle mineralogy and composition.6 Hassellöv et al. used Sed-FFF ICPMS to study sorption of metals to the submicron fractions of marine sediment particles.7 Other studies deal with trace element distribution within the size range on natural colloids.53 Montavon et al. studied the complexation of polyacrilic acids with Eu(III) as a function of concentrations and pH.55 Finally, lots of applications have been performed on various matrices as soil, natural water, sewage plant, landfill leachates… For more details about environmental applications, Hassellov et al. carried out a summary of FFF-ICP-MS environmental applications in 2007.60Bioapplications
Recent reviews in bioanalysis and biotechnology underline the potential of FFF-based coupling for separation and characterization materials.61,62 In the same way, Fraunhofer et al. stated that ICP-based methods may fertilize the Fl-FFF application range in pharmaceutics and bio pharmaceutics.63 Despite the high potential of this kind of coupling, few studies deal with these applications. Siripinyanond et al. study the speciation of metals (Cadmium, Copper, Iodine and Zinc) in various proteins as metallothionein or thyroglobulin via Fl-FFF-ICP-MS coupling.44 Jackson et al. used this hyphenation to investigate the adsorption of Uranium between cells and extracellular polymeric substances.20 Finally, Alasonati et al. studied the characteristics and the distribution variations of alginate with addition of Cd and Pb in order to study metal-alginate interactions.21Nanoparticles
Concerning engineered nanoparticles, literature is very scarce. However, the high emerging potential and the growing interest concerning their characterization and environmental risk evaluation lead to a development of characterization methodology. Among existing techniques to fractionate and characterize nanoparticles the coupling between FFF and ICP-MS is very useful to characterize metal-containing nanoparticles.64 Siripinyanond and Barnes used Fl-FFF to characterize (size range, polydispersity…) alumina- and silica-based mechanical polishing slurries.44 They found ICP-MS better for providing size distribution information than UV because of potential inaccuracy due to light scattering. Bouby et al. recently characterize synthetic CdSe/ZnS-Mercapto Acetic Acid core/shell-coated quantum dots.54 Quantification of Cadmium and Zinc was performed to evaluate the recovery of each element and calculate the elemental ratio. The atomic ratio (Cd/Zn) was constant over the size class indicating the homogeneous composition of the manufactured nanoparticles.Particular applications
Al-Ammar et al. proposed an original application of Fl-FFF-ICP-MS, which was not used to fractionate colloids but as a tool for matrix removal and sample preconcentration (during the focusing step).56 In this way, sample was preconcentrated close to the end of the channel during the focus step and elements complexed with the help of a strong complexing agent (Poly(ethylene imine)) in order to avoid analyte losses through the ultrafiltration membrane. In the same time, matrix components were removed within the crossflow. Recently, a similar approach (but in a one-step procedure) was investigated and compared to the previous one by Sangsawong et al. with ICP-Optical Emission Spectrometry (ICP-OES) as detector.65 They obtained equivalent percentage of matrix removal for a seawater sample for the two procedures.Other FFF-ICP-based applications
Even if they do not use ICP-MS but ICP-OES, some recent papers from the Siripinyanond group have really enlarged the application field of FFF-ICP-based hyphenation. A couple of papers present food applications.17,18 Purawatt et al. used Fl-FFF with ICP-OES to monitor iron complexed to phytic and tannic acids in food suspensions from kale extract and tea infusions during simulated gastrointestinal digestions.18 Saeseaw et al. used Sd-FFF to evaluate aggregation and monitor aggregate sizes of β-lactoglobulin in the presence of Ca2+ and Zn2+.17 Kumtabtim et al. in 2005 evaluated the size distribution of elements on air particulates using Sd-FFF ICP-OES.8 Air particulates were collected using a quartz fiber filter and resuspended in solution before fractionation. Various elements (Al, Fe, Mg, and Ti) were monitored on air particulates and their size class evaluated.Conclusion
FFF-ICP-MS remains a relatively young hyphenated technique, still relatively confidentially used, the recent instrumental and analytical developments give it a high potential in terms of size resolution, sensitivity and accuracy. Its intrinsic capability to size- fractionate and obtain physico-chemical information of sub-micrometre particles of high interest in environment, pharmaceutics or materials makes FFF-ICP-MS a relevant and attractive alternative to more conventional spectroscopic- or microscopic- based methods. Currently, a lot of analytical investigations are still needed. In this way, a special deal of interest has to be given on the interface between FFF and ICP-MS in order to have a quantitative transfer of the analytes into the plasma and avoid mass discrimination as much as possible. Such efforts will finally allow the field of applications to be extended to particles over the whole nanometre–micrometre scale.References
- M. E. Schimpf, K. D. Caldwell and J. C. Giddings, in Field Flow Fractionation Handbook, ed. M. E. Schimpf, K. D. Caldwell and J. C. Giddings, Wiley Interscience, New York, 2000, 592 pp Search PubMed.
- R. Beckett, Atom. Spectrosc., 1991, 12, 228–332 CAS.
- R. Beckett, D. M. Hotchin and B. T. Hart, J. Chromatogr., A, 1990, 517, 435–447 CrossRef CAS.
- J. D. Chittleborough, M. D. Hotchin and R. Beckett, Soil Sci, 153(5), 341–348 Search PubMed.
- H. E. Taylor, J. R. Garbarino, D. M. Murphy and R. Beckett, Anal. Chem., 1992, 64(18), 2036–2041 CrossRef CAS.
- D. M. Murphy, J. R. Garbarino and H. E. Taylor, J. Chromatogr., A, 1993, 642, 459–467 CrossRef CAS.
- M. Hassellöv, B. Lyven, C. Haraldson and W. Sirinawin, Anal. Chem., 1999, 71(16), 3497–3502 CrossRef CAS.
- U. Kumtabtim, J. Shiowatana and A. Siripayanond, J. Anal. At. Spectrom., 2005, 20, 1185–1190 RSC.
- E. Bolea, M. P. Gorriz, M. Bouby, F. Laborda, J. R. Castillo and H. Geckeis, J. Chromatogr., A, 2006, 1129(2), 236–246 CrossRef CAS.
- H. Prestel, L. Schott, R. Niessner and U. Panne, Water Res., 2005, 39, 3541–3552 CrossRef CAS.
- S. Dubascoux, J. Heroult, I. Le Hecho, M. Potin-Gautier and G. Lespes, Anal. Bioanal. Chem., 2008, 390, 1805–1813 CrossRef CAS.
- B. Lyven, M. Hassellöv, D. R. Turner, C. Haraldson and K. Andersson, Geochim. Cosmochim. Acta, 2003, 67(20), 3791–3802 CrossRef CAS.
- R. Dahlqvist, K. Andersson, J. Ingri, T. Larsson, B. Stolpe and D. Turner, Geochim. Cosmochim. Acta, 2004, 68(20), 4059–4075 CrossRef CAS.
- H. Geckeis, T. Rabung, T. Ngo Manh, J. I. Kim and H. P. Beck, Environ. Sci. Technol., 2002, 36, 2946–2952 CrossRef CAS.
- B. Stolpe and M. Hassellöv, Geochim. Cosmochim. Acta, 2007, 71, 3292–3301 CrossRef CAS.
- A. Siripinyanond, R. M. Barnes and D. Amarasiriwardena, J. Anal. At. Spectrom., 2002, 17, 1055–1064 RSC.
- S. Saeseaw, J. Shiowatana and A. Siripinyanond, Anal. Bioanal. Chem., 2006, 386, 1681–1688 CrossRef CAS.
- S. Purawatt, A. Siripinyanond and J. Shiowatana, Anal. Bioanal. Chem., 2007, 389, 733–742 CrossRef CAS.
- A. Siripinyanond and R. M. Barnes, J. Anal. At. Spectrom., 1999, 14, 1527–1531 RSC.
- B. P. Jackson, J. F. Ranville and A. L. Neal, Anal. Chem., 2005, 77, 1393–1397 CrossRef CAS.
- E. Alasonati, B. Stolpe, M. A. Benincasa, M. Hassellöv and V. I. Slaveykova, Environ. Chem., 2006, 3, 192–198 CrossRef CAS.
- L. J. Gimbert, K. N. Andrew, P. M. Haygarth and P. J. Worsflod, TrAC, 2003, 22(10), 615–633 Search PubMed.
- B. Lyven, M. Hassellöv, C. Haraldson and D. R. Turner, Anal. Chim. Acta, 1997, 357, 187–196 CrossRef CAS.
- D. Amarasiriwardena, A. Siripinyanond and R. M. Barnes, J. Anal. At. Spectrom., 2001, 16, 978–986 RSC.
- R. Dahlqvist, M. F. Benedetti, K. Andersson, D. Turner, T. Larsson, B. Stolpe and J. Ingri, Geochim. Cosmochim. Acta, 2004, 68(20), 4059–4075 CrossRef CAS.
- B. Stolpe, M. Hassellöv, K. Andersson and D. R. Turner, Anal. Chim. Acta, 2005, 535(1–2), 109–121 CrossRef CAS.
- K. Andersson, R. Dahlqvist, D. Turner, B. Stolpe, T. Larsson, J. Ingri and P. Andersson, Geochim. Cosmochim. Acta, 2006, 70, 3261–3274 CrossRef CAS.
- J. V. Cidziel, C. Guo, S. M. Steinberg, Z. Yu and K. H. Johannesson, Environ. Geochem. Health, 2008, 30, 31–44 Search PubMed.
- J. C. Giddings, Anal. Chem., 1990, 62, 2306–2312 CrossRef CAS.
- P. Li, M. Hansen and J. C. Ginddings, J. Microcolumn Sep., 1998, 10(1), 7–18 CrossRef CAS.
- E. Zanardi-Lamardo, C. D. Clarck and R. G. Zika, Anal. Chim. Acta, 2001, 443, 171–181 CrossRef CAS.
- H. Prestel, R. Niessner and U. Panne, Anal. Chem., 2006, 78, 6664–6669 CrossRef CAS.
- J. Van Berkel and R. Beckett, J. Chromatogr., A, 1996, 733, 105–117 CrossRef CAS.
- J. Van Berkel and R. Beckett, J. Liq. Chromatogr. Relat. Technol., 1997, 20(16), 2647–2667 CAS.
- B. Contado, G. Blo, F. Fagioli, F. Dondi and R. Beckett, Colloids Surf., A, 1997, 120, 47–59 CrossRef CAS.
- M. Hassellöv, B. Lyven and R. Beckett, Environ. Sci. Technol., 1999, 33(24), 4528–4531 CrossRef.
- J. F. Ranville, D. J. Chittleborough, F. Shanks, R. J. S. Morrisson, T. Harris, F. Doss and R. Beckett, Anal. Chim. Acta, 1999, 381, 315–329 CrossRef CAS.
- B. Chen, J. Hulston and R. Beckett, Sci. Total Environ., 2000, 263, 23–35 CrossRef CAS.
- A. Chen and R. Beckett, Analyst, 2001, 126, 1588–1593 RSC.
- B. Chen, C. A. Shand and R. Beckett, J. Environ. Monit., 2001, 3, 7–14 RSC.
- D. Schmitt, H. E. Taylor, G. R. Aiken, D. A. Roth and F. H. Frimmel, Environ. Sci. Technol., 2002, 36, 2932–2938 CrossRef CAS.
- J.F. Ranville, D. J. Chittleborough and R. Beckett, Soil Sci. Soc. Am. J., 2005, 69, 1173–1184 CAS.
- M. Plaschke, T. Schäfer, T. Bundschuh, T. Ngo Manh, H. Gekeis and J. I. Kim, Anal. Chem., 2001, 73, 4338–4347 CrossRef CAS.
- A. Siripinyanond and R. M. Barnes, Spectrochim. Acta, Part B, 2002, 57, 1885–1896 CrossRef.
- H. Geckeis, T. Ngo Manh, M. Bouby and J. I. Kim, Colloids Surf., A, 2003, 217, 101–108 CrossRef CAS.
- F. V. D. Kammer, M. Baborowski, T. Soheyl and T. W. v. Tumpling, Acta Hydrochim. Hydrobiol., 2003, 31(45), 400–410 CrossRef.
- B. P. Jackson, J. F. Ranville, P. M. Bertsch and A. G. Sowder, Environ. Sci. Technol., 2005, 39, 2478–2485 CrossRef CAS.
- A. Siripinyanond, S. Worapanyanond and J. Shiowatana, Environ. Sci. Technol., 2005, 39, 3295–3301 CrossRef CAS.
- M. Baalousha, F. V. D. Kammer, M. Motelica-Heino, M. Baborowski, C. Hofmeister and P. Le Coustumer, Environ. Sci. Technol., 2006, 40, 2156–2162 CrossRef CAS.
- J. F. Ranville, M. J. Hendry, T. N. Reszat, Q. Xie and B. D. Honeyman, J. Contam. Hydrol., 2007, 91, 233–246 CrossRef CAS.
- T. N. Reszat and M. J. Hendry, Groundwater, 2007, 45(5), 542–553 CrossRef CAS.
- M. H. Baik, J. I. Yun, M. Bouby, P. S. Hahn and J. I. Kim, Korean J. Chem. Eng., 2007, 24(5), 723–729 Search PubMed.
- S. Dubascoux, I. Le Hécho, M. Potin-Gautier and G. Lespes, Talanta, 2008, 75, 486–493 CrossRef CAS.
- M. Bouby, H. Geckeis and F. W. Geyer, Anal. Bioanal. Chem., 2008, 392(7–8), 1447–1457 CrossRef CAS.
- G. Montavon, M. Bouby, S. Huclier-Markai, B. Grambow, H. Geckeis, T. Rabung, I. Pashalidis, B. Amekraz and C. Moulin, J. Colloid Interface Sci., 2008, 327, 324–332 CrossRef CAS.
- A. Al-Ammar, A. Siripinyanond and R. M. Barnes, Spectrochim. Acta, Part B, 2001, 56, 1951–1962 CrossRef.
- L. Ebdon and A. R. Collier, J. Anal. At. Spectrom., 1988, 3, 557–562 RSC.
- M. A. Benincasa, G. Cartoni and N. Imperia, J. Sep. Sci., 2002, 25, 405–415 CrossRef CAS.
- J. Szpunar and R. Lobinsky, in Hyphenated Techniques in Speciation Analysis, ed. J. Szpunar and R. Lobinsky, Cambridge, RSC, 2003, Ch. 4, pp.53–62 Search PubMed.
- M. Hassellöv, F. V. D. Kammer and R. Beckett, in Environmental colloids and particles - Behaviour, separation and characterization, ed. K. J. Wilkinson and J. R. Lead, J. Wiley and sons, Chichester, 2007, vol. 10, pp. 223–277 Search PubMed.
- P. Reschiglian, A. Zattoni, B. Roda, E. Michelini and A. Roda, Trends Biotechnol., 2005, 23(9), 475–483 CrossRef CAS.
- B. Roda, A. Zattoni, P. Reschiglian, M. H. Moon, M. Mirasoli, E. Michelini and A. Roda, Anal. Chim. Acta, 2009, 635, 132–143 CrossRef CAS.
- W. Fraunhofer and G. Winter, Eur. J. Pharm. Biopharm., 2004, 58, 369–383 CrossRef CAS.
- M. Hassellöv, J. W. Readman, J. F. Ranville and K. Tiede, Ecotoxicology, 2008, 17(5), 344–361 CrossRef.
- S. Sangsawong, J. Shiowatana and A. Siripinyanond, J. Anal. At. Spectrom., 2006, 21, 1336–1339 RSC.
| This journal is © The Royal Society of Chemistry 2010 |