 Open Access Article
Creative Commons Attribution 3.0 Unported Licence
Gas-fed photoelectrochemical reactions sustained by phosphotungstic acid as an inorganic surface electrolyte†
Fumiaki
Amano
 *a,
Keisuke
Tsushiro
ab and
Chiho
Akamoto
b
aDepartment of Applied Chemistry for Environment, Tokyo Metropolitan University, 1-1 Minami-Osawa, Hachioji, Tokyo 192-0397, Japan. E-mail: f.amano@tmu.ac.jp
bDepartment of Chemical and Environmental Engineering, The University of Kitakyushu, 1-1 Hibikino, Wakamatsu-ku, Kitakyushu, Fukuoka 808-0135, Japan
First published on 4th March 2024
Abstract
Gas-fed photoelectrochemical (PEC) system with a porous photoelectrode and proton-exchange membrane (PEM) has the potential to produce hydrogen from water vapour and activate methane at room temperature. To effectively drive gas-phase PEM-PEC reactions, porous photoelectrodes should be coated with a solid electrolyte of perfluorinated sulfonic acid (PFSA) ionomers. However, fluorocarbon-based ionomers were not chemically stable in vapour-fed PEC systems. Herein, we report that polyoxometalate, an inorganic proton-conducting material, may be employed as the surface electrolyte of a WO3 porous photoelectrode for vapour-fed water splitting and methane activation under visible light irradiation. We demonstrate that the porous WO3 photoanode modified with phosphotungstic acid (H3PW12O40) induces PEC reactions, including the oxygen evolution reaction and methane conversion, under gas feeding. Additionally, we demonstrated improved durability by using the inorganic surface electrolyte.
Introduction
Photoelectrochemical (PEC) water splitting is a method of producing hydrogen using renewable energy with no carbon dioxide emissions. Water vapour harvesting from ambient humidity may solve the freshwater shortage problem in the world, making green H2 sustainable.1–3 The use of water vapour has the additional benefit of minimizing active water purification, liquid pumping, and bubble formation.4–6 The gas-fed PEM-PEC reactions for producing H2 necessitate the use of all-solid PEC devices with polymer electrolyte membranes that operate at low temperatures around 25 °C.Prototype gas-fed PEC systems have been developed using a proton exchange membrane (PEM) with a porous photoanode and cathode electrocatalyst.7–23 We found that the surface coating of the porous photoelectrodes with perfluorinated sulfonic acid (PFSA) ionomers significantly enhanced the PEC performance of the vapour-fed system operating without liquid electrolyte.13–17 The surface ionomer decorated on the porous photoanodes forms a triple-phase boundary, allowing gas, semiconductor particles, and electrolyte to come into contact simultaneously, facilitating proton-coupled electron transfer (PCET) and charge transport in the gas-fed PEC cell. Surface proton conduction is promoted by the humidity-adsorbed water layer in the ionomer.16,19,20,22
Surface coatings of the PFSA ionomers, such as Nafion® from Chemours and Aquivion® from Solvay, aid in PCET and proton transport in the functionalized porous photoelectrode.11,13–17,22,23 As a result, PFSA-functionalized photoanodes such as TiO2 and SrTiO3 can induce vapour-fed water splitting with as high efficiency as the conventional liquid electrolyte system.14–16 The all-solid PEM-PEC system using porous photoanodes such as TiO2 and WO3 has also been employed in the CH4 conversion reactions (steam reforming of methane and dehydrogenative coupling to ethane).24,25 The selectivity for C2H6 from CH4 was more than 50% on a carbon basis for the ionomer-coated WO3 photoanode under visible light irradiation.
However, the photocurrent responses in the PEM-PEC cells gradually decreased with the accompanying CO2 formation during vapour-fed water splitting reactions under UV irradiation.14–16,22 This degradation suggests oxidative decomposition of the PFSA ionomers decorated on the photoanode surface by the photogenerated holes and hydroxyl radicals. Although the fluorocarbon backbones are chemically stable compared with other organic materials, PFSA ionomers are degraded by hydroxyl radicals during PEM fuel cell operation.26 In the same way, the PFSA ionomer decorated on the photoanodes would be oxidized by the valence band holes and the photogenerated hydroxyl radical in the PEM-PEC system.
To avoid the degradation of the triple-phase boundary in the functionalized photoanodes, we explored polyoxometalate, an inorganic proton-conducting material that is oxidatively stable in comparison with other organic materials, as a surface electrolyte to replace the PFSA ionomer. In this study, we studied the surface modification of a porous WO3 photoanode with phosphotungstic acid (PWA) to improve the photocurrent response in water vapour splitting and CH4 conversion reactions in a gas-fed PEM-PEC system. PWA (H3PW12O40) is a polyoxometalate with Brønsted acidity and exhibits proton conductivity under high humidity.27–30 We demonstrated that PWA enhances the PEC response in gas-fed PEC systems under UV and visible light.
Experimental
Preparation of the porous WO3 photoanodes
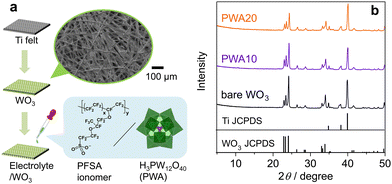
The porous WO3 photoanode was prepared by using Ti fibre felt (Nikko Techno), which served as a gas-diffusion conductive substrate (Fig. 1a).24,31 The Ti felt was dipped in an aqueous solution of (NH4)6H2W12O40 (Nippon inorganic color & chemical) and polyethylene glycol 20![[thin space (1/6-em)]](https://www.rsc.org/images/entities/char_2009.gif) 000 (Fujifilm Wako pure chemical) for 30 min. The dip-coated felt was then dried at 80 °C. This treatment was repeated three times. The obtained samples were then calcined at 650 °C in air for 2 h.
000 (Fujifilm Wako pure chemical) for 30 min. The dip-coated felt was then dried at 80 °C. This treatment was repeated three times. The obtained samples were then calcined at 650 °C in air for 2 h.
The porous WO3 electrodes were functionalized with solutions of 5 wt% Nafion PESA ionomer (D520, fuel cell store) or H3(PW12O40)⋅nH2O (Fujifilm Wako pure chemicals) by drop casting. After applying 3.5–10 μL cm−2 onto the surface, the drop-cast electrode was dried at 80 °C for 10 min. Subsequently, another cast was applied on the opposite side of the electrode and dried in the same manner. The loading weights of the surface electrolyte relative to WO3 (8 mg cm−2) are 12 wt% and 2–20 wt% for PFSA/WO3 and PWA/WO3, respectively.
Characterization
X-ray diffraction patterns were recorded on a SmartLab diffractometer (Rigaku) using Cu Kα radiation. Micro-Raman spectra were recorded on an inVia Reflex (Renishaw) with a 532-nm green laser. Surface composition was analyzed using a JSM-7800F field-emission scanning electron microscope (JEOL) with an energy-dispersive X-ray spectrometer (EDS).PEM-PEC reaction in the gas phase
The PEC measurements were performed in a two-electrode system using a HZ-Pro S4 workstation (Hokuto Denko). The cathode was composed of a ∼50 wt% Pt-loaded carbon black (Pt–CB, Tanaka Kikinzoku Kogyo) catalyst with an ionomer and Toray carbon paper (fuel cell store). A Nafion N117 film (Chemours) was sandwiched between the porous photoanode and cathode electrocatalyst by pressing at 140 °C for 4 min.The PEC reaction was performed at 26 °C and a pressure of 1 bar. The gas flow rate was controlled using mass-flow controllers. The photoanode side was supplied with 20 mL min−1 of high-purity CH4 (Osaka gas liquid, >99.999%), which was passed through the liquid water at 24 °C. The water vapour pressure was monitored using a dew point meter, EE33 (Tekhne). The relative humidity (RH) in the reactor was 80–90%, without liquid condensation. The cathode side was supplied with 20 mL min−1 of humidified Ar gas. The geometric surface area of the two electrodes was 4 cm2, and that of the photoanode was 2 cm2. Photoirradiation was performed using a 365-nm UV LED (Nitride semiconductor), and a 453-nm blue LED (OptoSupply). The incident photon-to-current conversion efficiency (IPCE) was calculated using the following equation:
The gas products were analyzed using gas chromatography. H2 and O2 were quantified using a GC-8A (Shimadzu) instrument equipped with a molecular sieve 5A and a thermal conductivity detector in an Ar carrier. To quantify CO and CO2, a He carrier was used in a Shincarbon ST column. Hydrocarbons were analyzed using a GC-2014 (Shimadzu) equipped with a GS-CarbonPLOT column, an N2 carrier, and a flame ionization detector. The C2H6 selectivity on a carbon basis was calculated from the production rate of each carbon-containing product (ri) as follows:
The C2H6 Faradaic efficiency (FE) value was calculated from the Faradaic constant (F) as follows:
Results and discussion
The crystal structure of H3PW12O40·nH2O varies depending on the hydration number (n = 6, 14, and 21).32 An edge-shared WO6 shell enclosing the tetrahedrally coordinated phosphorus core, which is Keggin's anion unit (PW12O403−), is surrounded by protonated water layers. XRD analysis revealed no peaks attributed to H3PW12O40·nH2O on the PWA/WO3 photoanodes (Fig. 1b), indicating the high dispersion of H3PW12O40 on the porous WO3 photoanode. All the peaks were attributed to monoclinic WO3 and hexagonal Ti from the felt substrate. The Raman spectra of the PWA/WO3 electrode exhibited small bands of H3PW12O40 at 1011 and 993 cm−1 (Fig. 2), which are assigned to the symmetric and asymmetric stretching of the terminal W![[double bond, length as m-dash]](https://www.rsc.org/images/entities/char_e001.gif) O bond of the Keggin's unit, respectively.33 The other Raman bands are attributed to monoclinic WO3.34 The XRD and Raman results indicate that H3PW12O40 is deposited on the WO3 surface in a highly dispersed state. The SEM observation supports the dispersed state of PWA on the WO3 particles (Fig. S1 in ESI†).
O bond of the Keggin's unit, respectively.33 The other Raman bands are attributed to monoclinic WO3.34 The XRD and Raman results indicate that H3PW12O40 is deposited on the WO3 surface in a highly dispersed state. The SEM observation supports the dispersed state of PWA on the WO3 particles (Fig. S1 in ESI†).
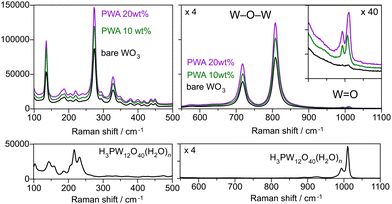 | ||
| Fig. 2 Raman spectra of the WO3 photoanodes with and without the PWA (10 and 20 wt%) coating and H3PW12O40·nH2O crystalline powder. | ||
The functionalized WO3 photoanode and Pt–CB were attached to both sides of an N117 membrane and the prepared membrane electrode assembly was installed in a planar-type stainless-steel reactor with a glass window for irradiation (Fig. 3). The PEM-PEC measurements were performed in a two-electrode system, but the cathode potential is likely close to that of the reversible hydrogen electrode (RHE) because the overpotential for the hydrogen evolution reaction was very small over the Pt–CB electrocatalyst (Fig. S2, ESI†).
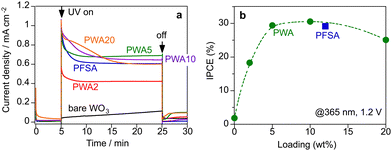
Fig. 4a shows the chronoamperometric data of the PEM-PEC system at a constant bias of 1.2 V under 365-nm UV irradiation (area 2 cm2). The WO3 photoanodes were employed in a continuous Ar flow with ∼3 kPa of water vapour at 26 °C (RH 90%). Humidified Ar flowed into the cathode side. Under this vapour-fed condition (RH 90%), the photocurrent response was negligibly small for the bare WO3 photoanode without a surface electrolyte because proton transfer and transport were sluggish in the absence of a liquid electrolyte. In contrast, surface coating by the Nafion ionomer significantly increased the photocurrent response under vapour-fed conditions. PWA coating also enhanced the vapour-fed PEC performance of WO3 photoanodes. The photocurrent response of PWA/WO3 increased with increasing PWA loading from 2 to 5 wt%. The photocurrents were stable after a steep decay during the initial 10 min. The IPCE was calculated from the steady-state photocurrent density. The IPCE values of PWA/WO3 were maximized at 5–10 wt% loading and decreased slightly at 20 wt% loading (Fig. 4b). At 365 nm, the IPCE of PWA/WO3 was 29%, which was nearly identical to the values obtained for WO3 in a liquid electrolyte (0.1 M H2SO4) at a potential of 1.2 V vs. RHE. Similar IPCE values have been reported for WO3 photoanodes in conventional liquid electrolytes.31,35–37 There was no significant difference in IPCE values between PWA/WO3 and PFSA/WO3 under vapour feeding. This indicates that the PWA acts as a surface electrolyte like PFSA ionomer for the vapour-fed condition.
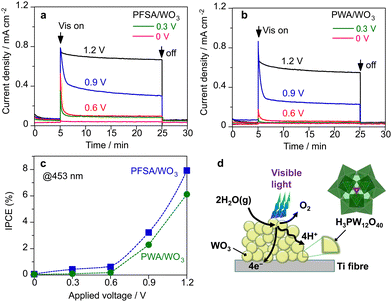
Fig. 5a–c show the effect of applied voltage on the photocurrent response in the PEM-PEC system under visible light (453 nm). Initial decays of the photocurrent were significant when the applied potential was lower than 1.2 V (vs. cathode) for both PWA/WO3 and PFSA/WO3 photoanodes. The photocurrent response at the steady state was diminished below 0.6 V (vs. cathode). This result is consistent with the reported flat band potentials (0.3–0.5 V vs. RHE) for WO3 electrodes.35,38 There was no significant difference between PWA/WO3 and PFSA/WO3 on the applied voltage dependence. These results suggest that the charge separation efficiency is decreased when the potential drop in band bending is decreased at the steady state.
We found that the polyoxometalate loaded on the porous WO3 photoanode acted as a surface electrolyte like PFSA ionomer with proton conductivity. Fig. 5d illustrates the role of PWA in the PEC reaction in the presence of saturated water vapour. In PEC water oxidation, the photogenerated holes promote the oxygen evolution reaction (2H2O → O2 + 4H+ + 4e−) probably through the PCET process. Photoexcited electrons are transported toward the conductive Ti-fibre substrate through the semiconductor particles. In conventional liquid systems, aqueous electrolytes promote proton transfer/transport in the microenvironment of photoanode materials. In contrast, the absence of aqueous electrolytes causes proton transfer and transport to be the rate-determining steps in OER. Therefore, the PFSA ionomer is required as a surface electrolyte to promote proton transfer and transport under vapour-fed conditions.
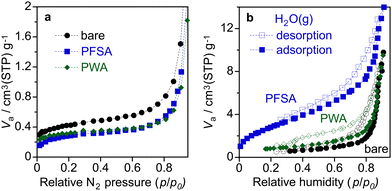
Fig. 6 shows the nitrogen and water vapour adsorption/desorption isotherms of the WO3 electrodes. The BET specific surface area of bare WO3, PWA/WO3, and PFSA/WO3 layers on Ti felt was estimated from the nitrogen adsorption to be 3.6, 2.9, and 2.6 m2 g−1, respectively. The coating of the surface electrolyte slightly reduces the specific surface area of the WO3 particles. In the PEM-PEC cell, one of the roles of PFSA ionomers is considered to be capturing humidity from the moisture air to supply enough water on the photoelectrodes.16,22 As shown in the water vapour adsorption/desorption isotherms, the PFSA/WO3 exhibits larger water uptake than those of bare WO3 and PWA/WO3. The water uptake of the WO3 electrode was slightly increased by the loading of PWA, but the effect was not significant at higher RH regions (p/p0 > 0.8). This result demonstrates that the activity enhanced by PWA is attributable to the proton transport property rather than the capture of the water vapour from humidity.
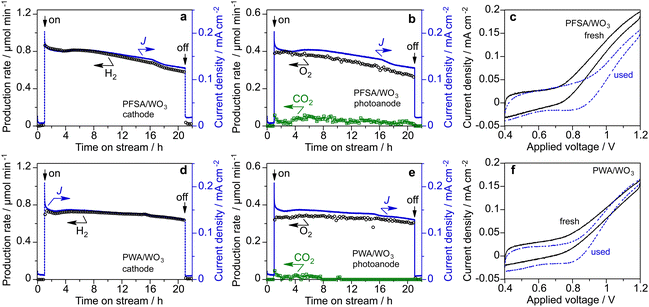
The long-term stability of the PEM-PEC cells with PFSA/WO3 and PWA/WO3 was tested at 1.2 V under 453 nm visible light irradiation (area 16 cm2). Fig. 7 shows the time course of the current density and production rates in the cathode and photoanode compartments in the vapour-fed PEC water splitting. The photocurrent and production rate of PFSA/WO3 gradually decreased, but was relatively stable for PWA/WO3. After 20 h of photoirradiation, dark current was significantly increased for PFSA/WO3. The IPCE value was calculated from the photocurrent density after subtraction of the dark current density when turning off the light. The IPCE of the PWA/WO3 photoanode (2.8%) was higher than that of the PFSA/WO3 photoanode (2.4%) at the 20-h PEC reaction. To further investigate the durability of the photoanodes, we compared the voltammograms before and after long-term PEC reactions (Fig. 7c and f). The photocurrent response of the PFSA/WO3 photoanode was decreased after the stability test, but a significant difference was not observed for PWA/WO3 between the fresh and the used photoanodes. These results indicated that stable water splitting was achieved by the PEM-PEC system using H3PW12O40 as an inorganic solid electrolyte.
The H2 FE was close to 100% on the cathode side. In contrast, the O2 FE was less than 100% probably owing to CO2 formation and dark current (Table S1 in ESI†). However, PWA/WO3 showed an O2 FE of 95%, which was significantly higher than that of PFSA/WO3 (O2 FE of 85%). Continuous CO2 evolution during PEC reactions was observed only for the PFSA/WO3 photoanode. This CO2 production leading to lower O2 FE is assigned to the oxidative decomposition of PFSA ionomer and membrane.15,16
The SEM-EDS analysis revealed that the fluorine content of the PFSA/WO3 photoanode decreased from 36.5 to 18.5 mass% after the PEC reaction (Table S2, ESI†). Therefore, the CO2 production primarily originated from the degradation of the PFSA ionomer coated on the photoanodes. In contrast, the P content (0.3 mass%) did not change during the PEC reaction for the PWA/WO3 photoanode. The phosphorus emission mapping image revealed that the high dispersion of H3PW12O40 on the porous WO3 electrode was maintained even after the reaction (Fig. S3, ESI†). Raman spectra also confirmed the presence of two bands of H3PW12O40 even after the vapour-fed PEC reaction (Fig. S4, ESI†). The long-term stability test was also performed under 385 nm UV light (irradiance 60 mW cm−2, area 2 cm2, Fig. S5, ESI†). After 20 h of reaction, the IPCE of the WO3/PWA photoanode (2.4%) was significantly higher than that of the WO3/Nafion photoanode (0.9%).
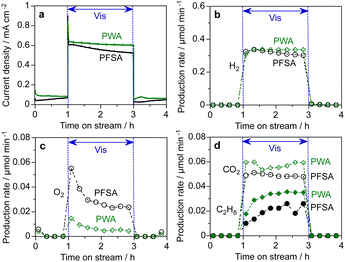
Finally, we employed the PEM-PEC cell for methane conversion reaction under visible light irradiation. Fig. 8 depicts the time course of PEC methane conversion at 1.2 V (vs. cathode). CH4 gas containing water vapour (90% RH) was continuously fed over the WO3 photoanodes. The H2 FE on the cathode side was approximately 100% (Table S3, ESI†). O2, CO2, CO, and C2H6 were formed on the photoanode side. The rate of O2 evolution was markedly reduced by the PWA coating, which enhanced the synthesis of COx and C2H6, as opposed to the PFSA ionomer coating (12 wt%). This suggests that CH4 oxidation is more plausible for the PWA/WO3 than for OER by water splitting. For PWA/WO3, the FEs of CO2, CO, and C2H6 were 71.3%, 9.2%, and 10.5%, respectively (Table S3, ESI†). The increased COx formation rate implies that steam reforming of methane (CH4 + xH2O → COx + (2 + x)H2) is promoted even at 25 °C.24,25,39 C2H6 is formed by CH4 activation, implying the formation of methyl radicals and their coupling reaction.40–43 The activation of the C–H bond of CH4 is believed to be promoted by photogenerated holes and hydroxyl radicals.24,44–47
Conclusions
We found that phosphotungstic acid can function as a novel surface solid electrolyte for WO3 photoanodes in gas-phase PEM-PEC reactions. The H3PW12O40/WO3 photoanode exhibits a photocurrent efficiency as high as that of the porous WO3 photoanode functionalized by PFSA ionomer. The enhanced activity by phosphotungstic acid functionalization is attributed to the proton transport property rather than the water uptake from humidity. In the vapour-fed water-splitting reaction, the H3PW12O40/WO3 photoanode, composed of inorganic materials, was more stable than the photoanode using the organic PFSA ionomer. The H3PW12O40 surface electrolyte was also applied for the gas-phase PEC conversion of methane to ethane and carbon oxides. This study sheds light on the use of surface inorganic electrolytes to develop robust PEM-PEC systems for converting gaseous molecules in the absence of liquid electrolytes.Author contributions
F. Amano: conceptualization, methodology, writing; K. Tsushiro and C. Akamoto: investigation.Conflicts of interest
There are no conflicts to declare.Acknowledgements
This work was supported by the Japan Science and Technology Agency (JST), Precursory Research for Embryonic Science and Technology (PRESTO) (grant numbers JPMJPR15S1 and JPMJPR18T1) and the Japan Society for the Promotion of Science (JSPS), KAKENHI (grant number JP20H02525).Notes and references
- J. I. Guo, Y. C. Zhang, A. Zavabeti, K. F. Chen, Y. L. Guo, G. P. Hu, X. L. Fan and G. K. Li, Nat. Commun., 2022, 13, 5046 CrossRef CAS
.
- T. Suguro, F. Kishimoto and K. Takanabe, Energy Fuels, 2022, 36, 8978–8994 CrossRef CAS
.
- T. Suguro, F. Kishimoto, N. Kariya, T. Fukui, M. Nakabayashi, N. Shibata, T. Takata, K. Domen and K. Takanabe, Nat. Commun., 2022, 13, 5698 CrossRef CAS
.
- J. M. Spurgeon and N. S. Lewis, Energy Environ. Sci., 2011, 4, 2993–2998 RSC
.
- C. Xiang, Y. Chen and N. S. Lewis, Energy Environ. Sci., 2013, 6, 3713–3721 RSC
.
- S. Kumari, R. T. White, B. Kumar and J. M. Spurgeon, Energy Environ. Sci., 2016, 9, 1725–1733 RSC
.
- B. Seger and P. V. Kamat, J. Phys. Chem. C, 2009, 113, 18946–18952 CrossRef CAS
.
- J. Georgieva, S. Armyanov, I. Poulios and S. Sotiropoulos, Electrochem. Commun., 2009, 11, 1643–1646 CrossRef CAS
.
- J. Georgieva, S. Armyanov, I. Poulios, A. D. Jannakoudakis and S. Sotiropoulos, Electrochem. Solid-State Lett., 2010, 13, P11–P13 CrossRef CAS
.
- K. O. Iwu, A. Galeckas, A. Y. Kuznetsov and T. Norby, Electrochim. Acta, 2013, 97, 320–325 CrossRef CAS
.
- J. Rongé, D. Nijs, S. Kerkhofs, K. Masschaele and J. A. Martens, Phys. Chem. Chem. Phys., 2013, 15, 9315–9325 RSC
.
- J. Rongé, S. Deng, S. Pulinthanathu Sree, T. Bosserez, S. W. Verbruggen, N. Kumar Singh, J. Dendooven, M. B. J. Roeffaers, F. Taulelle, M. De Volder, C. Detavernier and J. A. Martens, RSC Adv., 2014, 4, 29286–29290 RSC
.
- F. Amano, A. Shintani, H. Mukohara, Y. M. Hwang and K. Tsurui, Front. Chem., 2018, 6, 598 CrossRef CAS
.
- F. Amano, H. Mukohara, A. Shintani and K. Tsurui, ChemSusChem, 2019, 12, 1925–1930 CrossRef CAS
.
- F. Amano, H. Mukohara, H. Sato and T. Ohno, Sustainable Energy Fuels, 2019, 3, 2048–2055 RSC
.
- F. Amano, H. Mukohara, H. Sato, C. Tateishi, H. Sato and T. Sugimoto, Sustainable Energy Fuels, 2020, 4, 1443–1453 RSC
.
- C. X. M. Ta, C. Akamoto, Y. Furusho and F. Amano, ACS Sustainable Chem. Eng., 2020, 8, 9456–9463 CrossRef CAS
.
- T. Stoll, G. Zafeiropoulos and M. N. Tsampas, Int. J. Hydrogen Energy, 2016, 41, 17807–17817 CrossRef CAS
.
- K. Xu, A. Chatzitakis, E. Vollestad, Q. Ruan, J. Tang and T. Norby, Int. J. Hydrogen Energy, 2019, 44, 587–593 CrossRef CAS
.
- X. L. Kang, L. Chaperman, A. Galeckas, S. Ammar, F. Mammeri, T. Norby and A. Chatzitakis, ACS Appl. Mater. Interfaces, 2021, 13, 46875–46885 CrossRef CAS
.
- M. Caretti, E. Mensi, K. Raluca-Ana, L. Lazouni, B. Goldman, L. Carbone, S. Nussbaum, R. A. Wells, H. Johnson, E. Rideau, J. H. Yum and K. Sivula, Adv. Mater., 2023, 35, 2208740 CrossRef CAS
.
- G. Zafeiropoulos, H. Johnson, S. Kinge, M. C. M. van de Sanden and M. N. Tsampas, ACS Appl. Mater. Interfaces, 2019, 11, 41267–41280 CrossRef CAS
.
- G. Zafeiropoulos, P. Varadhan, H. Johnson, L. Kamphuis, A. Pandiyan, S. Kinge, M. C. M. van de Sanden and M. N. Tsampas, ACS Appl. Energy Mater., 2021, 4, 9600–9610 CrossRef CAS
.
- F. Amano, A. Shintani, K. Tsurui, H. Mukohara, T. Ohno and S. Takenaka, ACS Energy Lett., 2019, 4, 502–507 CrossRef CAS
.
- F. Amano, A. Shintani, T. Sakakura, Y. Takatsuji and T. Haruyama, Catal. Sci. Technol., 2023, 13, 4640–4645 RSC
.
- L. Ghassemzadeh, K. D. Kreuer, J. Maier and K. Müller, J. Power Sources, 2011, 196, 2490–2497 CrossRef CAS
.
- N. Osamu, K. Teruo, O. Isao and M. Yoshizo, Chem. Lett., 1979, 17–18 Search PubMed
.
- P. Staiti, S. Freni and S. Hocevar, J. Power Sources, 1999, 79, 250–255 CrossRef CAS
.
- T. Kukino, R. Kikuchi, T. Takeguchi, T. Matsui and K. Eguchi, Solid State Ionics, 2005, 176, 1845–1848 CrossRef CAS
.
- M. Yamada and I. Honma, J. Phys. Chem. B, 2006, 110, 20486–20490 CrossRef CAS
.
- F. Amano, A. Shintani, K. Tsurui and Y.-M. Hwang, Mater. Lett., 2017, 199, 68–71 CrossRef CAS
.
- U. B. Mioč, M. R. Todorović, M. Davidović, P. Colomban and I. Holclajtner-Antunović, Solid State Ionics, 2005, 176, 3005–3017 CrossRef
.
- C. Rocchiccioli-Deltcheff, M. Fournier, R. Franck and R. Thouvenot, Inorg. Chem., 1983, 22, 207–216 CrossRef CAS
.
- A. G. Souza-Filho, V. N. Freire, J. M. Sasaki, J. Mendes Filho, J. F. Julião and U. U. Gomes, J. Raman Spectrosc., 2000, 31, 451–454 CrossRef CAS
.
- C. Santato, M. Ulmann and J. Augustynski, J. Phys. Chem. B, 2001, 105, 936–940 CrossRef CAS
.
- F. Amano, M. Tian, G. Wu, B. Ohtani and A. Chen, ACS Appl. Mater. Interfaces, 2011, 3, 4047–4052 CrossRef CAS
.
- H. Homura, B. Ohtani and R. Abe, Chem. Lett., 2014, 43, 1195–1197 CrossRef CAS
.
- F. Amano, M. Tian, B. Ohtani and A. Chen, J. Solid State Electrochem., 2012, 16, 1965–1973 CrossRef CAS
.
- W. Li, D. He, G. Hu, X. Li, G. Banerjee, J. Li, S. H. Lee, Q. Dong, T. Gao, G. W. Brudvig, M. M. Waegele, D.-e Jiang and D. Wang, ACS Cent. Sci., 2018, 4, 631–637 CrossRef CAS
.
- B. Kraeutler and A. J. Bard, J. Am. Chem. Soc., 1977, 99, 7729–7731 CrossRef CAS
.
- B. Kraeutler, C. D. Jaeger and A. J. Bard, J. Am. Chem. Soc., 1978, 100, 4903–4905 CrossRef CAS
.
- S. Sato, J. Phys. Chem., 1983, 87, 3531–3537 CrossRef CAS
.
- T. Sakata, T. Kawai and K. Hashimoto, J. Phys. Chem., 1984, 88, 2344–2350 CrossRef CAS
.
- H. Tateno, S. Iguchi, Y. Miseki and K. Sayama, Angew. Chem., Int. Ed., 2018, 57, 11238–11241 CrossRef CAS
.
- J. Ma, K. K. Mao, J. X. Low, Z. H. Wang, D. W. Xi, W. Q. Zhang, H. X. Ju, Z. M. Qi, R. Long, X. J. Wu, L. Song and Y. J. Xiong, Angew. Chem., Int. Ed., 2021, 60, 9357–9361 CrossRef CAS
.
- A. Mehmood, S. Y. Chae and E. D. Park, Catalysts, 2021, 11, 1387 CrossRef CAS
.
- F. Amano and M. Ishimaru, Energy Fuels, 2022, 36, 5393–5402 CrossRef CAS
.
Footnote |
| † Electronic supplementary information (ESI) available. See DOI: https://doi.org/10.1039/d3ya00568b |
| This journal is © The Royal Society of Chemistry 2024 |

