 Open Access Article
Achieving controllable and reversible snap-through in pre-strained strips of liquid crystalline elastomers†
James T.
Waters
 and
Anna C.
Balazs
 *
*
University of Pittsburgh, Department of Chemical and Petroleum Engineering, USA. E-mail: balazs@pitt.edu
First published on 19th March 2024
Abstract
Deformable, elastic materials that buckle in response to external stimuli can display “snap-through”, which involves a transition between different, stable buckled states. Snap-through produces a quick release of stored potential energy, and thus can provide fast actuation for soft robots and other flexible devices. Liquid crystalline elastomers (LCEs) exposed to light undergo a phase transition and a concomitant mechanical deformation, allowing control of snap-through for rapid, large amplitude actuation. Using both a semi-analytical model and finite element simulations, we focus on a thin LCE strip that is clamped at both ends and buckles due to an initially imposed strain. We show that when this clamped, strained sample is exposed to light, it produces controllable snap-through behavior, which can be regulated by varying the light intensity and the area of the sample targeted by light. In particular, this snap-through can be triggered in different directions, allowing the system to be reset and triggered multiple times. Removing the light source will cause the system to settle into one of two stable states, enabling the encoding and storage of information in the system. We also highlight a specific case where removing the light source removes the induced buckling and returns the material to an initially flat state. In this case, the system can be reset and form a new shape, allowing it to function as a rewriteable haptic interface.
I. Introduction
Soft elastic materials that undergo a reversible buckling can display “snap-through”, which involves a transition between stable buckled states. The occurrence of snap-through is highly desirable for a range of applications since this mechanism can magnify the response of the system to external stimuli and prompt the rapid release of stored potential energy. The latter attributes are beneficial for fast actuation in devices1 and soft robots.2,3 Liquid crystalline elastomers (LCEs) can display snap-through when exposed to an external source of heat or light, as experimentally demonstrated in the thermal actuation of curved LCE surfaces,4 and pre-strained thin LCE strips under low illumination.5,6 In LCEs containing nematically aligned mesogens, the imposed heat or light triggers a transition from the ordered nematic (N) to disordered isotropic (I) state. This N–I transition has a pronounced effect on LCE micro-pillars anchored to a surface where increasing the light intensity can generate a traveling wave of N–I transitions, which can propagate through the entire width of the sample, and thus produce a time-dependent variation in the relative size of the nematic and isotropic regions.7 Concurrently, the wave of N–I transitions triggers a wave of mechanical deformation. When the entire face of the LCE post is illuminated, this propagating opto-mechanical response drives the whole post to dynamically bend, turn, twist and display “dance-like” movements.8,9 For practical applications, however, it could be useful to localize the light-induced deformations and thus form, for example, bendable joints or hinges between stiff sections, analogous to the control over buckling afforded by pneumatic vasculatures10 in other materials. Using a combination of modeling approaches, we vary the width of the aperture controlling the amount of light that hits the surface of a clamped sample. In this way, we localize the N–I phase transition to certain regions and attain spatiotemporal control over the buckling in the material. Furthermore, we find a specific range of aperture sizes that actuate the desired snap-through and thus are ideal candidates for soft actuators.We initially focus on a free (unclamped) LCE strip, in the absence of light to obtain a frame of reference for the more complex scenarios considered here. (In the case of the free strip, the strip's center of mass is fixed, but there is no constraint on the free ends, other than remaining in the x–y plane). We then systematically analyze the behavior of this free strip in the presence of light and similarly, determine the behavior of the clamped strip with and without illumination. As discussed below, these studies reveal that illuminating a clamped sample induces a curvature that varies non-monotonically with the light intensity. Additionally, we find that the illuminated, buckled strip will encompass both positively and negatively curved regions along its length, leading to a non-trivial dependence of the snap-through behavior on characteristics of the light. Moreover, we find that the specific buckling response can be controlled by tailoring the interaction between a curvature induced by the initial strain (compression) and a curvature induced by the light.
The presence of both positive and negative curvature noted above proves to be of particular benefit for technological applications. Targeting these specific regions with light permits a contact-free reversal of the snap-through, enabling the strip to buckle in either an upward or downward direction. Buckling in this upward or downward state remains stable when the light is removed. Viewing the up or down state as a separate bit (e.g. as a one or a zero) the system can be used to record and store information via the buckled state. The message can be rewritten with the new application of light. This setting and resetting capability is a necessary step in using snap-through in elastic systems for digital logic.11
Programming arbitrary director fields into LCEs can be accomplished via a magnetic field during cross-linking.12 The induced alignment enables not only the snap-through of LCE's under an initial strain, but also the introduction of strain and buckling to initially flat structures. The reversibility and control of such a system would have clear applications for a haptic interface device.13,14
II. Methods
To avoid confusion, in the subsequent discussion, we use the word “strip” to refer to the material and the word “beam” to refer to the light. Our analysis of this system proceeds on two tracks. The first is a finite element model we have previously used to explore liquid crystalline elastomer systems,9 and which we have validated against experimental results.8,12 This model can be used to predict the response of LCE films to light or changes in temperature as a function of the light intensity and position, as well as the features of the LCE device such as thickness, length, and director orientation. Additionally, this model can be used to establish the general effect of these parameters on length, thickness, and curvature changes, which can be used to inform a semi-analytical model that can predict the buckled shapes of the elastomer, more quickly exploring the parameter space than the finite element simulations alone.A. Finite element simulations
Our finite element method describes the interaction of bulk and shear deformations in terms of a free energy using the Gent hyperelastic model, along with a strain–nematic coupling. The elastic terms are given as | (1) |
The strain–nematic coupling is an additional free energy term that connects the deformation gradient tensor in the material frame to the orientation of the nematic director that is hard-coded into the material. This coupling is proportional to the change in order parameter, causing the material to contract along the axis of the nematic director and expand along the orthogonal axis when it transitions from a nematic state to a less ordered isotropic state (αΔS < 0).
 | (2) |
 | (3) |
 | (4) |
The coordinates of the finite element mesh are updated in time using a leapfrog integration method, with accelerations derived from the gradient of the free energy with respect to the mesh coordinates. Alternating between each of these mesh updates, the isomerization at each node is also updated. This is done by calculating the light path through the material to each point, using the current mesh coordinates, and applying an attenuation based on the opacity stored for each element at that point in time to obtain the intensity at the mesh points.
B. Semi-analytical model
The space of possible parameters for finite element simulations can be more quickly covered if we develop a semi-analytical model that attempts to capture the bending energy of elastic strips under compression. This will pare away the precise details of deformation of the liquid crystalline elastomer and give us a simplified view, which we can use to quickly predict the behavior of the bending strip throughout a multivariable parameter space.Here, we describe the shape of the strip in terms of a deflection angle θ away from the x-axis, as a function of the longitudinal coordinate α in the material frame. Here we have normalized this coordinate to run from 0 to 1 over the length of the strip. This will make it simpler to describe the bending energy as a function of the change in this coordinate, the trade-off being that it becomes more complicated to impose boundary constraints that are measured in Cartesian laboratory frame coordinates. The energy is assumed to be quadratic in terms of the change in deflection, and scaled by a bending moment that can vary along the length of the strip.
 | (5) |
 | (6a) |
 | (6b) |
 | (7) |
 | (8) |
θ(α) = A![[thin space (1/6-em)]](https://www.rsc.org/images/entities/char_2009.gif) sin(ωα + ϕ) + C sin(ωα + ϕ) + C | (9) |
For a strip that has a piecewise constant thickness, we can apply the solution in eqn (9) to the different regions; the undetermined multipliers will be constant between the regions, allowing us to determine the ratio of the wavelengths.
θL(α) = AL![[thin space (1/6-em)]](https://www.rsc.org/images/entities/char_2009.gif) sin(ωLα + ϕL) + C sin(ωLα + ϕL) + C | (10a) |
θR(α) = AR![[thin space (1/6-em)]](https://www.rsc.org/images/entities/char_2009.gif) sin(ωRα + ϕR) + C sin(ωRα + ϕR) + C | (10b) |
 | (11) |
 | (12) |
The partial isomerization and variation in the nematic director can both introduce an intrinsic curvature to the strip that will be evident in the absence of any constraints at the end. This curvature will manifest in the Lagrangian as a constant offset for the quadratic bending energy
 | (13) |
 | (14) |
The stability of these states can be predicted through a discretization of the system into one-dimensional elements and computing the Hessian matrix from the second derivatives, as discussed in ref. 6. While the bending moment and induced curvature can vary stepwise between the illuminated and non-illuminated regions in the continuous model, we find it is necessary to introduce an interpolated, and therefore differentiable, value of the curvature and bending moment for elements crossing the light boundary. Without considering this contribution to the change in free energy with respect to position, the system cannot correctly predict the occurrence of snap-through behavior.
III. Results
As detailed below, light gives rise to a propagating isomerization front as it passes through the material and produces a gradient in the local nematic ordering in the sample. The latter gradient exerts a strain that induces curvature in the strip. If the strip is clamped at both ends, the system will manifest additional curvature due to the buckling arising from the strain at the fixed ends. Varying the balance between these two sources of bending produces a range of the unusual non-monotonic behavior described in the following sections.A. Behavior of unclamped LCE strip
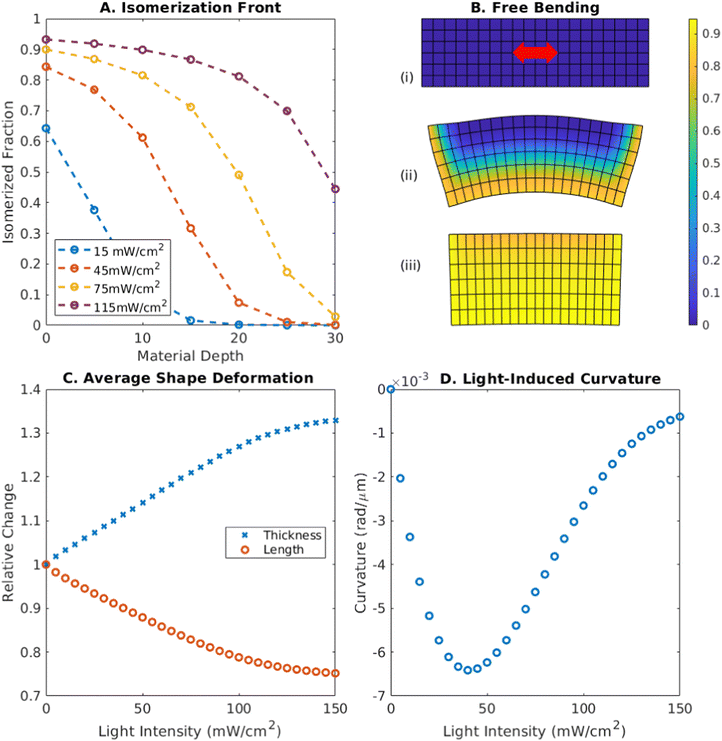
Focusing on a free (unclamped) elastic LCE strip, we determine the effect that varying the intensity of the applied light has on other variables, such as length, thickness, and induced curvature that dictate the buckled shape of the strip (Fig. 1A–D). In the systems considered here, the LCE contains photo-responsive azobenzenes; the material undergoes isomerization as the applied light excites the trans isomers in the azobenzenes into the cis state. The degree of isomerization determines the opacity of the material (i.e., the penetration depth); Fig. 1A shows how the degree of isomerization falls off as a function of depth in a free segment of an LCE strip for different light intensities at late times. The degree of isomerization also dictates the change in the nematic order parameter, ΔS, within the material. Here, ΔS to assumed to be proportional17 to the fraction of the azobenzenes in the excited, cis state, nc = (1 − nt), where nt is the fraction in the trans state.For a nematic director uniformly oriented along the long axis of the LCE, an illuminated strip will contract along this axis and expand along the orthogonal axes, and thus, the sample becomes shorter and thicker; Fig. 1C shows how the length of the material decreases and the thickness increases as a function of light intensity. (In these simulations, we constrained the expansion of the material along the third axis, out of the plane of the page in the figure.) At high intensity, the thickness approaches 1.33× its initial value, while the length contracts to 0.75× its original value. The bulk modulus of the material is assumed to be significantly larger than the shear modulus of the material, (K = 28 MPa, μ = 570 kPa, eqn (1)), maintaining the volume within 1% of its value in the initial, unstressed state. These values and the strain–nematic coupling in eqn (2) correspond to experimentally measured parameters for LCE materials.8,12
When the change in order parameter varies through the thickness of the material, the system exhibits an induced curvature, as depicted in Fig. 1B, where the color bar indicates the degree of isomerization (which is proportional to the change in nematic order parameter) from 0 (blue) to 1 (yellow). The exposed face contracts while the non-illuminated face retains its original length and the ends of the strip bend towards the light. Fig. 1D shows how the magnitude of this curvature varies with light intensity. At low intensity, the order parameter varies only slightly across the material and so the deformation is small (Fig. 1B(i)). At high intensity, the change in the order parameter is large, but approaches a constant value through the material, causing it to contract but not bend (Fig. 1B(iii)). The curvature is greatest at intermediate intensities (Fig. 1B(ii)), where isomerization is significant on one side of the strip and less on the other side. The maximum value of the bending achieved for this thickness is 6.4 × 10⁻³ rad μm−1 at an intensity of 40 mW cm−2.
B. Behavior of clamped, pre-strained LCE strip and appearance of snap-through
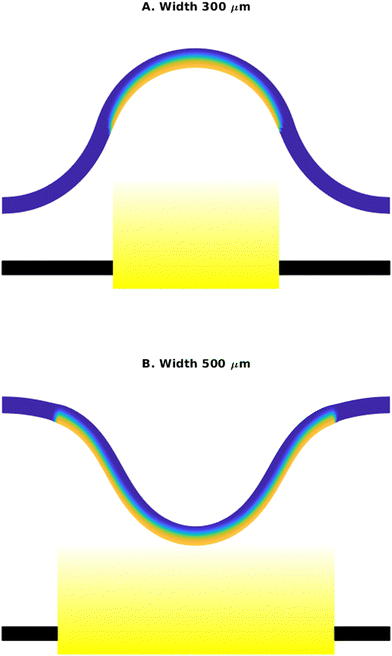
To probe this behavior, we fix the light intensity at 45 mW cm−2 and examine the system's response at two different aperture widths. The values of the other parameters are fixed as follows: the initial strain of (L0 − L)/L0 = 0.3; strip thickness 30 μm; and relaxed length 1 mm. Fig. 2 shows the shapes of the buckled strip that were obtained with the finite element simulations for a light intensity 45 mW cm−2 and aperture widths of 0.3 mm (Fig. 2A) and 0.5 mm (Fig. 2B). In both cases, the strip was initially buckled downward, towards the light source. The initial configuration was obtained by applying the initial strain and allowing the system to relax in the nematic state, without any phase change (i.e., no light). The colors reveal the degree of isomerization, as indicated by the color bar in Fig. 1B, where blue corresponds to the unexcited trans state and yellow to the excited cis state. For this intensity, the exposed face of the strip undergoes a nematic–isotropic transition, while the side of the strip not exposed to the light remains non-isomerized. For an aperture width of 0.3 mm (30% of the relaxed length) the strip, initially buckled towards the light, then exhibits a snap-through away from the light. For a wider aperture (0.5 mm), however, the elastomer remains buckled towards the light (Fig. 2B).
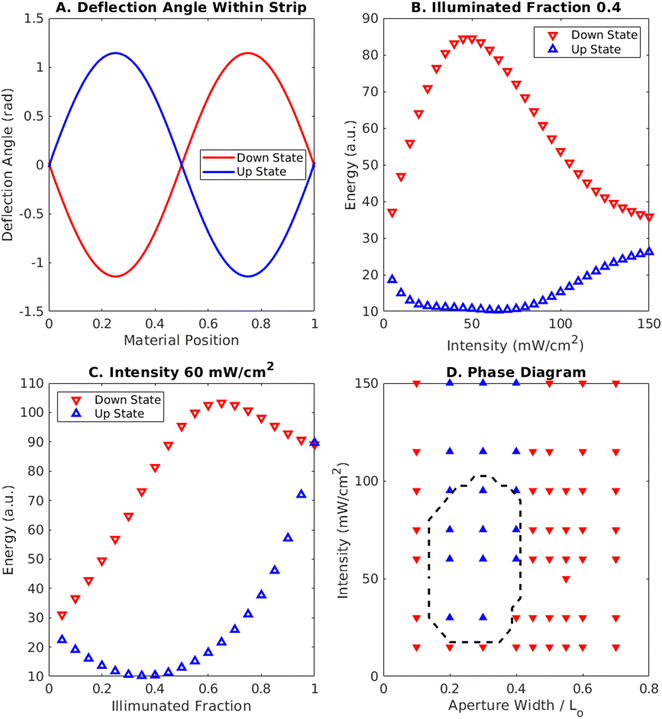
The semi-analytical model indicates that in the presence of a light source, buckling away from the light is energetically favorable for all cases, as seen in Fig. 3B and C. Fig. 3B displays the energy of the up and down states predicted from the semi-analytical model as function of light intensity for an aperture width of 400 μm, marked with open triangles. At low intensities, both states have some buckling energy associated with the initial imposed strain. As the intensity and light-induced curvature increases, the energy of the upward-buckled state decreases because the light-induced curvature (arising from the phase change on the illuminated face of the strip) and curvature due to the initial compressive strain have the same sign at the center of the strip. Thus, both the applied light and strain favor the same direction of buckling. The energy of the downward-buckled state, however, increases because the light induced curvature (see Fig. 2B) is opposite in sign to the initial strain-induced curvature. At high intensities, the difference between the two states decreases again as the light-induced curvature (Fig. 1D) decreases in magnitude. This difference between states is accompanied by a corresponding energy released during snap-through. By computing the free energy in the finite element mesh from eqn (1) and (2) before and after snap-through, we estimate this release to be approximately 3 mJ cm−3 across a range of intensities (ESI,† Fig. S1).
We now fix the light intensity at 60 mW cm−2 and vary the aperture width to obtain the plot in Fig. 3C, which shows the predicted energy of the two states as a function of the illuminated fraction at a fixed intensity. For the upward buckled state, the light-induced curvature in the middle of the strip works cooperatively with the curvature from the initial strain, reducing the free energy. When the illuminated area expands further from the center, the strain-imposed curvature changes in sign, as can be seen by comparing the bending near the clamped ends in Fig. 2A and B. Consequently, the bending energy for the upward state increases, as shown by the blue triangles in Fig. 3C near an illuminated fraction of 0.5.
For the downward buckled state, however, the trend is reversed, where the light-induced curvature (Fig. 2B) works against the strain-imposed curvature at the center, but cooperatively towards the edges. As more of the strip is illuminated, the difference between the two states decreases and they converge on a higher energy than the unilluminated strip. While some energy is relieved by the average contraction, more is introduced by the light induced curvature at this intensity.
C. Phase diagram for system and stability of the different buckled states
Despite the fact that the upward buckled state has a lower free energy across all parameters, if the strip is initially buckled towards the light, then the system can become trapped in a non-equilibrated state that has a higher free energy than the upward buckled state for a specific range of intensities and aperture widths. Using the same initial conditions with the strip buckled downwards, we constructed a phase diagram mapping the final state as a function of the light intensity and aperture width in Fig. 3D. The data from the finite element simulations are marked by the filled triangles: red, filled downward pointing triangles represent finite element simulations where the strip remained buckled towards the light (downwards), whereas the blue filled upward triangles correspond to cases where snap-through occurred.The black dashed line encloses the region where the upward buckled state is stable, as predicted by the semi-analytical model. Note the good agreement between this region and the snap-through region observed in the finite element simulations (marked by filled triangles). This unstable region forms an island that is bounded above and below for values of both aperture width and light intensity parameters. The plot indicates the light intensity and aperture width must be neither too low nor too high to induce instability in the structure.
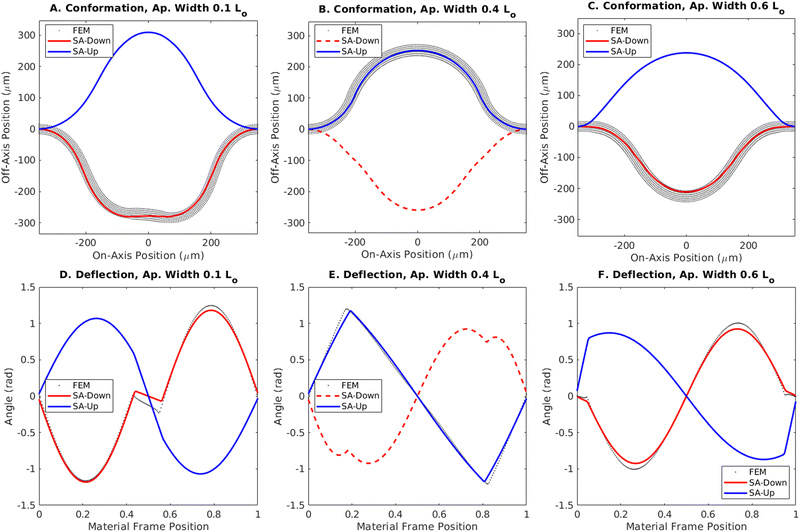
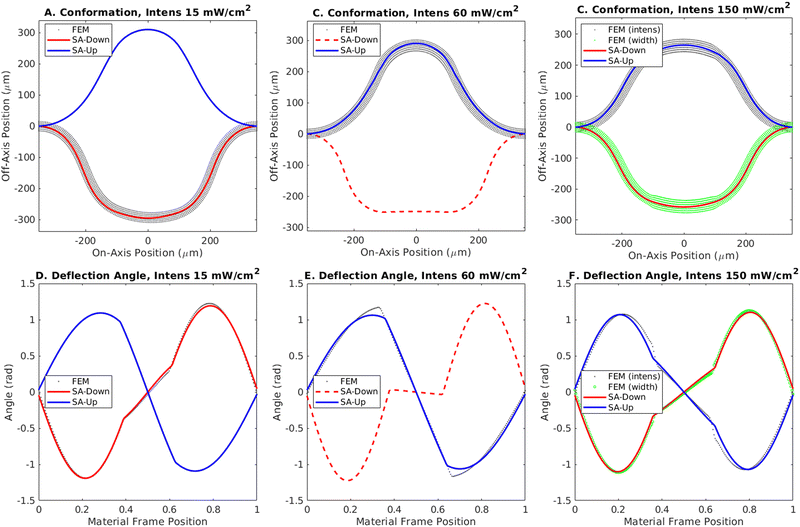
The behavior in Fig. 4A can be understood by looking at the deflection angle along the length of the elastomer in Fig. 4D. For the clamped boundary conditions, this angle follows a sine function through a full period, encompassing areas of both positive and negative curvature. The curvature is defined by the derivative of this deflection angle along the length of the material. For the upward buckled state (drawn in blue), the negatively curved region lies in the middle of the simulated strip. Conversely, for the downward buckled state (in red), the negatively curved region lies at the edges.
The plot in Fig. 4D indicates that when a small region in the middle of the strip is illuminated, the downward curvature induced by the light causes a jump in the derivative of the deflection angle, along with an increased wavelength caused by the increased bending moment. This behavior makes the boundaries of the illuminated region identifiable by cusps in the angle distribution, separating the regions with and without light-induced curvature. This change, however, is not sufficient to reduce the potential energy barrier between states and the simulated strip remains in the downward buckled state, near the semi-analytical prediction for these parameters.
As the area of incident light is increased to 400 μm (centered over the middle of the strip) (Fig. 4B and E), the energy difference between the two states grows larger (Fig. 3C) and the downward buckled state becomes unstable (red line, dashed to indicate instability). The system involving this larger aperture displays essentially the same change in the bending moment and induced curvature as in the narrow aperture case, but here the induced curvature at the edges of the strip (see Fig. 2) promotes the snap through from the downward state. Additionally, the difference in wavelength between the illuminated and unilluminated regions is most readily apparent here in the unstable downward buckled case, where the quarter wavelength in the unilluminated region can be seen in the separation from the edge to the local minimum on one side of the cusp, giving a wavelength 0.56L, where L is the relaxed length of the strip. On the other hand, the half wavelength in the thicker illuminated region can be found from the separation of the minimum and maximum points between the cusps, exhibiting a wavelength of 0.90L. The same ratio of wavelengths, computed to be 0.62, will exist across different aperture widths and for both upward and downward buckled states for this illumination; however, it will be difficult to discern when either the illuminated or unilluminated region is too small to exhibit a local extremum.
At even larger illumination widths (600 μm in Fig. 4C and F), the light covers more than half a period of the deflection angle, meaning it covers regions of both positive and negative curvature in either the upward or downward buckled case. Here, the induced curvature at the edges of the strip works against the snap-through from the downward state, rather than promoting it (as in Fig. 4B), and the downward buckled state is once again stable, as in the narrow aperture case in Fig. 4A. The reoccurrence of bistability correlates with the decrease in energy between the two states predicted as the illuminated width encompasses the entire strip in the semi-analytical model as seen at the right of Fig. 3C.
At low intensity (15 mW cm−2) in Fig. 5A and D, the light does not induce enough curvature or relieve enough strain to overcome the energy barrier and the finite element simulation follows the red, downward-buckled curve obtained from the semi-analytic model. At intermediate intensity (60 mW cm−2) in Fig. 5B and E, the light-induced curvature creates a sufficiently strong bias to tip the system into the upward-buckled state (blue curve). At still higher intensity in Fig. 5C and F, the finite element simulation again shows snap through, even though the state buckled downwards, towards the light, is predicted to be once again stable in the phase boundary obtained from the semi-analytical model (Fig. 3D).
Beginning from an unilluminated, nematic state, high intensity light will induce snap through as the system passes through a partially isomerized state, as denoted by the blue triangles outside the phase boundary in Fig. 3D. Beginning from the nematic state, however, causes the finite element simulation to pass through a partially isomerized state that is unstable, inducing snap through (grey conformation). Beginning from uniform illumination and narrowing the aperture causes the regions at the edges to relax from an isomerized, isotropic state back to the nematic state, keeping the strip in the downward buckled state (green conformation). The resulting shape and deflection angle is plotted in Fig. 5C and F, respectively.
Notably some cases in Fig. 4 and 5 show a discrepancy between the predictions from the finite element simulations and the semi-analytical model The reason for these differences is discussed further below.
D. Dynamic trajectory to snap-through state
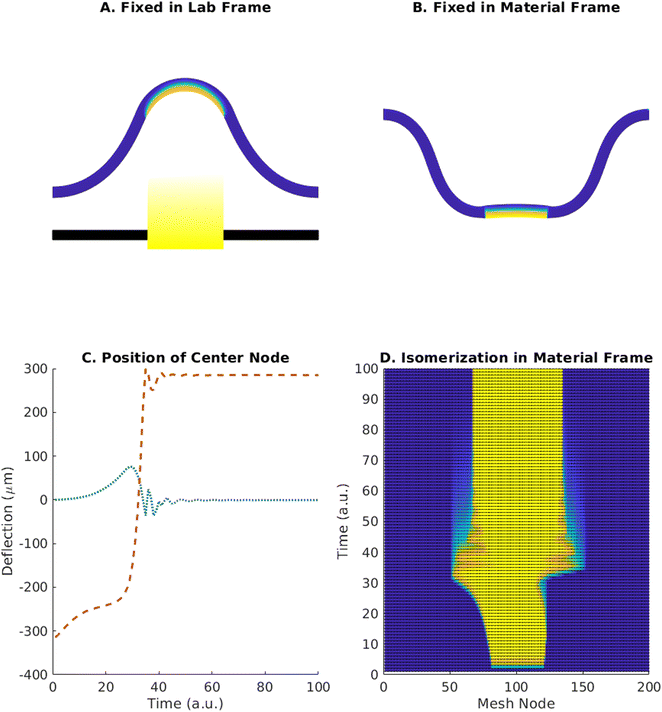
For the strain values studied here, we find that while both upward and downward buckled states are symmetric about the vertical axis, the snap-through trajectory between these states is asymmetric. Tracking the coordinates of the buckling strip in the finite element simulations reveals that the middle of the strip translates to one side concurrently with the vertical motion. Furthermore, stability predictions from the semi-analytical model suggest that cases where only a specific section of the strip can undergo isomerization will yield different behavior than cases where the isomerized regions can shift and grow with time. In particular, such cases, where the phase-change is confined to regions in the material frame by patterning during fabrication, (as in dual-phase nematic elastomers),18 do not display the same snap-through behavior exhibited by the cases in the preceding results where isomerization was localized in the lab frame by an aperture.We test this hypothesis via finite element simulations and confirm that cases where isomerized regions can grow and shift produce snap-through, whereas restricting the isomerization to specific elements traps the system in its initial state. Fig. 6A and B show the final states of these two different realizations for an initial strain of 0.3, intensity 60 mW cm−2, and active region of width 200 μm determined by aperture width or material properties. These results reveal that an essential part of the mechanical instability that leads to snap through is the dynamic change in the area of the phase transition; the strip shifts slightly, changing which regions are isomerized by light, and thus inducing further deformation.
This result implies that the curvature and contraction induced by light must encompass time-dependent behavior to induce snap-through. In particular, Fig. 6C shows the trajectory of the finite element mesh node at the center of the strip as a function of time for the simulation producing Fig. 6A. The middle of the strip swings to one side in the horizontal direction, immediately prior to the rapid switching in the vertical position. The strip then settles back into a symmetric shape. Fig. 6D displays the isomerization as a function of time for the nodes on the surface of the mesh closest to the light. The illuminated region occupies the same width in the lab frame but shifts and grows in the material frame during the snap through.
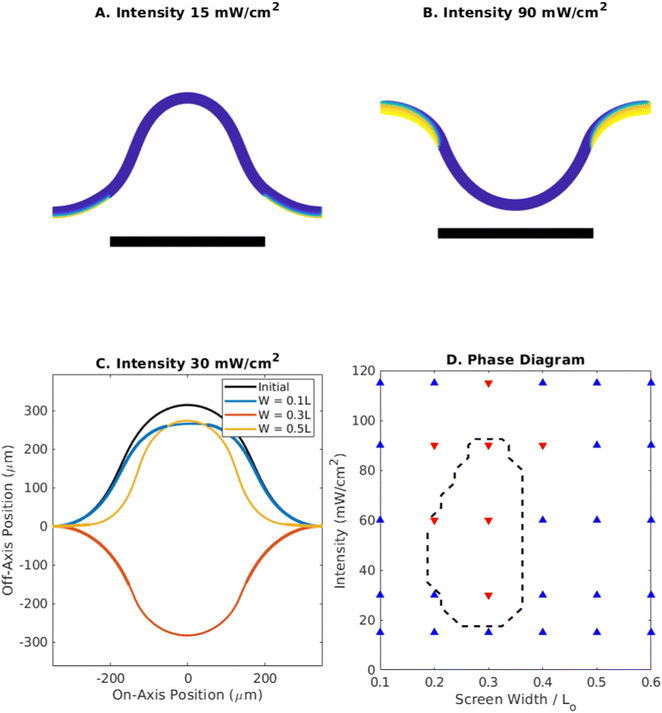
After producing snap-through in one direction, the system can be reset without mechanical contact by altering the illuminated region via a photomask or screen. Making use of the fact that the curvature at the edges has the opposite sign of the curvature in the middle, we show that directing light at the edges of the strip can induce snap-through in a strip buckled away from the light, causing it to move towards the light. As shown in Fig. 7, this snap-through exhibits behavior similar to that for the case of photophobic snapping induced by centered light in Fig. 3–5. The black bars in Fig. 7A and B represent a screen which blocks the light from hitting the central region of the strip. Fig. 7A depicts the final states of the finite element simulation for a screen width of 400 μm at intensities of 15 mW cm−2 and 90 mW cm−2, under an initial strain of 0.3. At the lower intensity, the system remains buckled away from the light, but at the higher intensity, it snaps through towards the light. This demonstrates how increasing light above a certain threshold is necessary to overcome the energy barrier, analogous to Fig. 5.
Fig. 7C shows the sensitivity of the snap-through phenomenon to the width of the screen blocking the central region from light. As with the aperture width in Fig. 4, this screen width must be neither too small nor too large. At a constant intensity of 30 mW cm−2, initial strain 0.3, and a screen width of 500 μm, when only the edges are illuminated, the change is insufficient to induce snap-through. At 300 μm, the downward curvature induced by the light is enough to overcome the upward curvature at the edges and cause the system to transition. At 100 μm, most of the strip is illuminated and the competing interactions of the induced curvature with the varying curvature within the elastomer prevents it from snapping through.
The data collected from these simulations is plotted as a phase diagram in Fig. 7D (similar to Fig. 3D), illustrating the range of light intensity and screen width that can induce snap through in the opposite direction. The dashed line delineates the stable boundary predicted by our semi-analytical model. It should be noted that while snap-through away from the light can be triggered for pinned boundary conditions, where the angle at the ends of the strip is unconstrained, reversing the behavior in the manner described above requires the curvature of the strip to take on both positive and negative values along its length, which only occurs for the clamped boundary case.
E. Buckling in initially flat strips
A number of fabrication schemes exist for LCE systems, which determine the orientation of the nematic director within the material via mechanical alignment,19 shear flow,20 surface alignment,21 or direct ink writing.22 Our model system involves the use of a magnetic field during cross-linking to align the director, decoupling this orientation from the spatial dimensions of the system.12With the nematic director oriented orthogonal to the long axis of the strip, the strip will assume a flat geometry in the absence of light and increase in length under illumination (rather than contract as in Fig. 1). The increase in length for this geometry under illumination introduces strain when the ends are fixed, and can induce buckling in a thin clamped strip that is flat in the nematic state. Fig. 8 shows how length and curvature vary for this geometry, in contrast to the director orientation along the strip in Fig. 1. In Fig. 8A, the length along the strip grows with respect to intensity. This reconfiguration is accompanied by the strip growing thinner, becoming easier to bend as it extends. The height contraction and length expansion reflect the rotation from Fig. 1B, with the length increasing by a factor 1.34× at high intensities and the height contracting by 0.74×.
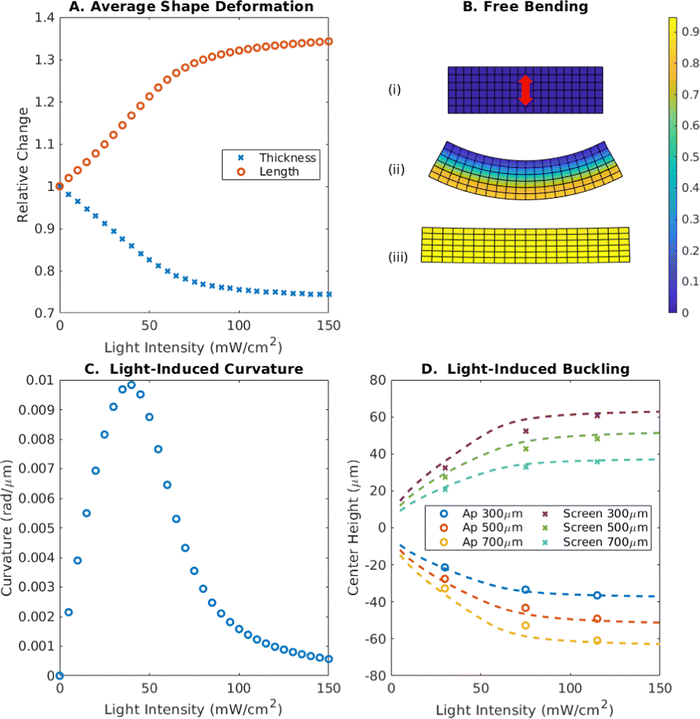 | ||
| Fig. 8 Free LCE as a function of light intensity for orthogonal orientation of director. (A) Average length and height change through the thickness of the material versus intensity. Length increases by a factor of 1.34 at high intensity, with thickness decreasing by a factor 0.74. (B) Resulting conformations for zero intensity, intermediate intensity (45 mW cm−2) and high intensity (150 mW cm−2). Color indicates the degree of isomerization from 0 (blue) to 1 (yellow). At intermediate intensity, the expansion of the strip along the long axis and contraction along the thickness causes bending away from the light. At high intensity, this bending decreases. (C) Curvature induced in the LCE strip as a function of intensity. The induced curvature has the opposite sign versusFig. 1D. The maximum value attained is 9.8 × 10⁻³ rad μm−1 at an intensity of 40 mW cm−2. (D) Center deflection as a function of intensity for different illuminated areas at the center and edges. Circles and crosses represent finite element simulations for different aperture and screen widths, respectively, while dashed lines correspond to predictions from the semi-analytical model. In all cases, increasing the illuminated area and increasing the light intensity led to an increase in the amplitude of the deflection. | ||
Furthermore, the induced curvature shown in Fig. 8B is away from the origin of the incident light, as the illuminated face increases in length by a greater amount than the opposite side of the material. This behavior reverses the sign of the induced curvature relative to that found in Fig. 1D, but displays similar qualitative behavior, first increasing then decreasing in magnitude as the isomerization front moves through the thickness of the material. The magnitude of this curvature is greater than that in Fig. 1, as the phase transition also makes the strip thinner and easier to bend as it progresses, achieving a maximum value of 9.8 × 10⁻³ rad μm−1 at an intensity of 40 mW cm−2.
Fig. 8D shows the deflection of the center of the film as a function of light intensity, for different areas of illumination. The plot reveals the amplitude of the deflection increases monotonically with intensity, and with the area of illumination. The direction of the deflection is dictated by whether the center or the edges of the strip are illuminated: in the absence of an initial strain, center illumination will produce buckling downwards towards the light in this geometry (circles) while edge illumination will produce buckling upwards (crosses), away from the light. Removing the light will allow the strip to return to its initial flat state.
IV. Conclusions
Snap-through of elastic systems under confinement enables the quick release of stored potential energy, permitting fast, large-amplitude actuation from the response of liquid crystalline elastomers. While this buckling can occur in different directions under physically symmetric conditions, either up or down, the direction can be controlled when the symmetry is broken by an external light source. This control can depend non-trivially on several different parameters, namely the intensity and position of the incident light. Both the curvature and contraction induced by the non-uniform phase transition dictate the energy difference between states and the barrier between these states. As the curvature of the buckled strip is non-uniform, the behavior is dependent upon where along the length any curvature change caused by light actually occurs.Using two numerical methods in concert, we map a phase diagram predicting what range of intensities and beam widths can induce a transition between buckled states. By altering these parameters, snap-through in different directions can be achieved, allowing the system to be reset and triggered multiple times. Removing the light source will cause the system to settle into one of two stable states, storing information about the light stimulus.
When the director is oriented orthogonal to the long axis of the LCE strip, the nematic–isotropic transition will cause the strip to increase length, introducing additional strain rather than relieving it. This behavior can induce buckling in an initially flat strip. If the transition is localized via light, the direction of this buckling can be controlled by inducing curvature towards the light either at the ends or the center of the strip. Removing the light source will remove the buckling in this case, resetting the system for the formation of a new shape and allowing it to function as a rewriteable haptic interface.
Author contributions
J. T. W. performed the simulations and analyzed the data. J. T. W. and A. C. B. conceived the project and wrote the manuscript. A. C. B. supervised the work.Conflicts of interest
There are no conflicts of interest to declare.Acknowledgements
A. C. B. gratefully acknowledges funding US Army Research Office under Award W911NF-17-1-0351 for efforts on developing the theoretical model and DOE under Award DE-SC0005247 for the development of the computational model. This research was supported in part by the University of Pittsburgh Center for Research Computing, RRID:SCR_022735, which is supported by NSF award number OAC-2117681.References
- P. Rothemund, A. Ainla, L. Belding, D. J. Preston, S. Kurihara, Z. Suo and G. M. Whitesides, A Soft, Bistable Valve for Autonomous Control of Soft Actuators, Sci. Robot., 2018, 3(16), eaar7986, DOI:10.1126/scirobotics.aar7986.
- W.-K. Lee, D. J. Preston, M. P. Nemitz, A. Nagarkar, A. K. MacKeith, B. Gorissen, N. Vasios, V. Sanchez, K. Bertoldi, L. Mahadevan and G. M. Whitesides, A Buckling-Sheet Ring Oscillator for Electronics-Free, Multimodal Locomotion, Sci. Robot., 2022, 7(63), eabg5812, DOI:10.1126/scirobotics.abg5812.
- D. Yang, B. Mosadegh, A. Ainla, B. Lee, F. Khashai, Z. Suo, K. Bertoldi and G. M. Whitesides, Buckling of Elastomeric Beams Enables Actuation of Soft Machines, Adv. Mater., 2015, 27(41), 6323–6327, DOI:10.1002/adma.201503188.
- D. S. Kim, Y.-J. Lee, Y. B. Kim, Y. Wang and S. Yang, Autonomous, Untethered Gait-like Synchronization of Lobed Loops Made from Liquid Crystal Elastomer Fibers via Spontaneous Snap-Through, Sci. Adv., 2023, 9(20), eadh5107, DOI:10.1126/sciadv.adh5107.
- M. R. Shankar, M. L. Smith, V. P. Tondiglia, K. M. Lee, M. E. McConney, D. H. Wang, L.-S. Tan and T. J. White, Contactless, Photoinitiated Snap-through in Azobenzene-Functionalized Polymers, Proc. Natl. Acad. Sci. U. S. A., 2013, 110(47), 18792–18797, DOI:10.1073/pnas.1313195110.
- K. Korner, A. S. Kuenstler, R. C. Hayward, B. Audoly and K. Bhattacharya, A Nonlinear Beam Model of Photomotile Structures, Proc. Natl. Acad. Sci. U. S. A., 2020, 117(18), 9762–9770, DOI:10.1073/pnas.1915374117.
- D. Corbett, C. L. van Oosten and M. Warner, Nonlinear Dynamics of Optical Absorption of Intense Beams, Phys. Rev. A: At., Mol., Opt. Phys., 2008, 78(1), 013823, DOI:10.1103/PhysRevA.78.013823.
- S. Li, M. M. Lerch, J. T. Waters, B. Deng, R. S. Martens, Y. Yao, D. Y. Kim, K. Bertoldi, A. Grinthal, A. C. Balazs and J. Aizenberg, Self-Regulated Non-Reciprocal Motions in Single-Material Microstructures, Nature, 2022, 605(7908), 76–83, DOI:10.1038/s41586-022-04561-z.
- J. T. Waters, S. Li, Y. Yao, M. M. Lerch, M. Aizenberg, J. Aizenberg and A. C. Balazs, Twist Again: Dynamically and Reversibly Controllable Chirality in Liquid Crystalline Elastomer Microposts, Sci. Adv., 2020, 6(13), eaay5349, DOI:10.1126/sciadv.aay5349.
- R. V. Martinez, J. L. Branch, C. R. Fish, L. Jin, R. F. Shepherd, R. M. D. Nunes, Z. Suo and G. M. Whitesides, Robotic Tentacles with Three-Dimensional Mobility Based on Flexible Elastomers, Adv. Mater., 2013, 25(2), 205–212, DOI:10.1002/adma.201203002.
- D. J. Preston, P. Rothemund, H. J. Jiang, M. P. Nemitz, J. Rawson, Z. Suo and G. M. Whitesides, Digital Logic for Soft Devices, Proc. Natl. Acad. Sci. U. S. A., 2019, 116(16), 7750–7759, DOI:10.1073/pnas.1820672116.
- Y. Yao, J. T. Waters, A. V. Shneidman, J. Cui, X. Wang, N. K. Mandsberg, S. Li, A. C. Balazs and J. Aizenberg, Multiresponsive Polymeric Microstructures with Encoded Predetermined and Self-Regulated Deformability, Proc. Natl. Acad. Sci. U. S. A., 2018, 115(51), 12950–12955, DOI:10.1073/pnas.1811823115.
- C. J. Camargo, H. Campanella, J. E. Marshall, N. Torras, K. Zinoviev, E. M. Terentjev and J. Esteve, Batch Fabrication of Optical Actuators Using Nanotube–Elastomer Composites towards Refreshable Braille Displays, J. Micromech. Microeng., 2012, 22(7), 075009, DOI:10.1088/0960-1317/22/7/075009.
- D. Liu, N. B. Tito and D. J. Broer, Protruding Organic Surfaces Triggered by In-Plane Electric Fields, Nat. Commun., 2017, 8(1), 1526, DOI:10.1038/s41467-017-01448-w.
- M. A. Meyers and K. K. Chawla, Mechanical Behavior of Materials, Cambridge University Press, 2008 Search PubMed.
- L. D. Landau, E. M. Lifshitz, A. M. Kosevich and L. P. Pitaevskii, Theory of Elasticity, Elsevier, 1986, vol. 7 Search PubMed.
- D. Corbett and M. Warner, Linear and Nonlinear Photoinduced Deformations of Cantilevers, Phys. Rev. Lett., 2007, 99(17), 174302, DOI:10.1103/PhysRevLett.99.174302.
- L. Liu, B. Geng, S. M. Sayed, B.-P. Lin, P. Keller, X.-Q. Zhang, Y. Sun and H. Yang, Single-Layer Dual-Phase Nematic Elastomer Films with Bending, Accordion-Folding, Curling and Buckling Motions, Chem. Commun., 2017, 53(11), 1844–1847, 10.1039/C6CC08976C.
- J. Küpfer and H. Finkelmann, Nematic Liquid Single Crystal Elastomers, Makromol. Chem., Rapid Commun., 1991, 12(12), 717–726, DOI:10.1002/marc.1991.030121211.
- C. Ohm, M. Morys, F. R. Forst, L. Braun, A. Eremin, C. Serra, R. Stannarius and R. Zentel, Preparation of Actuating Fibres of Oriented Main-Chain Liquid Crystalline Elastomers by a Wetspinning Process, Soft Matter, 2011, 7(8), 3730, 10.1039/c1sm05111c.
- Y. Sawa, K. Urayama, T. Takigawa, A. DeSimone and L. Teresi, Thermally Driven Giant Bending of Liquid Crystal Elastomer Films with Hybrid Alignment, Macromolecules, 2010, 43(9), 4362–4369, DOI:10.1021/ma1003979.
- A. Kotikian, R. L. Truby, J. W. Boley, T. J. White and J. A. Lewis, 3D Printing of Liquid Crystal Elastomeric Actuators with Spatially Programed Nematic Order, Adv. Mater., 2018, 30(10), 1706164, DOI:10.1002/adma.201706164.
Footnote |
| † Electronic supplementary information (ESI) available. See DOI: https://doi.org/10.1039/d4sm00037d |
| This journal is © The Royal Society of Chemistry 2024 |

