 Open Access Article
Interfacing NiV layered double hydroxide with sulphur-doped g-C3N4 as a novel electrocatalyst for enhanced hydrogen evolution reaction through Volmer–Heyrovský mechanism†
G.
Srividhya
,
C.
Viswanathan
 and
N.
Ponpandian
 *
*
Department of Nanoscience and Technology, Bharathiar University, Coimbatore 641 046, India. E-mail: ponpandian@buc.edu.in; Tel: +91-422-2428423
First published on 25th July 2023
Abstract
The exploration of non-noble-metal-based catalysts for the hydrogen evolution reaction (HER) is important for the green synthesis of hydrogen via electrochemical water splitting. Graphitic carbon nitride (g-C3N4) is a widely studied photocatalyst for the HER; however, its intrinsic catalytic activity is poor. In the present study, bare and S-doped g-C3N4 were combined with the less explored NiV layered double hydroxide (LDH) and their performance for electrochemical HER catalysis was studied. The fused layers of the composites result in a higher specific surface area and expose a higher number of active centres for better catalytic activity. The composite of sulphur-doped g-C3N4 and the NiV LDH showed the least overpotential in comparison with its counterparts, with commendable stability during continuous operation for 8 h. The kinetics of the HER are enhanced by compositing g-C3N4 with the NiV LDH, as indicated by the Tafel slope of 79 mV dec−1 and impedance spectroscopy analysis. This study proposes a novel g-C3N4/NiV LDH-based composite for the HER and gives a comprehensive analysis of the catalytic mechanism in the prepared catalysts.
1. Introduction
Hydrogen energy is a favourable, renewable, and carbon-free solution to the burgeoning energy and environmental crises.1,2 The sustainable production of hydrogen is obligatory for developing hydrogen energy, where electrochemical hydrogen production from water splitting comes as an efficient and environmental friendly solution.3,4 Water splitting occurs via two half-cell reactions, the hydrogen evolution reaction (HER) and the oxygen evolution reaction (OER), which require noble metals (Pt, Ir) and their oxides (IrO2, RuO2), respectively, as electrocatalysts to propel the reactions and reduce the associated overpotential.5 The cost and rarity of these noble-metal-based catalysts reduces the economic viability of electrochemical water splitting, and hence, HER and OER catalysts based on Earth-abundant materials are being studied extensively by electrochemists worldwide.6–10The HER is the cathodic half-cell reaction in water splitting, and in acidic media, it occurs via a two-step process: (i) the adsorption of H+ ions on the catalyst surface to from H*, which is called the Volmer step; and (ii) the second step, which can be either the recombination of adsorbed H* with another solvated H+ to from a H2 molecule, which is called the Heyrovský step (electrochemical desorption), or the chemical desorption of two H* to form a H2 molecule, which is known as the Tafel step.11 Hence, an efficient catalyst should possess enough adsorption sites for the solvated protons and suitable catalytic activity to carry out the second step of either recombination or desorption.12,13 Moreover, it should good possess structural stability to enable prolonged activity during practical operation. For HER catalysis, it is therefore imperative to design non-noble-metal-based, affordable catalysts with the above-discussed properties.
Graphitic carbon nitride (g-C3N4) is a polymeric material and is among the prominently studied metal-free two-dimensional (2D) materials for the photocatalytic and electrochemical production of hydrogen, owing to its high N content.14 It possesses a graphene-like structure with sp2 hybridization of alternate C–N bonds and shows exceptional structural stability, and the vacancy defects around the nitrogen atoms act as catalytic sites for the HER.15 In addition, it shows a suitable and tuneable band gap for photo-absorption, as well as band edges for photo-electrochemical water splitting, which is advantageous for the direct harvesting of solar energy as chemical energy.16 However, its high resistance hinders its catalytic performance, and frequent agglomeration of its layered structure blocks the active sites.17 This can be alleviated by different techniques, such as heteroatom doping, heterojunction engineering, and combining it with other nanostructures.18–20 Heteroatom doping with phosphorus (P) or sulphur (S) can augment the catalytic activity of g-C3N4 by enhancing the charge transfer kinetics and increasing the number of active sites.21–23
Composites of g-C3N4 with transition metal-based materials can drastically increase the catalytic functionality of g-C3N4 due to the intrinsic catalytic activity of transition metals (Ni, Fe, Co, Mn, V, etc.).24,25 Transition metal-based layered double hydroxides (LDHs) are layered ionic compounds made of a positive brucite-like layer, with interlayers of compensating anions and solvent molecules.26 Since the layered structure exposes more catalytic active sites, they exhibit excellent activity towards water electrolysis.27,28 In particular, nickel (Ni)-based LDH shows a near-noble-metal catalytic performance for water splitting.29–31 NiV LDH is a recent addition to the Ni-based LDHs and exhibits exemplary activity towards catalysis of both the HER and OER, owing to its high conductivity along with its layered structure.32
Recent studies have suggested that composites based on g-C3N4 and LDHs provide multifunctional activity for photochemical and electrochemical HER and OER processes as well as dye degradation. The Ni–Mn LDH/g-C3N4 nanocomposite has shown effective HER and OER activities, at overpotentials of 147 mV at 60 mA cm−2 for the HER and 316 mV at 10 mA cm−2 for the OER, along with visible-light degradation activity for the rhodamine B dye.33 The CoMn LDH@g-C3N4 composite showed a hydrogen evolution current of 50 mA cm−2 at an overpotential of 448 mV in 1 M KOH, which is comparable to Pt/C that delivered the same current density at 416 mV.34 The Mo2C@g-C3N4@NiMn-LDH tertiary composite showed functional activity towards the HER and the OER in an alkaline medium, with respective overpotentials of 116 mV and 298 mV at 10 mA cm−2.35 Based on these reports, a composite between NiV LDH, which has high conductivity and high catalytic activity, and g-C3N4 may significantly improve the catalytic activity of g-C3N4. For photocatalytic and photoelectrochemical water splitting, most studies on g-C3N4 have focused on band-gap modification via heterojunction formation. However, for either electrochemical or photoelectrochemical operation, it is equally important to tune the intrinsic activity, for efficient HER and water-splitting reactions.
In the present work, the electrocatalytic activity of g-C3N4 was improved by doping with S and forming a composite with NiV LDH. Composites of pure and S-doped g-C3N4 with the NiV LDH were prepared and their acidic HER catalysis was studied for the first time. Thin-layered g-C3N4 (gCN) and S-doped g-C3N4 (S-gCN) were prepared through a simple precursor modification, without the need for etching in harsh acids. These layered gCN and S-gCN samples were combined with NiV LDH and their respective physico-chemical and electrochemical HER catalytic properties were studied in an acidic medium, for the first time. Among the prepared samples, S-gCN/NiV showed a minimum overpotential of 560 mV at a current density of 10 mA cm−2, and a Tafel slope value of 79 mV dec−1. This study reveals that the HER is promoted in the gCN/NiV and S-gCN/NiV catalysts through the Volmer–Heyrovský mechanism, where the strong adsorption of H+ (i.e., the Volmer step) is subdued by the activity of the fused composite layers. The S-gCN/NiV composite catalyst also showed remarkable stability for sustained catalysis up to 8 h. Our study implies that the S-gCN/NiV composite shows a noteworthy HER catalytic activity, benefitting from heteroatom doping and interfacing layered structures, and shows promise as a photo-electrode for the HER.
2. Experimental
2.1 Materials and reagents
All reagents were used as procured without any purification. Melamine (C3H6N6), urea (CH4N2O), thiourea (CH4N2S), nickel(II) chloride hexahydrate (NiCl2·6H2O) and hexamethylenetetramine (C6H12N4; HMTA) were purchased from, HiMedia. Vanadium trichloride (VCl3) was procured from Sigma Aldrich. Sulphuric acid (H2SO4), ethanol and acetone were acquired from S.D. Fine-Chem Ltd. The 5 wt% Nafion solution was purchased from Alfa Aesar. Double distilled water (DDW) was used to prepare all reaction solutions and electrolytes.2.2 Preparation of gCN and S-gCN
Both pristine and S-doped gCN were prepared via the thermal polycondensation of precursor-modified melamine.36 In a typical experiment, 3 g each of melamine and urea were mixed thoroughly using a mortar and pestle, before being transferred to a crucible and heated in a furnace at 550 °C for 3 h. After cooling to room temperature naturally, the obtained yellow powder was pounded into a fine powder to obtain gCN. For the synthesis of S-gCN, the same procedure was carried out, but 3 g of thiourea was used instead of urea for 1% doping of sulphur.372.3 Preparation of NiV LDH
NiV LDH was prepared using a facile hydrothermal approach.38 In the procedure, 2.6 mmol of NiCl2·6H2O, 0.64 mmol of VCl3 and 6.48 mmol of HMTA were dissolved in 50 mL DDW. After stirring for 20 min, the solution was transferred into an 80 mL stainless autoclave with a Teflon lining and heated at 120 °C for 12 h. After cooling to room temperature, the obtained product was washed by centrifuging with DDW, 3 times and with ethanol, 2 times. The NiV LDH powder was obtained by drying the washed powder at 60 °C for 12 h.2.4 Preparation of gCN/NiV and S-gCN/NiV composites
The NiV LDH-modified S-gCN (S-gCN/NiV) composite was prepared via simple ultrasonic mixing of equal weights of NiV LDH and S-gCN. In a typical procedure, 100 mg of both S-gCN and NiV LDH were mixed in DDW in a closed vial and sonicated for 12 h in an ice bath. After sonication, the sample was washed in ethanol and dried in a hot air oven for 12 h at 60 °C. The undoped gCN/NiV composite was prepared using the same procedure as above but using gCN instead of S-gCN. The preparation of the discussed samples is depicted in Scheme 1.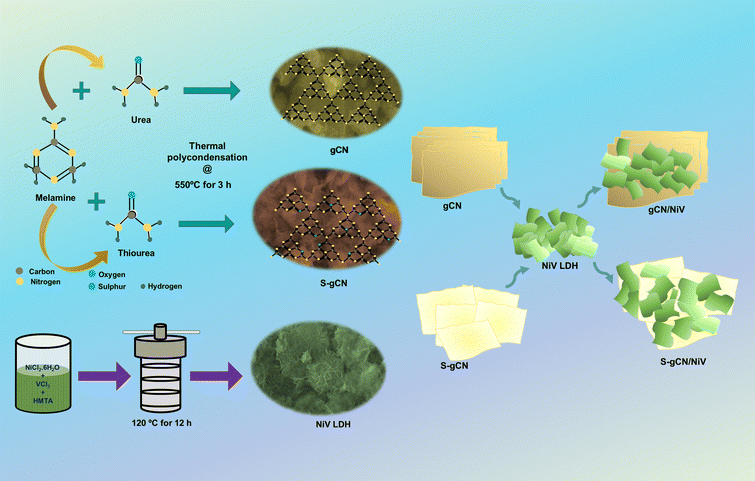 | ||
| Scheme 1 Schematic representation of the preparation of doped and undoped g-C3N4/NiV LDH composites. | ||
2.5 Material characterization
The crystallographic properties were characterized via X-ray diffraction (XRD) analysis (Rigaku Ultima IV) using Cu Kα radiation of wavelength 1.5406 Å. An FEI Quanta-250 FEG field emission scanning electron microscope (FE-SEM) was used to analyse the morphology of the samples, and energy dispersive X-ray analysis (EDAX) with FESEM was used to obtain the compositional information. The specific surface area of the prepared materials was analysed using Brunner–Emmett–Teller (BET) analysis (Microtrac, BELSORP-max). The surface-level compositional information and chemical states were examined via X-ray photoelectron spectroscopy (XPS) (PHI 5000C Probe III, Japan).2.6 Working electrode preparation
The prepared sample (3 mg) was sonicated in a 1 ml mixture of ethanol, DDW and 5 wt% Nafion solution (8![[thin space (1/6-em)]](https://www.rsc.org/images/entities/char_2009.gif) :
:![[thin space (1/6-em)]](https://www.rsc.org/images/entities/char_2009.gif) 1.5
1.5![[thin space (1/6-em)]](https://www.rsc.org/images/entities/char_2009.gif) :
:![[thin space (1/6-em)]](https://www.rsc.org/images/entities/char_2009.gif) 0.5) for 30 min to form a homogenous catalyst ink. A well-cleaned and polished glassy carbon electrode (GCE) was coated with 5 μL of the catalyst ink and allowed to dry at 40 °C for 10 min. The catalyst loading on the GCE with a diameter of 3 mm was calculated to be 0.015 mg cm−2.
0.5) for 30 min to form a homogenous catalyst ink. A well-cleaned and polished glassy carbon electrode (GCE) was coated with 5 μL of the catalyst ink and allowed to dry at 40 °C for 10 min. The catalyst loading on the GCE with a diameter of 3 mm was calculated to be 0.015 mg cm−2.
2.7 Electrochemical measurements
All electrochemical studies were carried out using a PARSTAT PMC-1000 potentiostat (Princeton Applied Research, Ametek Scientific Instruments) in a three-electrode configuration where the catalyst-modified GCE served as the working electrode. A saturated calomel electrode (SCE) and a Pt mesh were used as the reference and counter electrodes, respectively, in 0.5 M H2SO4 of pH 0. The prepared samples were subjected to linear sweep voltammetry (LSV) polarization studies in the potential range of 0 to −1 V vs. SCE at 5 mV s−1. Before this, the catalyst had been stabilized by recording cyclic voltammetry (CV) curves for 100 cycles in the potential window of 0 to −1 V vs. SCE. Electrochemical impedance spectroscopy (EIS) measurements were carried out from 100 kHz to 100 mHz at an HER overpotential of −0.8 V vs. RHE. Electrochemical surface area (ECSA) analysis was carried out by recording cyclic voltammograms in the non-faradaic region of −0.36 to −0.16 V vs. RHE at various scan rates from 10 to 200 mV s−1. The durability of the catalyst electrode was analyzed through chronopotentiometry at 10 mA cm−2 for 8 h. The measured potential was converted in terms of the RHE using the formula , where E°SCE is 0.2412 V. All LSV polarization curves were iR drop compensated.
3. Results and discussion
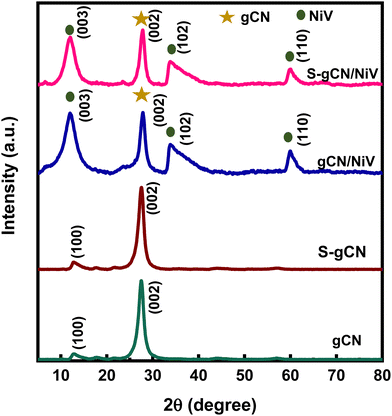
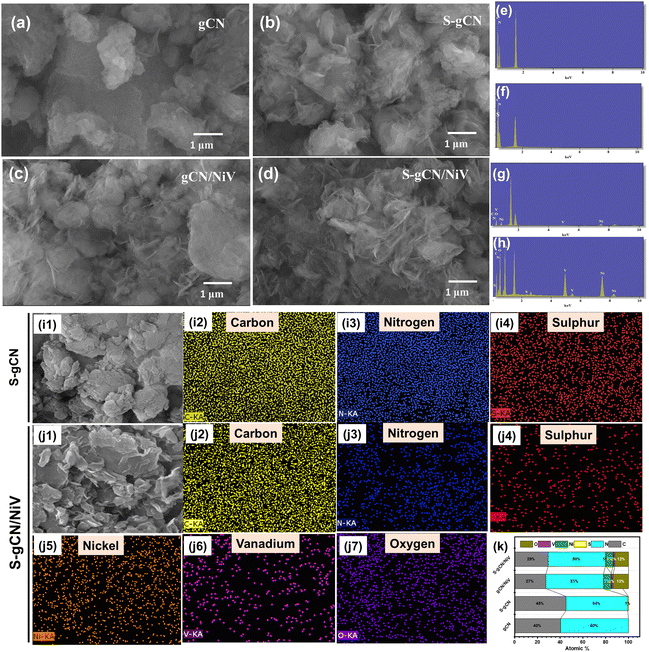
The crystallographic structural properties of the prepared samples were studied using XRD analysis, and the diffractogram is given in Fig. 1. For gCN, the strong peak at 27.5° is due to the interplanar stacking of the (002) plane of the graphitic material, with an interplanar d-spacing of 0.32 nm. The smaller peak at 12.9° corresponds to the (100) plane of the interlayer structural packing, with a d-spacing of 0.69 nm. The diffraction pattern matches the standard pattern of g-C3N4 in the hexagonal phase (JCPDS 87-1526). S-gCN has the same structure as gCN, except that there is a mild shift in the 2θ value of the (100) plane to 12.7°, which can be ascribed to a slight increase in the d spacing (0.7 nm) in the c-axis direction. The NiV LDH shows distinctive peaks at 11.8°, 23.7°, 33.9°, 34.4° and 59.8°, which are indexed to hkl planes (003), (006), (101), (012) and (110), respectively (Fig. S1, ESI†). The peaks in NiV match well with the reference nickel–vanadium carbonate hydroxide hydrate (JCPDS 052-1627). The peaks corresponding to the (101) plane at 33.9° and the (012) plane 34.4° combined to form a single distorted peak, as did the peaks of (110) at 59.9° and (113) at 60.3°. gCN/NiV and S-gCN/NiV have a mixture of peaks from both gCN and NiV. The peaks of g-C3N4 are slightly left shifted whereas the peaks of NiV LDH are slightly right shifted, which corresponds to an increase and decrease in the interplanar spacing, respectively, suggesting a possible strain in the structure. The local strain in a material alters its surface electronic structures which directly affects the catalytic properties of a material.39 In particular, compressive strain in a catalyst leads to a better interaction with the reaction intermediates, resulting in better HER activity.40 The strain due to combining NiV LDH and S-gCN is thus speculated have a similar effect on the adsorbed hydrogen species for promoted hydrogen evolution, as can be seen from Table S1 (ESI†).FE-SEM analysis was carried out to acquire the morphology of the prepared samples, and the images are presented in Fig. 2(a)–(d). gCN is composed of agglomerated layers (Fig. 2(a)), whereas the layers in S-gCN are more defined and crumpled (Fig. 2(b)). This also agrees with the increased d-spacing of the interlayer packing for S-gCN when compared with gCN, as characterized by XRD. The modification of the precursor plays a crucial role in the resultant morphology of the samples.16 g-C3N4 prepared via the usual route of polycondensation of melamine alone was composed of large particles of agglomerated layers that are greater than 3 μm in width (Fig. S2, ESI†). In contrast, modification of the precursor by mixing melamine with either urea or thiourea produced more specified layers. This will be beneficial for improving the surface area and exposing active sites for catalytic applications. The NiV LDH was composed of thin nanosheets bound into 3D spheres, as can be seen in Fig. S3 (ESI†). From Fig. 2(c), we can see that, in gCN/NiV, the gCN particles are covered with NiV LDH sheets, and from Fig. 2(d) it can be seen that the layers of S-gCN and NiV LDH have fused together forming a 2D/2D interface of the S-gCN/NiV microstructure. Sonication has collapsed the assembly of NiV LDH 3D spheres into single layers to form a well-fused layer microstructure with S-gCN. From EDAX analysis, the elemental composition of the samples was determined. The absence of any other impurity elements in the EDAX spectra (Fig. 2(e)–(h)) affirms the sample purity. The peak at 1.5 keV corresponds to Al and arises due to the signal from the aluminium stage used for mounting the samples. The EDAX maps of S-gCN and S-gCN/NiV are presented in Fig. 2(i) and (j), respectively, and those for gCN and gCN/NiV are presented, respectively, in Fig. S5 and S6 (ESI†), which show that the elements are distributed evenly throughout the samples. The atomic compositions of all the samples are presented in Fig. 2(k).
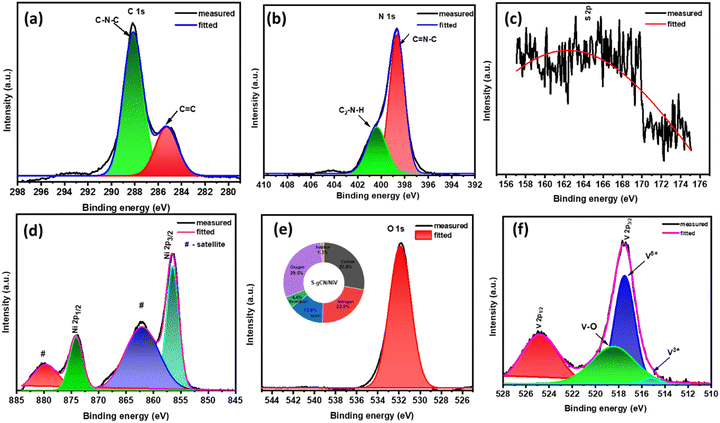
Furthermore, XPS analysis was carried out to obtain accurate information about chemical composition at the surface level and the oxidation state of S-gCN/NiV. The survey scan of S-gCN/NiV displays the presence of C, N, S, O, Ni and V, as given in Fig. S7 (ESI†). The core level spectrum of C 1s consists of two peaks at 284.85 and 288.17 eV, as shown in Fig. 3(a), corresponding to graphitic C![[double bond, length as m-dash]](https://www.rsc.org/images/entities/char_e001.gif) C bonding and N trigonally bonded to sp2 carbon atoms (C–N–C).41 The core level spectrum of N 1s is given in Fig. 3(b) and consists of two convoluted peaks at 398.6 and 400.6 eV that are corroborated to sp2 hybridized N in C
C bonding and N trigonally bonded to sp2 carbon atoms (C–N–C).41 The core level spectrum of N 1s is given in Fig. 3(b) and consists of two convoluted peaks at 398.6 and 400.6 eV that are corroborated to sp2 hybridized N in C![[double bond, length as m-dash]](https://www.rsc.org/images/entities/char_e001.gif) N–C and sp3 hybridized N in secondary amine ((C2)–N–H) binding.42 Since the quantity of sulphur is very low in the doped samples, the core spectrum of S 2p is noisy (Fig. 3(c)), also considering the fact that sulphur usually requires a longer acquisition time than other elements in XPS. However, curve fitting yields a distinctive peak at 163.5 eV, which corresponds to C–S bonding.43 The core level spectrum of Ni 2p shown in Fig. 3(d) shows Ni two peaks at 856.47 eV and 874.19 eV that correspond to Ni 2p3/2 and Ni 2p1/2 with respective satellite peaks at 862.1 and 879.9 eV, denoting the spin–orbital splitting of the Ni 2p orbital. The difference between the peaks is ∼17.1 eV, which is characteristic of Ni2+.44Fig. 3(e) shows the core level peak of O 1s at 531.8 eV, which denotes M–OH bonding. The magnified core level spectrum of V 2p, as shown in Fig. 3(f), shows the spin–orbital splitting of V 2p1/2 and V 2p3/2 at 524.9 and 517.4 eV, respectively.45,46 The V 2p3/2 peak is further resolved into the V5+ peak at 517.4 eV and the V3+ peak at 515.6 eV.47 This indicates that V is mostly present in the +5 oxidization state, which is its most stable state, along with a partial oxidation +3 state.45,48
N–C and sp3 hybridized N in secondary amine ((C2)–N–H) binding.42 Since the quantity of sulphur is very low in the doped samples, the core spectrum of S 2p is noisy (Fig. 3(c)), also considering the fact that sulphur usually requires a longer acquisition time than other elements in XPS. However, curve fitting yields a distinctive peak at 163.5 eV, which corresponds to C–S bonding.43 The core level spectrum of Ni 2p shown in Fig. 3(d) shows Ni two peaks at 856.47 eV and 874.19 eV that correspond to Ni 2p3/2 and Ni 2p1/2 with respective satellite peaks at 862.1 and 879.9 eV, denoting the spin–orbital splitting of the Ni 2p orbital. The difference between the peaks is ∼17.1 eV, which is characteristic of Ni2+.44Fig. 3(e) shows the core level peak of O 1s at 531.8 eV, which denotes M–OH bonding. The magnified core level spectrum of V 2p, as shown in Fig. 3(f), shows the spin–orbital splitting of V 2p1/2 and V 2p3/2 at 524.9 and 517.4 eV, respectively.45,46 The V 2p3/2 peak is further resolved into the V5+ peak at 517.4 eV and the V3+ peak at 515.6 eV.47 This indicates that V is mostly present in the +5 oxidization state, which is its most stable state, along with a partial oxidation +3 state.45,48
The effect of interfacing two 2D layered materials on the surface area of the composite was studied through BET analysis, and the respective pore size distributions were examined using the Barrett–Joyner–Halenda (BJH) technique. From Fig. 4, it is evident that all the prepared samples show a type IV isotherm of N2 adsorption–desorption, which is the behaviour of mesoporous adsorbent structures. The type IV isotherm is accompanied by complete monolayer adsorption, with increased N2 uptake with increasing P/P0 due to multilayer adsorption.49 The multilayer adsorption could also possibly arise due to the adsorption in multiple layers in layered structures of the prepared samples. Hence, the mono-multilayer adsorption of the prepared samples is confirmed using BET analysis. Table 1 lists the values obtained for the specific surface area, average pore size and total pore volume as computed using the BJH method. The surface area of the gCN/NiV composite increased sharply, and S-gCN/NiV has the highest surface area among all the samples due to the intermingling of S-gCN and NiV layers. This enhancement in the surface area will positively influence the HER catalytic performance by revealing more active sites for the reaction.50
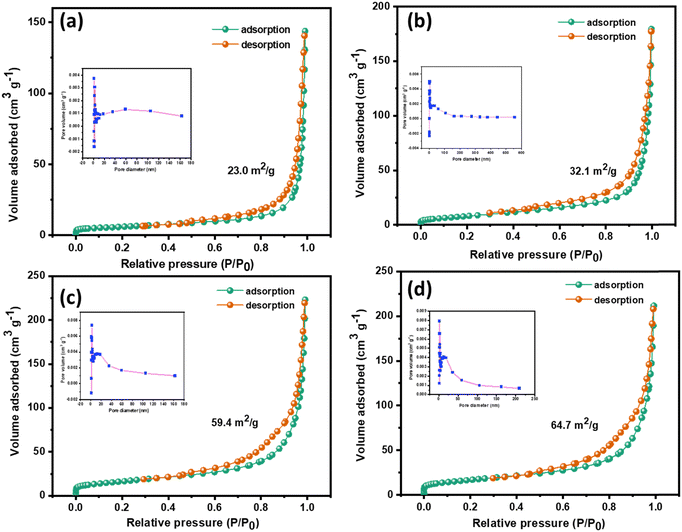 | ||
| Fig. 4 Nitrogen adsorption–desorption isotherms of (a) gCN, (b) S-gCN, (c) gCN/NiV and (d) S-gCN/NiV. The corresponding BJH pore size distribution plot is given as an inset in each figure. | ||
| Sample | Morphology | Specific surface area (m2 g−1) | Average pore size (nm) | Total pore volume (cm3 g−1) |
|---|---|---|---|---|
| gCN | Layers agglomerated into microparticles | 23.0 | 36.1 | 0.2074 |
| S-gCN | Layered microstructure | 32.1 | 30.0 | 0.1846 |
| gCN/NiV | NiV LDH layers covering the surface of gCN particles | 59.4 | 21.7 | 0.3233 |
| S-gCN/NiV | NiV and S-gCN layers fused together | 64.7 | 19.2 | 0.2975 |
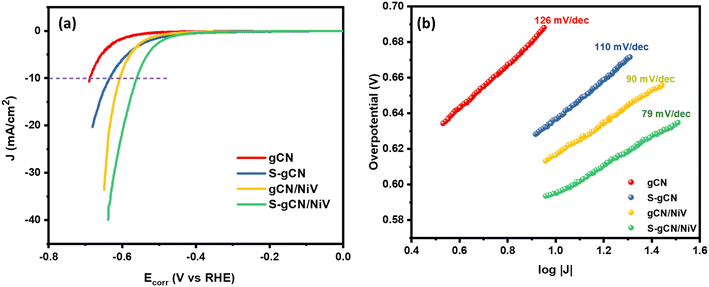
The HER catalysis behaviour of the prepared samples is illustrated by the LSV polarization curves recorded in 0.5 M H2SO4, at 5 mV s−1, as shown in Fig. 5(a). Among all the samples, S-gCN/NiV showed the lowest onset potential of 465 mV, whereas gCN/NiV, S-gCN and gCN, respectively, showed 510, 493 and 586 mV. Similarly, S-gCN/NiV shows the lowest overpotential of 560 mV at 10 mA cm−2, while those for gCN/NiV, S-gCN and gCN are, respectively, 606, 636 and 687 mV for the same current density. The lower overpotentials of gCN/NiV and S-gCN/NiV compared with gCN and S-gCN show that forming composites between g-C3N4 and the NiV LDH significantly improves the HER catalytic activity. This is because, the NiV LDH imparts its intrinsic metallic catalytic activity to g-C3N4 for a boosted HER process.51 Moreover, the lower overpotential value of S-gCN/NiV than gCN/NiV and that of S-gCN compared with gCN implies that S doping imparts an influence to improve HER catalysis. This arises mainly from the substitutional defects created on the structure of g-C3N4 due to S doping, where doping sites act as catalytic centres.52,53
To further elucidate the efficiency of the prepared composite, the best-performing sample, i.e., S-gCN/NiV, was coated onto an FTO substrate (1 × 1 cm) and exposed to xenon lamp irradiation (100 mW cm−2) with a UV filter and linear sweep voltammograms recorded in the same potential window of 0 to −1 V vs. RHE, in 0.5 M H2SO4. Fig. S12 in the ESI† shows the LSV profiles recorded under dark and illuminated conditions, where it can be seen that the irradiated sample shows a potential of 295 mV at 10 mA cm−2, whereas without irradiation the same sample shows a potential of 526 mV at the same current density. Hence, S-gCN/NiV shows more promise as a photoelectrode for the HER, which remains to be explored. Table S2 in the ESI,† compares g-C3N4-and-LDH-based composites for the electrochemical HER, and it can be seen that the S-gCN/NiV composite shows a comparable performance with its binary-composite counterparts.
The intrinsic catalytic activity of a material can be revealed via Tafel analysis. The Tafel equation relates the current density j, to the overpotential value η, as η = b![[thin space (1/6-em)]](https://www.rsc.org/images/entities/char_2009.gif) log
log![[thin space (1/6-em)]](https://www.rsc.org/images/entities/char_2009.gif) |j| + a. Thus, a plot between log
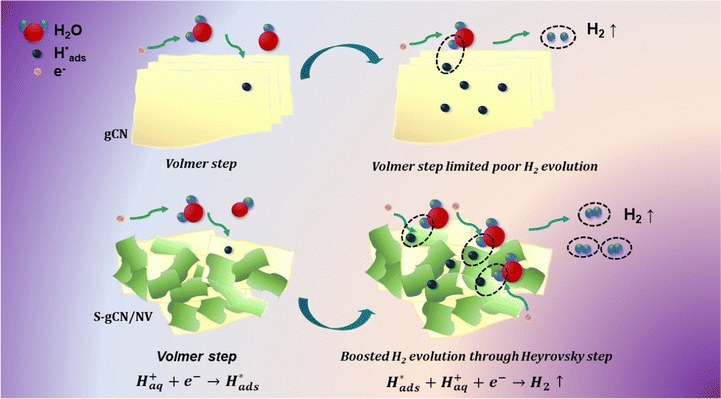
|j| + a. Thus, a plot between log![[thin space (1/6-em)]](https://www.rsc.org/images/entities/char_2009.gif) |j| and η will be linear with a slope b, which is known as the Tafel slope. Theoretical Tafel slope values of 120, 40 and 30 mV dec−1 are assigned correspondingly to the Volmer, Heyrovský and Tafel steps.54 Hence, Tafel slope analysis can provide insight into the catalyst's natural catalytic activity and elucidate the catalytic reaction's rate-determining step. Tafel plots of the studied catalysts are shown in Fig. 5(b). gCN and S-gCN, with Tafel slope values of 126 and 110 mV dec−1, respectively, indicate that the Volmer reaction is the rate-limiting step, i.e., there is excessive adsorption of solvated H+ onto the catalyst surface, but deficient desorption or recombination of adsorbed H* into H2, which hinders the HER. The lower Tafel slope values of gCN/NiV (90 mV dec−1) and S-gCN/NiV (79 mV dec−1) show that the adsorbed H* are generously converted into H2. This suggests that gCN and S-gCN act as strong adsorbing sites for H* and deter their recombination and desorption into H2. The infused NiV LDH sheets may break down the H* adsorption in gCN or S-gCN and facilitate H2 evolution, most probably through the Heyrovský step, which is the electrochemical desorption step.55 The mechanism of hydrogen evolution in gCN and S-gCN/NiV is depicted in Scheme 2.
|j| and η will be linear with a slope b, which is known as the Tafel slope. Theoretical Tafel slope values of 120, 40 and 30 mV dec−1 are assigned correspondingly to the Volmer, Heyrovský and Tafel steps.54 Hence, Tafel slope analysis can provide insight into the catalyst's natural catalytic activity and elucidate the catalytic reaction's rate-determining step. Tafel plots of the studied catalysts are shown in Fig. 5(b). gCN and S-gCN, with Tafel slope values of 126 and 110 mV dec−1, respectively, indicate that the Volmer reaction is the rate-limiting step, i.e., there is excessive adsorption of solvated H+ onto the catalyst surface, but deficient desorption or recombination of adsorbed H* into H2, which hinders the HER. The lower Tafel slope values of gCN/NiV (90 mV dec−1) and S-gCN/NiV (79 mV dec−1) show that the adsorbed H* are generously converted into H2. This suggests that gCN and S-gCN act as strong adsorbing sites for H* and deter their recombination and desorption into H2. The infused NiV LDH sheets may break down the H* adsorption in gCN or S-gCN and facilitate H2 evolution, most probably through the Heyrovský step, which is the electrochemical desorption step.55 The mechanism of hydrogen evolution in gCN and S-gCN/NiV is depicted in Scheme 2.
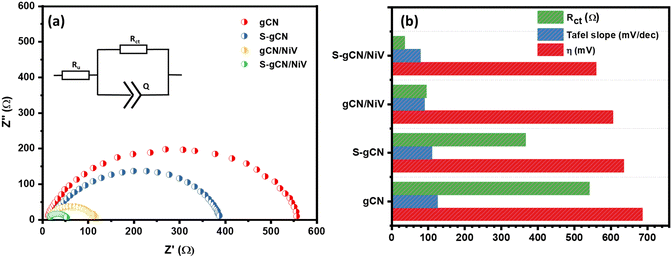
The electrochemical impedance spectra of the prepared samples are given in Fig. 6(a), where all the samples show depressed semi-circles and the equivalent circuit is given as the inset. The values in the x-axis at the beginning and end of the semicircle, respectively, denote, Ru and Ru + Rct, where Ru is the uncompensated resistance arising due to solution resistance and electrical contacts, and Rct is the charge transfer resistance. g-CN and S-gCN exhibit large semicircles, with Rct values of 542 and 367 Ω, respectively. Both gCN/NiV and S-gCN/NiV show diminished semicircles with significantly decreased Rct values of 95 and 36 Ω, respectively. Thus, combining NiV LDH with g-C3N4 boosts the kinetics of charge transfer for the HER reaction.56 The smaller Rct value of S-gCN in comparison with gCN and of S-gCN/NiV compared with that of gCN/NiV suggests that S doping imparts better kinetics for the exchange of electrons, possibly because the doping defect sites act as catalytic centres.53 Moreover, S doping also changes the band structure and band gap of g-C3N4, and from Fig. S8 (ESI†) it can also be seen that S-gCN has a slightly lower band gap than undoped gCN. Since the composite was prepared via external sonication mixing of gCN or S-gCN and NiV, it did not alter the band gap of g-C3N4 to a notable extent; rather, in situ reactions for preparing the composites may have effected modification of the band structures. The activity parameters of Rct, η and the Tafel slope for the prepared catalysts are compared in Fig. 6(b).
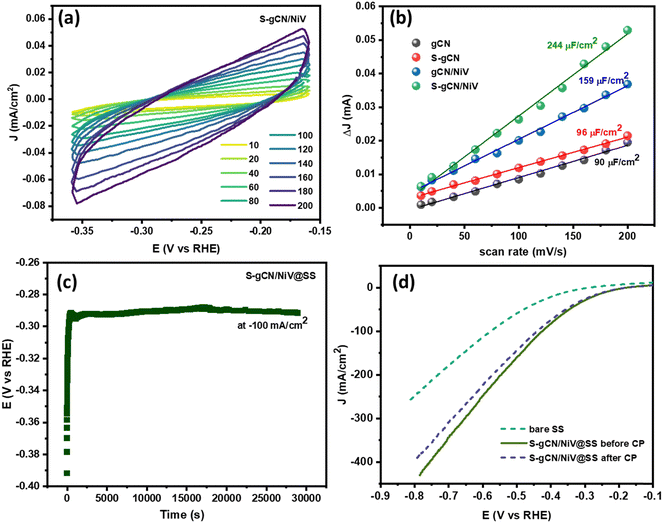
The electrochemical surface area (ECSA) denotes the surface of the catalyst that is available for the electrochemical reaction and is an important parameter to endorse the catalytic activity. A larger ECSA value corresponds to a greater catalytic activity. The ECSA is usually obtained by determining the double-layer capacitance (Cdl).57 To obtain the Cdl value, CV curves were recorded at various scan rates ranging from 10 to 200 mV s−1 in the non-faradaic potential region of −0.3 to −0.1 V vs. RHE, where the current is diffusion limited. The CV curves in the non-faradaic region at different scan rates (in mV s−1) for S-gCN/NiV are given in Fig. 7(a), and those for the remaining samples are given in Fig. S9–S11 (ESI†). The difference between the anodic and cathodic peak current at −0.2 V vs. RHE is plotted against the scan rate to yield a linear graph as shown in Fig. 7(b). The slope of the line represents 2Cdl, from which Cdl and thus the ECSA can be determined using the following relation: ECSA = Cdl/Cs, where Cs is the specific capacitance of a planar smooth surface. There exist inconsistencies in the literature with values of Cs, and this often results in exaggeration or understatement of the real ECSA value.58 However, since Cs is a constant, the Cdl value can be taken as a direct indicator of the ECSA. S-gCN/NiV showed the highest Cdl value of 244 μF cm−2, followed by gCN/NiV, S-gCN and gCN at 159 μF cm−2, 96 μF cm−2 and 90 μF cm−2, correspondingly. The profound increase in ECSA for the composites when compared with the sole material is due to the interfacing of NiV layers with g-C3N4, which results in a high specific surface area, as also verified by the BET analysis data.
The stability of S-gCN/NiV for sustained HER operation was investigated using chronopotentiometry (CP). Since a GCE is not suitable for prolonged studies, 200 μl of the catalyst ink was coated onto a stainless steel (SS) foil of area 1 × 1 cm, and this S-gCN/NiV-modified SS (S-gCN/NiV@SS) was used as the working electrode. LSV of the bare SS and S-gCN/NiV@SS electrodes was carried out before CP measurements were obtained, after which CP was performed at −100 mA cm−2 for 30![[thin space (1/6-em)]](https://www.rsc.org/images/entities/char_2009.gif) 000 s (Fig. 7(c)); from this, it can be seen that S-gCN/NiV@SS has a stable catalytic performance. As shown in Fig. 7(d), the S-gCN/NiV@SS electrode remained intact and showed negligible variance between the LSV curves recorded before after the chronopotentiometric study of nearly 8 h.
000 s (Fig. 7(c)); from this, it can be seen that S-gCN/NiV@SS has a stable catalytic performance. As shown in Fig. 7(d), the S-gCN/NiV@SS electrode remained intact and showed negligible variance between the LSV curves recorded before after the chronopotentiometric study of nearly 8 h.
The structural stability of S-gCN/NiV was studied further by performing post-electrochemical XRD and FE-SEM analyses. The catalyst was scraped off the SS substrate after 8 h of chronopotentiometry and rinsed with DD water via centrifugation. For XRD analysis, the sample was mixed with 8 mg of amorphous glass powder, whose XRD signal was used as the background, to obtain the exact pattern of the sample, and the scanning rate was lowered to 0.5° min−1. This change to the scan rate was carried out to compensate for the limited quantity of the catalyst sample, since it is a recommended practice not to overload catalyst for any catalysis. For FE-SEM analysis, the scraped and washed catalyst was used as such. Fig. 8(a) shows that in the XRD pattern of the post-CP sample, there is a decrease in the intensity of the peak that corresponds to the (003) plane of NiV LDH. Moreover, the peaks corresponding to the (101) and (012) planes of NiV LDH have broadened. This shows that S-gCN/NiV almost retains its structure, but NiV LDH is prone to a moderate structural deformation. This is also verified from the FE-SEM images shown in Fig. 8(b) and (c), where it can be seen that S-gCN/NiV retains its layered structure post-catalysis, although the layers are denser and more stacked after the CP analysis. EDAX analysis revealed that the elemental composition of the catalyst does not vary significantly, except for vanadium, which is ∼16% lower in the post-catalysis samples, as can be seen from Fig. 8(d), (e) and Table 2. This could be due to the harsh acidic conditions under which the HER is performed. The amount of sulphur in the post-CP sample is much higher, due to the penetration of sulphate ions from the electrolyte. These studies reveal that S-gCN/NiV possesses considerable structural and morphological stability after 8 hours of HER catalysis.
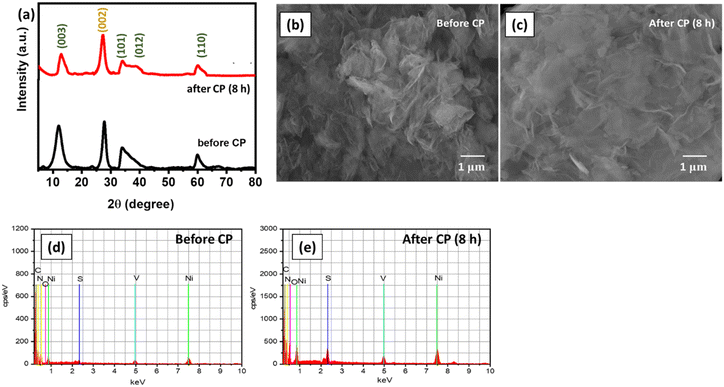 | ||
| Fig. 8 (a) XRD pattern of S-gCN/NiV before and after CP; FE-SEM images of S-gCN/NiV (b) before and (c) after CP; and EDAX analysis of S-gCN/NiV (d) before and (e) after CP. | ||
| Element | Atomic composition (%) | |
|---|---|---|
| Before CP | After CP (8 h) | |
| Ni | 5.55 | 5.67 |
| V | 2.17 | 1.82 |
| O | 13.82 | 14.30 |
| C | 43.63 | 40.15 |
| N | 33.82 | 36.09 |
| S | 1.01 | 1.97 |
| Total | 100 | 100 |
4. Conclusion
Novel composites of bare and S-doped g-C3N4 with the NiV LDH were prepared and their electrochemical HER catalysis performance was studied. The layered microstructure of the composites was confirmed via FE-SEM analysis and, in comparison with the unadorned gCN and S-gCN samples, a significant improvement in the specific surface area of their composites with the NiV LDH was verified through BET analysis. Electrochemical polarization studies showed that the composites demonstrated an increased catalytic activity. Tafel analysis implies that the infusion of NiV LDH layers with g-C3N4 drives the HER by Volmer–Heyrovský mechanism, whereas in plain gCN and S-gCN, the HER is limited by the Volmer step. Doping with sulfur also positively impacts the HER catalysis, mainly through the exposure of more active sites, as both S-gCN/NiV and S-gCN showed better catalytic activity than the undoped gCN/NiV and gCN, respectively. Among the prepared catalysts, S-gCN/NiV showed a lower overpotential of 560 mV at 10 mA cm−2 and a Tafel slope of 79 mV dec−1, and exhibited profound stability under continuous catalysis for ∼8 h. This study proposes that the poor intrinsic catalytic activity of g-C3N4 for the HER can be overcome via heteroatom doping and the formation of composites with LDHs, which paves the way for further photoelectrochemical HER and water-splitting studies.Author contributions
G. Srividhya: conceptualization, data curation, investigation, methodology, visualization and writing; N. Ponpandian: conceptualization, resources, funding acquisition and validation.Conflicts of interest
There are no conflicts of interest to declare.Acknowledgements
The authors thank Tamilnadu State Council of Higher Education (TANSCHE), Govt. of Tamilnadu for the funding (RGP/2019-20/BU/HECP-0025). The authors would also wish to acknowledge DST-FIST, DST-PURSE and UGC-SAP, Govt. of India for the establishment of research facilities in the department.References
- M. A. Rosen and S. Koohi-Fayegh, Energy Ecol. Environ., 2016, 1, 10–29 CrossRef
.
- P. Zhao, W. Xu, A. Liu, W. Wu, J. Wang and X. Wang, Int. J. Hydrogen Energy, 2023, 48, 9198–9218 CrossRef CAS
.
- S. Y. Tee, K. Y. Win, W. S. Teo, L.-D. Koh, S. Liu, C. P. Teng and M.-Y. Han, Adv. Sci., 2017, 4, 1600337 CrossRef PubMed
.
- S. Singla, S. Sharma, S. Basu, N. P. Shetti and T. M. Aminabhavi, Int. J. Hydrogen Energy, 2021, 46, 33696–33717 CrossRef CAS
.
- L. Tian, Z. Li, X. Xu and C. Zhang, J. Mater. Chem. A, 2021, 9, 13459–13470 RSC
.
- A. Manikandan, P. R. Ilango, C.-W. Chen, Y.-C. Wang, Y.-C. Shih, L. Lee, Z. M. Wang, H. Ko and Y.-L. Chueh, J. Mater. Chem. A, 2018, 6, 15320–15329 RSC
.
- P. R. Ilango, H. Huang, L. Li, S. Yang and S. Peng, Solid State Sci., 2021, 117, 106627 CrossRef CAS
.
- D. Yu, P. R. Ilango, S. Han, M. Ye, Y. Hu, L. Li and S. Peng., Int. J. Hydrogen Energy, 2019, 44, 32054–32065 CrossRef CAS
.
- Z. Cai, Z. Wang, Y. Xia, H. Lim, W. Zhou, A. Taniguchi, M. Ohtani, K. Kobiro, T. Fujita and Y. Yamauchi, Angew. Chem., 2021, 133, 4797–4805 CrossRef
.
- H. Wu, C. Feng, L. Zhang, J. Zhang and D. P. Wilkinson, Electrochem. Energy Rev., 2021, 4, 473–507 CrossRef CAS
.
- A. Lasia, J. Hydrogen Energy, 2019, 44, 19484–19518 CrossRef CAS
.
- J. Mei, T. He, J. Bai, D. Qi, A. Du, T. Liao, G. A. Ayoko, Y. Yamauchi, L. Sun and Z. Sun, Adv. Mater., 2021, 33, 2104638 CrossRef CAS PubMed
.
- H. Q. Fu, M. Zhou, P. F. Liu, P. Liu, H. Yin, K. Z. Sun, H. G. Yang, M. Al-Mamun, P. Hu, H.-F. Wang and H. Zhao, J. Am. Chem. Soc., 2022, 144, 6028–6039 CrossRef CAS PubMed
.
- S. Geng, W. Yang and Y. S. Yu, J. Catal., 2019, 375, 441–447 CrossRef CAS
.
- T. Li, J. Wu, L. Qiao, Q. Zhu, Z. Fu, J. Lin, J. Chen, L. Peng, B. Wang and Z. Chen, Mater. Today Energy, 2022, 26, 101002 CrossRef CAS
.
- X. Chen, R. Shi, Q. Chen, Z. Zhang, W. Jiang, Y. Zhu and T. Zhang, Nano Energy, 2019, 59, 644–650 CrossRef CAS
.
- H. Wang, X. Li and J. Yang, ChemPhysChem, 2016, 17, 2100–2104 CrossRef CAS PubMed
.
- Sk Riyajuddin, S. K. Tarik Aziz, S. Kumar, G. D. Nessim and K. Ghosh, ChemCatChem, 2020, 12, 1394–1402 CrossRef CAS
.
- X. She, J. Wu, H. Xu, J. Zhong, Y. Wang, Y. Song, K. Nie, Y. Liu, Y. Yang, M.-T. F. Rodrigues, R. Vajtai, J. Lou, D. Du, H. Li and P. M. Ajayan, Adv. Energy Mater., 2017, 7, 1700025 CrossRef
.
- Z.-A. Lan, G. Zhang and X. Wang, Appl. Catal., B, 2016, 192, 116–125 CrossRef CAS
.
- Y.-P. Zhu, T.-Z. Ren and Z.-Y. Yuan, ACS Appl. Mater. Interfaces, 2015, 7, 16850–16856 CrossRef CAS PubMed
.
- J. Jiang, Z. Xiong, H. Wang, G. Liao, S. Bai, J. Zou, P. Wu, P. Zhang and X. Li, J. Mater. Sci. Technol., 2022, 118, 15–24 CrossRef CAS
.
- M.-H. Vu, M. Sakar, C.-C. Nguyen and T.-O. Do, ACS Sustainable Chem. Eng., 2018, 6, 4194–4203 CrossRef CAS
.
- L. Bai, H. Huang, S. Yu, D. Zhang, H. Huang and Y. Zhang, J. Energy Chem., 2022, 64, 214–235 CrossRef CAS
.
- H. Zhao, H. Zhang, G. Cui, Y. Dong, G. Wang, P. Jiang, X. Wu and N. Zhao, Appl. Catal., B, 2018, 225, 284–290 CrossRef CAS
.
- H. Boumeriame, E. S. Da Silva, A. S. Cherevan, T. Chafik, J. L. Faria and D. Eder, J. Energy Chem., 2022, 64, 406–431 CrossRef CAS
.
- L. Lv, Z. Yang, K. Chen, C. Wang and Y. Xiong, Adv. Energy Mater., 2019, 9, 1803358 CrossRef
.
- Z.-Y. Zhang, H. Tian, L. Bian, S.-Z. Liu, Y. Liu and Z.-L. Wang, J. Energy Chem., 2023, 83, 90–97 CrossRef CAS
.
- M. Luo, J. Yang, X. Li, M. Eguchi, Y. Yamauchi and Z.-L. Wang, Chem. Sci., 2023, 14, 3400–3414 RSC
.
- L. Feng, Y. Du, J. Huang, L. Cao, L. Feng, Y. Feng, Q. Liu, D. Yang and K. Kajiyoshi, Sustain, Energy Fuels, 2020, 4, 2850–2858 CAS
.
- P. M. Bodhankar, P. B. Sarawade, G. Singh, A. Vinu and D. S. Dhawale, J. Mater. Chem. A, 2021, 9, 3180–3208 RSC
.
- D. He, L. Cao, J. Huang, K. Kajiyoshi, J. Wu, C. Wang, Q. Liu, D. Yang and L. Feng, J. Energy Chem., 2020, 47, 263–271 CrossRef
.
- M. Shakeel, M. Arif, G. Yasin, B. Li and H. D. Khan, Appl. Catal., B, 2019, 242, 485–498 CrossRef CAS
.
- M. Arif, G. Yasin, M. Shakeel, X. Fang, R. Gao, S. Ji and D. Yan, Chem. – Asian J., 2018, 13, 1045–1052 CrossRef CAS PubMed
.
- B. Zhang, J. Li, Q. Song and H. Liu, Int. J. Energy Res., 2022, 46, 12406–12416 CrossRef CAS
.
- N. Tian, Y. Zhang, X. Li, K. Xiao, X. Du, F. Dong, G. I. N. Waterhouse, T. Zhang and H. Huang, Nano Energy, 2017, 38, 72–81 CrossRef CAS
.
- L. Ye and S. Chen, Appl. Surf. Sci., 2016, 389, 1076–1083 CrossRef CAS
.
- A. Tyagi, M. C. Joshi, A. Shah, V. K. Thakur and R. K. Gupta, ACS Omega, 2019, 4, 3257–3267 CrossRef CAS PubMed
.
- X. Wang, Y. Zhu, A. Vasileff, Y. Jiao, S. Chen, L. Song, B. Zheng, Y. Zheng and S.-Z. Qiao, ACS Energy Lett., 2018, 3, 1198–1204 CrossRef CAS
.
- S. Wang, L. Wang, L. Xie, W. Zhao, X. Liu, Z. Zhuang, Y. Zhuang, J. Chen, S. Liu and Q. Zhao, Nano Res., 2022, 15, 4996–5003 CrossRef CAS
.
- F. Qiao, J. Wang, S. Ai and L. Li, Sens. Actuators, B, 2015, 216, 418–427 CrossRef CAS
.
- P. Liu, N. Sun, Y. Liang and F. Chen, Res. Chem. Intermed., 2018, 44, 843–857 CrossRef CAS
.
- A. Kadam, Md Moniruzzaman and S.-W. Lee, Molecules, 2019, 24, 450 CrossRef PubMed
.
- K. Fan, H. Chen, Y. Ji, H. Huang, P. M. Claesson, Q. Daniel, B. Philippe, H. Rensmo, F. Li, Y. Luo and L. Sun, Nat. Commun., 2016, 7, 11981 CrossRef CAS PubMed
.
- A. Karmakar, K. Karthick, S. S. Sankar, S. Kumaravel, R. Madhu, K. Bera, H. N. Dhandapani, S. Nagappan, P. Murugan and S. Kundu, J. Mater. Chem. A, 2022, 10, 3618–3632 RSC
.
- D. Xiong, W. Li and L. Liu, Chem. – Asian J., 2017, 12, 543–551 CrossRef CAS PubMed
.
- E. Hryha, E. Rutqvist and L. Nyborg, Surf. Interface Anal., 2012, 44, 1022–1025 CrossRef CAS
.
- D. He, L. Cao, J. Huang, K. Kajiyoshi, J. Wu, C. Wang, Q. Liu, D. Yang and L. Feng, J. Energy Chem., 2020, 47, 263–271 CrossRef
.
-
F. J. Sotomayor, K. A. Cychosz and M. Thommes, Characterization of Micro/Mesoporous Materials by Physisorption: Concepts and Case Studies, 2018, vol. 3 Search PubMed
.
- H.-Y. Wang, Y.-Y. Hsu, R. Chen, T.-S. Chan, H. M. Chen and B. Liu, Adv. Energy Mater., 2015, 5, 1500091 CrossRef
.
- Y. Xu, K. Fan, Y. Zou, H. Fu, M. Dong, Y. Dou, Y. Wang, S. Chen, H. Yin, M. Al-Mamun, P. Liu and H. Zhao, Nanoscale, 2021, 13, 20324–20353 RSC
.
- Y.-C. Chu, T.-J. Lin, Y.-R. Lin, W.-L. Chiu, B.-S. Nguyen and C. Hu, Carbon N. Y., 2020, 169, 338–348 CrossRef CAS
.
- Y. Wang, Y. Tian, L. Yan and Z. Su, J. Phys. Chem. C, 2018, 122, 7712–7719 CrossRef CAS
.
- B. V. Tilak and C.-P. Chen, J. Appl. Electrochem., 1993, 23, 631–640 CrossRef CAS
.
- G. Zhao, K. Rui, S. X. Dou and W. Sun, Adv. Funct. Mater., 2018, 28, 1803291 CrossRef
.
- D. Wang, Q. Li, C. Han, Q. Lu, Z. Xing and X. Yang, Nat. Commun., 2019, 10, 3899 CrossRef PubMed
.
- Y. Jiang, D. Zhong, L. Wang, J. Li, G. Hao, J. Li and Q. Zhao, Chem. – Asian J., 2022, 17, e202200380 CAS
.
- P. Connor, J. Schuch, B. Kaiser and W. Jaegermann, Z. Phys. Chem., 2020, 234, 979–994 CrossRef CAS
.
Footnote |
| † Electronic supplementary information (ESI) available. See DOI: https://doi.org/10.1039/d3ya00287j |
| This journal is © The Royal Society of Chemistry 2023 |

