 Open Access Article
Boosting the efficiency of transient photoluminescence microscopy using cylindrical lenses†
Alvaro J.
Magdaleno
 a,
Mercy M.
Cutler
a,
Jesse J.
Suurmond
a,
Marc
Meléndez
a,
Mercy M.
Cutler
a,
Jesse J.
Suurmond
a,
Marc
Meléndez
 b,
Rafael
Delgado-Buscalioni
 b,
Michael
Seitz
 a and
Ferry
Prins
 *a
*a
aCondensed Matter Physics Center (IFIMAC) and Department of Condensed Matter Physics, Universidad Autónoma de Madrid, 28049 Madrid, Spain. E-mail: ferry.prins@uam.es
bCondensed Matter Physics Center (IFIMAC) and Department of Theoretical Condensed Matter Physics, Universidad Autónoma de Madrid, 28049 Madrid, Spain
First published on 30th August 2023
Abstract
Transient Photoluminescence Microscopy (TPLM) allows for the direct visualization of carrier transport in semiconductor materials with sub nanosecond and few nanometer resolution. The technique is based on measuring changes in the spatial distribution of a diffraction limited population of carriers using spatiotemporal detection of the radiative decay of the carriers. The spatial resolution of TPLM is therefore primarily determined by the signal-to-noise-ratio (SNR). Here we present a method using cylindrical lenses to boost the signal acquisition in TPLM experiments. The resulting asymmetric magnification of the photoluminescence emission of the diffraction limited spot can increase the collection efficiency by more than a factor of 10, significantly reducing acquisition times and further boosting spatial resolution.
Introduction
Transient Photoluminescence Microscopy (TPLM) has emerged as a powerful technique to directly visualize the displacement of energy carriers in a variety of semiconductor materials, including organic semiconductors,1 nanocrystal assemblies,2,3 transition metal dichalcogenides,4,5 and perovskite semiconductors.6–9 Through this direct visualization of the carrier motion, detailed information on the spatial dynamics can be obtained.10In its simplest form, TPLM uses a pulsed laser for near-diffraction-limited excitation of an initial population of energy carriers. As the population broadens in time, photoluminescence (PL) emission that results from carrier recombination is collected and projected with large magnification (typically >300×). By raster scanning an avalanche photodiode (APD) through the strongly magnified image plane, a map of the spatial and temporal dynamics of the population can be recorded with sub-ns and few-nm resolution. Raster scanning of an APD is the simplest and most cost-effective implementation of TPLM,1,2 though alternative detection schemes have been reported as well, including the use of streak cameras5,7 or time-gated ICCDs.8 While there are small differences in the quantum efficiency and temporal resolution of these different detectors, the overall performance is comparable.
Using this method, a movie-like representation of the time-dependent broadening of the carrier population is obtained. By determining the change in variance (σ2(t) − σ2(t = 0)) of the population for each time-slice, the mean-square-displacement (MSD) of the population can be extracted (MSD = σ2(t) − σ2(t = 0)). Importantly, the spatial precision with which the expansion can be determined is set by the signal-to-noise-ratio (SNR) and can be on the order of just 10 nm.2 Consequently, maximising the SNR is one of the key challenges in TPLM experiments.
Importantly, in many materials, carrier diffusion is isotropic along the different in-plane dimensions. In this case, a line-scan through the centre of the carrier population suffices to obtain the full carrier transport characteristics. The reduced scan area allows for a higher spatial precision within the same acquisition time. At the same time though, a large fraction of the signal is projected outside of the collection area of the line scan and is therefore lost. To further boost the acquisition efficiency of TPLM measurements in isotropic materials, we propose the use of cylindrical lenses to concentrate the majority of the PL signal onto the one-dimensional scan area. We show that this method dramatically improves the SNR for a given acquisition time. While this improvement is significant to all types of materials, it is largest for materials with a large diffusion length where carriers diffuse farther out from the original excitation spot. The use of cylindrical lenses provides a straightforward route toward improved spatial resolution in TPLM measurements.
Results and discussion
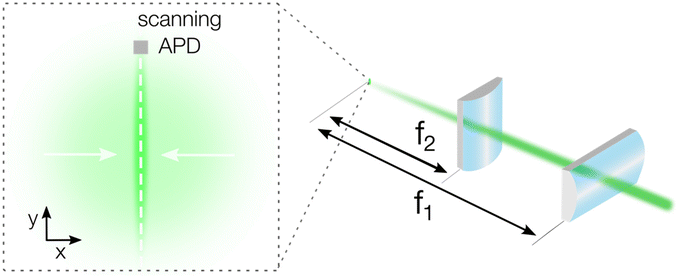
Our basic TPLM setup is based on the original reports by Akselrod et al.1,2 and uses raster scanning of an avalanche photodiode (APD, Micro Photon Devices PDM, 20 × 20 μm detector size) through the image plane of the carrier population. In short, a pulsed laser diode (PicoQuant LDH-D-C-405, PDL 800-D, λ = 405 nm) is focussed down to a near-diffraction limited excitation spot with a full-width-at-half-maximum (FWHM) of a few hundred nm using a 100× oil immersion objective (Nikon CFI Plan Fluor, N.A. = 1.3). Fluorescence from the material is then collected using the same objective, filtered using a dichroic filter and projected to an intermediate image plane using the standard f = 200 mm tube lens of the microscope to yield a 100× magnification. To generate a higher magnification for TPLM measurements, a set of relay lenses is used. For conventional TPLM, this set consists of a f = 100 mm collimating and a f = 400 mm imaging lens to yield a theoretical total magnification of the image plane of 400× (see Fig. S1†). For example, taking an emission spot of 500 nm, the projected size of the carrier population at this magnification would be as large as 200 μm, which is significantly larger than the APD detector size of 20 μm. The relatively small size of the APD allows for high resolution mapping of the emission profile of the carrier population along the scan direction. Importantly though, as mentioned, a trade-off exists between the achievable resolution in the scan direction and the loss of signal from carriers moving in the orthogonal direction.To capture signal from carriers moving orthogonally to the scan direction, we implement a detection scheme with cylindrical lenses. In this alternative geometry, we substitute the f = 400 mm spherical lens with a set of two perpendicularly oriented cylindrical lenses to collapse the x-axis of the image plane (see Fig. 1 and a more complete set-up description in Fig. S2†). The first cylindrical lens (LJ1363RM Thorlabs) has the identical focal length to the original spherical lens (f1 = 400 mm) and generates the high total magnification of 400× along the scanning direction (y-axis in Fig. 1). The second cylindrical lens has a short focal length (f2 = 20 mm, AYL2520-A Thorlabs) and is used to collapse the image along the orthogonal direction (x-axis in Fig. 1), resulting in a total magnification of 20×. With a magnification ratio of 400/20 = 20, the short axis of the asymmetric image of the carrier population is then reduced to around 10 μm, well within the size of the APD detector and significantly reducing the signal losses due to carriers moving in the orthogonal direction. It should be emphasized that these magnifications are theoretical and can vary in practise due to imperfections in the alignment and in the lens quality.
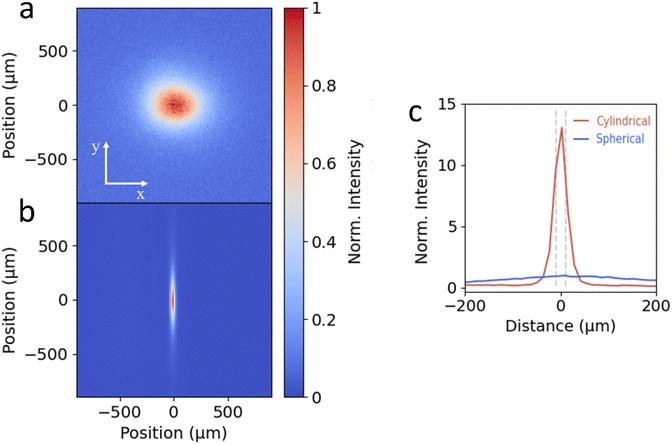
To test the cylindrical lens setup, we image the PL emission spot of a single crystalline flake of 2D perovskite ((PEA)2PbI4) onto an EMCCD camera (Princeton Instruments, ProEM HS 1024BX3). 2D perovskites exhibit isotropic carrier diffusion in the in-plane directions in the form of excitons.6,7,11–13Fig. 2a shows the image of the PL emission using the traditional spherical lens setup, showing the projection of the symmetric emission spot at large magnification. In comparison, for the image from the cylindrical lens setup shown in Fig. 2b, the large magnification along the y-axis is maintained but the compression of the image along the x-axis is clearly visible. To compare the light intensity of the cylindrical (Icyl) and spherical lens (Isph) configurations, in Fig. 2c we show the intensity profiles along the x-axis normalized to the maximum intensity of Isph. For the cylindrical projection the FWHM of the large y-axis magnification (blue solid line) measures 312 μm, while for the x-axis this is reduced to 26 μm, yielding a magnification ratio of around 12. While this is less than the theoretical magnification ratio (400/20 = 20), a significant gain in signal collection onto the 20 μm APD detector can be achieved, as indicated by the grey dashed lines in Fig. 2c. To quantify the signal enhancement, we integrate the intensity of the central 20 μm of the line traces shown in Fig. 2c. While the spherical lens projects only 3% of the total emission along the x-axis onto the detector, the cylindrical lens enhances this to 35%. This is translated into a total integrated intensity enhancement (Icyl/Isph) of 10.8.
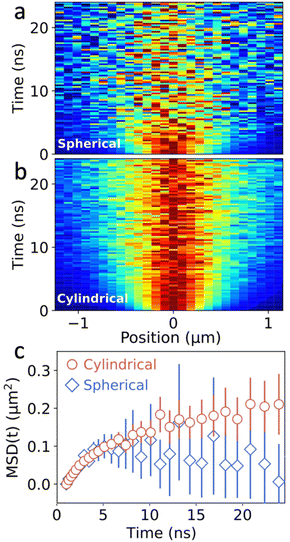
To test the benefits of the intensity enhancement achieved with the new configuration, we perform TPLM with both set-ups. For this, the image plane is projected onto the APD, which is placed on a motorized x–y stage that allows for the spatial scanning. In a first step, the APD is raster scanned across the image plane to find the center of the emission spot. Then, for both the spherical and cylindrical lens configuration, the actual measurement is performed by scanning along the y-axis while keeping the x-axis fixed. The resulting one-dimensional diffusion maps for the 2D perovskite are presented in Fig. 3a and b. In these spatiotemporal maps, every time slice is normalized to its maximum intensity, highlighting the broadening of the population as a function of time. Despite equal integration times (4.5 min), laser repetition rate (40 MHz), and excitation fluence (50 nJ cm−2), the SNR of the diffusion map of the cylindrical lens configuration is considerably better as compared to the spherical lens configuration.
In a conventional TPLM experiment with spherical lenses, the MSD is extracted by measuring along the central cross-section of the exciton population and tracking its change in variance σ2(t) − σ2(0) for each time slice by fitting the experimental result with the expected intensity profile – normally a Gaussian or a Voigt distribution. Using a Gaussian or a Voigt distribution as a fit function for the cross section is possible in a conventional TM experiment with spherical lenses because the detector size is much smaller than the magnified image of the carrier population (20 vs. 200 μm in the example above) and can therefore be well approximated as a point detector.10 Crucially though, because of the smaller magnification in the orthogonal direction in the cylindrical lens setup, the approximation of a point detector no longer holds. In fact, due to the small magnification in the orthogonal direction (x-direction in Fig. 1 and 2b) the detector no longer collects a one-dimensional slice of the distribution, but a larger collection area, which can be represented by the integral:  , where f(x,y) is the carrier distribution and d is the projected and demagnified detector size in the x direction (e.g. for a 20 μm APD and a cylindrical setup with 20× magnification: d = 20 μm/20 = 1 μm). This integral represents the expected intensity distribution to be measured for a cylindrical lens setup, and hence h(y) has to be used to fit the experimental results. Interestingly, for a Gaussian exciton population, the integral is again Gaussian just like the simple cross section (h(y) ∝f(x,y = const.)). However, this proportionality is specific to the Gaussian fit and does not hold for other types of fit functions to the distribution. A number of Transient Microscopy studies have shown that simple Gaussian functions often fail to capture the tails of the emission profile in thin films.2,6,14 For a more accurate determination of the MSD(t), the tails of emission profiles are often best described by Voigt functions, which are convolutions of a Lorentzian with a Gaussian.2,6 To accurately determine the change in variance σ(t)2 − σ(t)2 of the Voigt function in the case of the definite integration, we introduce a numerical integration h(y) of a 2D Voigt along the x-axis in the APD scan area. With the resulting integrated function, we fit the experimental TPLM data, allowing us to calculate the MSD(t) dependence using MSD(t) = σ(t)2 − σ(0).2
Fig. 3c shows a comparison of the resulting MSD as a function of time for both the spherical and cylindrical lens setup. The error bars represent the uncertainty (one standard deviation) in the fitting procedure for MSD(t), in both cases increasing significantly at later times when the fluorescent signal is diminished due to the exponential decay of the excitons in the system. Importantly though, the error bars for the cylindrical lens setup are dramatically reduced as compared to the spherical lens, as expected from the improved signal collection (see Fig. S3 and S4†). Consequently, for equal acquisition times, more precise information about the MSD can be obtained using the cylindrical lens setup. A noteworthy implication is that this can improve the visualization of the dynamics at the later times where the SNR is typically low, providing valuable information about anomalous transport regimes and the corresponding local energy landscape of the material.13
To determine the diffusion length, we use a biexponential fit of the fluorescence lifetime decay dynamics (see Fig. S5†) to determine the fraction of surviving excitons as a function of time (see Fig. S5†). The diffusion length LD is then defined as the net displacement in one dimension achieved by 37% (i.e., 1/e) of the exciton population. The improved SNR in both the spatial as well as the temporal decay dynamics using the cylindrical lens setup improves the precision with which the diffusion length can be determined for equal acquisition times, yielding LD = 174 ± 11 nm for the spherical and LD = 184 ± 4 nm for the cylindrical lens setup.
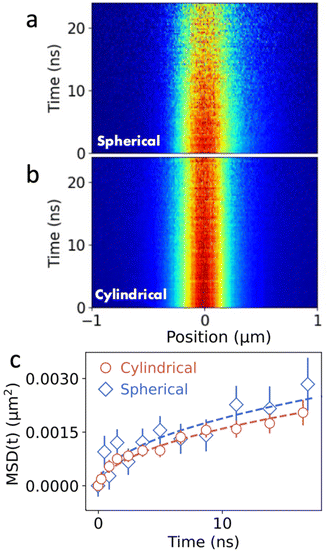
The ability to resolve the displacement of excitons is primarily determined by the SNR in the experiment. While excitons in (PEA)2PbI4 diffuse across several hundreds of nm during their lifetime, displacements in other systems are often much smaller. An example of such a system are colloidal quantum-dot thin films in which transport of excitons relies on Förster-mediated energy transfer between individual quantum dots in the lattice. Fig. 4 shows the comparison of the MSD as a function of time between the spherical and cylindrical lens setup. Comparing Fig. 4a and b, a clear improvement in the SNR is observed when using the cylindrical lens setup. Importantly, even though the broadening of the population in both diffusion maps is much less pronounced than for the perovskite materials, a clear broadening can be observed in the corresponding MSD curves (see Fig. 4c). In the case of the QDs, the MSD shows a clear sub-linear behaviour, indicative of subdiffusive transport (see Fig. 4c). Subdiffusion of carriers in QD solids is commonly observed and is caused by polydispersity in the QD ensemble leading to a disordered energy landscape.2 To quantify the subdiffusive behaviour, we use a power law (MSD(t) = 2Dtα). From the fits we obtain D = 0.003 ± 0.002 cm2 s−1 and D = 0.003 ± 0.001 cm2 s−1 in the spherical and cylindrical lenses, respectively. Corresponding diffusion lengths that are obtained from these measurements are LD = 41 ± 6 nm for the spherical and LD = 40 ± 5 nm for the cylindrical lens setup. With the cylindrical lens setup, a single measurement provides higher accuracy for both the diffusion length and the diffusivity (see Fig. S4 and S6†).
Conclusion
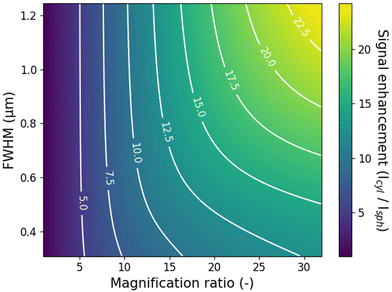
We have demonstrated a simple method to improve the data acquisition efficiency in Transient Microscopy measurements for materials with isotropic diffusion in the x–y plane using cylindrical lenses. The intensity enhancement for the specific examples in this work is around 10-fold, reducing the needed acquisition time for measurements with equal SNR by the same amount. Importantly, further improvements in the intensity enhancement can be achieved using larger focal length ratios for the two cylindrical lenses, as well as using higher quality lenses. In the presented work, the combination of the two cylindrical lenses (f1 = 400 mm, f2 = 20 mm) was chosen for practical reasons to fit the existing path-length between microscope and detector. Naturally, if chosen freely, larger focal length ratios will yield larger compression along the x-axis and further improved intensity enhancement. Crucially though, the current setup employs a f2 = 20 mm focal length lens with a diameter of 25 mm as the short focal length cylindrical lens, resulting in a small f-number and relatively poor quality of the focus. This limitation is clear when comparing the theoretical demagnification (400/20 = 20) and the experimentally obtained demagnification of around 12. Larger f-numbers on both cylindrical lenses would further improve the experimental intensity enhancement and the improvement in the signal collection, although at the cost of a longer optical path of the total setup. Importantly, the intensity enhancement for the cylindrical lens setup also depends on the diffusion length of the carriers in the specific material under study. For materials with long diffusion lengths, larger enhancements can be obtained as the carriers diffuse farther away from the axis of measurement in the conventional spherical lens setup. We simulate the maximum enhancement for different time-integrated population distributions and different magnification ratios for a given detector size (here taken as d0 = 20 μm) and fixed y-axis magnification (My ∼ 400). The results displayed in Fig. 5 are obtained considering a Voigt population distribution, although similar values were obtained with a Gaussian distribution, see Fig. S7.† Enhancements of up to 25 times are achievable for example for a magnification ratio of 30 and a relatively long diffusion length with a full-width-at-half-maximum (FWHM) of 1.2 μm. Simulations of the dependence of the signal enhancement on more general system parameters are shown in Fig. S8.†Finally, it is worth mentioning that the use of cylindrical lenses can benefit to other Transient Microscopy techniques beyond TPLM, including for example Transient Absorption Microscopy or Transient Scattering Microscopy (i.e. stroboSCAT).15 The improved SNR in these types of measurements will help to reduce data acquisition times and sample degradation, and may help resolve details of the transport dynamics at longer times when the decay of the carrier population reduces the signal strength.
Author contributions
AJM, MS, and FP designed the project. AJM built the optical setup and performed measurements with assistance of MMC and JJS. AJM, MS, MM, and RD-B analyzed the results. FP supervised the project. All authors contributed to the discussion of the results and to the revision of the paper.Conflicts of interest
The authors declare no conflict of interest.Acknowledgements
We acknowledge the support from the “(MAD2D-CM)-UAM” project funded by Comunidad de Madrid, by the Recovery, Transformation and Resilience Plan, and by NextGenerationEU from the European Union, as well as from the Spanish Ministry of Science and Innovation under grant agreement TED2021-131018B-C21 and through the Ramón y Cajal program (F.P. RYC-2017-23253).References
- G. M. Akselrod, P. B. Deotare, N. J. Thompson, J. Lee, W. A. Tisdale, M. A. Baldo, V. M. Menon and V. Bulovic, Nat. Commun., 2014, 5, 3646 CrossRef CAS PubMed.
- G. M. Akselrod, F. Prins, L. V. Poulikakos, E. M. Y. Lee, M. C. Weidman, A. J. Mork, A. P. Willard, V. Bulović, W. A. Tisdale, V. Bulovic and W. A. Tisdale, Nano Lett., 2014, 14, 3556–3562 CrossRef CAS PubMed.
- E. Penzo, A. Loiudice, E. S. Barnard, N. J. Borys, M. J. Jurow, M. Lorenzon, I. Rajzbaum, E. K. Wong, Y. Liu, A. M. Schwartzberg, S. Cabrini, S. Whitelam, R. Buonsanti and A. Weber-Bargioni, ACS Nano, 2020, 14, 6999–7007 CrossRef CAS PubMed.
- A. J. Goodman, D. H. Lien, G. H. Ahn, L. L. Spiegel, M. Amani, A. P. Willard, A. Javey and W. A. Tisdale, J. Phys. Chem. C, 2020, 124, 12175–12184 CrossRef CAS.
- M. Kulig, J. Zipfel, P. Nagler, S. Blanter, C. Schüller, T. Korn, N. Paradiso, M. M. Glazov and A. Chernikov, Phys. Rev. Lett., 2018, 120, 207401 CrossRef CAS PubMed.
- M. Seitz, A. J. Magdaleno, N. Alcázar-Cano, M. Meléndez, T. J. Lubbers, S. W. Walraven, S. Pakdel, E. Prada, R. Delgado-Buscalioni and F. Prins, Nat. Commun., 2020, 11, 1–8 CrossRef PubMed.
- J. D. Ziegler, J. Zipfel, B. Meisinger, M. Menahem, X. Zhu, T. Taniguchi, K. Watanabe, O. Yaffe, D. A. Egger and A. Chernikov, Nano Lett., 2020, 20, 6674–6681 CrossRef CAS PubMed.
- W. Li, M. S. R. Huang, S. K. Yadavalli, J. D. Lizarazo Ferro, Y. Zhou, A. Zaslavsky, N. P. Padture and R. Zia, ACS Photonics, 2019, 6, 2375–2380 CrossRef CAS.
- M. I. Saidaminov, K. Williams, M. Wei, A. Johnston, R. Quintero-Bermudez, M. Vafaie, J. M. Pina, A. H. Proppe, Y. Hou, G. Walters, S. O. Kelley, W. A. Tisdale and E. H. Sargent, Nat. Mater., 2020, 19, 412–418 CrossRef CAS PubMed.
- N. S. Ginsberg and W. A. Tisdale, Annu. Rev. Phys. Chem., 2020, 71, 1–30 CrossRef CAS PubMed.
- S. Deng, E. Shi, L. Yuan, L. Jin, L. Dou and L. Huang, Nat. Commun., 2020, 11, 1–8 CrossRef PubMed.
- A. J. Magdaleno, M. Seitz, M. Frising, A. Herranz de la Cruz, A. I. Fernández-Domínguez and F. Prins, Mater. Horiz., 2021, 8, 639–644 RSC.
- M. Seitz, M. Meléndez, N. Alcázar–Cano, D. N. Congreve, R. Delgado–Buscalioni and F. Prins, Adv. Opt. Mater., 2021, 2021, 2001875 CrossRef.
- C. L. Hickey and E. M. Grumstrup, J. Phys. Chem. C, 2020, 124, 14016–14021 CrossRef CAS.
- M. Delor, H. L. Weaver, Q. Q. Yu and N. S. Ginsberg, Nat. Mater., 2020, 19, 56–62 CrossRef CAS PubMed.
Footnote |
| † Electronic supplementary information (ESI) available. See DOI: https://doi.org/10.1039/d3nr03587e |
| This journal is © The Royal Society of Chemistry 2023 |

