Molecular understanding of the impacts of structural characteristics on ethanol adsorption performance for adsorption heat pumps†
Wei
Li
 a,
Zhilu
Liu
 b,
Weixiong
Wu
a and
Song
Li
 *b
*b
aEnergy & Electricity Research Center, Jinan University, Zhuhai, 519070, China
bDepartment of New Energy Science and Engineering, School of Energy and Power Engineering, Huazhong University of Science and Technology, Wuhan 430074, China. E-mail: songli@hust.edu.cn
First published on 1st February 2023
Abstract
Adsorption heat pumps (AHPs) powered by low-grade waste heat or renewable energy can reduce electricity consumption and carbon emission. The exploration of the high-performing adsorbents of AHPs is the key to improving their coefficient of performance (COP) by tuning their adsorption capacity and step location. The structure–property relationship of adsorbents can provide useful guidance for developing and designing potential adsorbents for AHPs. However, given the complexity of the chemical composition and structural diversity of adsorbents, it is extremely challenging to extract the structure–property relationship from high-throughput computational screening based on molecular simulations of existing adsorbents. In this study, ideal nanoporous crystal structures comprising Lennard-Jones (LJ) spheres were generated to simplify this process. The effects of pore size and LJ interaction parameters (σ and ε) on the adsorption performance of the structures, including the saturation uptake (Ws), step location of adsorption isotherms (α) and the uptake change at step location (Wα), were investigated by grand canonical Monte Carlo (GCMC) simulations. It was demonstrated that large σ, ε and cell length or pore size are favorable for Ws and Wα. 0 < α < 0.4 is favorable for Ws and Wα for small-pore structures, and 0.6 < α < 1 is preferential for large-pore structures, which can be attributed to the strong interaction strength of small-pore structures and the relatively weak interaction in large-pore structures. Given the various optimal pore sizes of Ws and Wα, developing an effective strategy to simultaneously improve Ws and Wα by tuning the structural properties of adsorbents is key in the future.
Design, System, ApplicationThe structure–property relationship extracted from 3718 ideal nanoporous crystal structures can guide the future design of high-performing adsorbents with improved ethanol adsorption performance for adsorption heat pumps. |
1. Introduction
Global building energy consumption, especially space heating and cooling, dominates approximately 40% of the total energy, which is also responsible for almost 30% of greenhouse gas emissions.1 A considerable amount of low-grade thermal energy is released to the ambient environment,2 approximately twice the building energy consumption.3 To save electricity, such low-grade thermal energy can be utilized in adsorption heat pumps (AHPs) for heating and cooling. AHPs powered by solar energy or waste heat have been proposed for several decades.4,5 However, the unsatisfactory energy efficiency (i.e., coefficient of performance, COP) of AHPs due to the low adsorption capacity of adsorbents and unfavorable adsorption isotherms significantly limits their wide application.1,6One possible way to improve the COP is to explore adsorbents with outstanding adsorption capacity and suitable adsorption isotherm.7 Recently, several high-performing adsorbents in AHPs have been reported, most of which are metal–organic frameworks (MOFs)8,9 that can be formulated as coatings or pellets in the adsorbent bed.10,11 MOFs are crystalline nanoporous materials composed of metal nodes and organic linkers,12 which possess many advantageous properties, including the large pore volume, ultra-high surface area, and tunable structure, that are favorable for gas adsorption.1 MOFs have been reported as potential adsorbents with significantly high adsorption capacity of working fluids (i.e., water, methanol, and ethanol). MIL-101(Cr) was reported to exhibit the highest water uptake (∼1.2 g g−1) at 298 K and 5.6 kPa.13 However, it was recently surpassed by another MOF (Cr-soc-MOF-1), exhibiting ∼2.0 g g−1 water uptake at 298 K and 2.65 kPa.14 Moreover, MOF-74 exhibited 1.0 g g−1 methanol uptake with remarkably high stability, indicating its great application potential in AHPs.15 It was suggested that the working capacity, which is the uptake difference between the adsorption and desorption processes, determines the amount of allocatable heat per working cycle, which is more crucial in determining the COP of AHPs7 than the maximum uptake or saturation adsorption capacity.7 Mg-VNU-74-II with a methanol working capacity of 0.41 cm3 cm−3 between 298 K and 355 K exhibits a COP of 0.82.15 Furthermore, it is demonstrated that adsorbents with stepwise adsorption isotherms are desirable, which enables a large loading lift upon a small pressure change, indicating enhanced heat and mass transfer.11,16 The step location (α) of the stepwise adsorption isotherm is attributed to the rapidly increasing uptake at the relative pressure (P/P0), which is related to the applicable working conditions of AHPs.1,17 It is also noted that the step location and uptake pressure range should be tunable depending on the desired working conditions.11 It is suggested that adsorbents with α < 0.05, 0.1 < α < 0.3, 0.15 < α < 0.5, and 0.45 < α < 0.6 at room temperature are preferred for dehumidification, heat pumps, desalination and humidity control, respectively.18 Hence, the step location of the adsorption isotherm plays critical roles during the designing and choosing of the adsorbents.19,20 Our recent study reveals that there are optimal step locations for adsorbents at specific working conditions, which is 0.07 < α < 0.18 for typical heating, 0.06 < α < 0.29 for cooling and 0.04 < α < 0.13 for ice making.17 Hence, it is a challenging task to develop high-performing adsorbents with higher saturation capacity, larger working capacity and suitable step location for AHPs.
However, how can we choose a suitable candidate from many existing MOFs by considering all the abovementioned characteristics, including saturation capacity, working capacity and step location? It has been validated that high-throughput computational screening (HTCS) is a high-efficiency approach for identifying potential MOFs for H2 storage,21 CO2 capture,22 and Xe/Ke separation,23 which is also widely adopted in AHPs. Erdős et al. carried out HTCS of CoRE (Computational-Ready Experimental) MOFs for AHPs7 in which six promising MOFs were selected based on their methanol uptake change at step location (Wα) and step location of adsorption isotherm instead of COP.7 We performed a HTCS of 2932 CoRE MOFs and 275 CoRE COFs (covalent-organic frameworks) by directly predicting the COP of each working pair based on the working capacity and average enthalpy of adsorption (<ΔadsH>) of ethanol. Eventually, 26 MOFs and 32 COFs with COPC larger than 0.8 are selected for cooling, most of which possess a high saturation capacity (i.e. ∼0.3 g g−1), larger deliverable working capacity (>0.2 g g−1) and suitable step location (0.2 < α < 0.3).25,26 Moreover, it was demonstrated that the medium pore size and suitable host–adsorbate interaction are favorable for working capacity and stepwise adsorption isotherm, which eventually benefits the COP. To date, nearly 90![[thin space (1/6-em)]](https://www.rsc.org/images/entities/char_2009.gif) 000 MOFs27 and 280 COFs28 have been synthesized, and over 600
000 MOFs27 and 280 COFs28 have been synthesized, and over 600![[thin space (1/6-em)]](https://www.rsc.org/images/entities/char_2009.gif) 000/470
000/470![[thin space (1/6-em)]](https://www.rsc.org/images/entities/char_2009.gif) 000 hypothetical MOFs/COFs have been generated, along with numerous zeolites and composite materials. Given the many adsorbent materials, predicting the AHP performance of these adsorbents seems a formidable task.
000 hypothetical MOFs/COFs have been generated, along with numerous zeolites and composite materials. Given the many adsorbent materials, predicting the AHP performance of these adsorbents seems a formidable task.
Hence, the structure–property relationship urgently needs to be clarified to guide the discovery and design of high-performing adsorbents. However, the structure diversity27 of both CoRE MOFs and hypothetical MOFs complicates the structure–property relationship extraction process. To generalize the correlation between MOF structures and their adsorption performance, the simplified pseudo nanoporous models comprising Lennard-Jones (LJ) spheres were generated.29 Babaei et al. created several idealized (pseudo) MOFs consisting of LJ spheres and investigated the effect of pore size and shape on the thermal conductivity of MOFs.30 In this study, to explore the structure–property relationship of MOFs for AHPs, we generated pseudo nanoporous structures with tunable pore size and LJ interaction. Ethanol was taken as a working fluid owing to its high vapor pressure that favors heat and mass transfer and the reasonable computational cost for simulating ethanol adsorption by molecular simulation, especially compared with water.25 Moreover, the stability of MOFs in water under operational conditions of over thousands of cycles is a major challenge during application.18,31 Most MOFs were stable in ethanol because they were frequently used for MOF activation during the preparation process.32,33 To save computational cost, grand canonical Monte Carlo (GCMC) simulations were performed for these generated structures to obtain the saturation capacity (Ws), uptake change at step location (Wα) and step location (α), which can guide the identification and design of high-performing adsorbents for AHPs. The structure–property relationship revealed in this study may provide insightful guidance for designing and discovering high-performance adsorbents for AHPs.
2. Methodology
2.1. Porous crystal construction
Porous crystal models comprising LJ spheres have been adopted and validated in previous studies.30,34,35 In this study, the LJ parameters of these spheres were set based on the UFF force field to present different pseudo atom types. Because the van der Waals radius (σ) and the potential well depth (ε) of atoms in the UFF force field were within 1.052–6.549 Å, and 0.0105–4.2 kJ mol−1, respectively, the ranges of σ and ε were set from 1 to 6 Å and 0.042 to 4.2 kJ mol−1, respectively. In detail, to simulate the different interaction strengths of different-sized atoms in porous structures, 26 values of σ (σ = 1–6 Å with an interval of 0.2 Å) and 11 values of ε (ε = 0.042, 0.084, 0.168, 0.252, 0.336, 0.42, 0.84, 1.68, 2.52, 3.36, 4.2 kJ mol−1) were adopted in this study.As for the structures of pseudo nanoporous crystals, the simple cubic crystal inspired by the IRMOF series was employed to represent the framework, in which the LJ spheres were located in the axis of the crystal lattice shown in Fig. 1a. Because the pore sizes of most experimentally synthesized MOFs are in the range of 5–35 Å,24,27 our pseudo nanoporous structures were built using different numbers of LJ spheres (n = 4, 7,10, 13, 16, 19, 22, 25, 28, 31,34, 37, 40) to create different predefined crystal cell lengths (l = 5, 12.5, 15, 17.5, 20, 22.5, 25, 27.5, 30, 32.5, 35 Å). The representative structures are presented in Fig. 1b–e, in which the spacing between the neighboring LJ spheres is 2.5 Å. In general, 3718 pseudo nanoporous structures were generated by 13 cell lengths (l), 26 van der Waals radii (σ) and 11 potential well depths (ε) for LJ parameters in this study, as shown in Table S1 in ESI.†
 | ||
| Fig. 1 The schematic figure of (a) the supercell of simple cubic crystal and cubic crystal of pseudo materials with l = (b) 5, (c) 7.5, (d) 10 and (e) 35 Å. | ||
2.2. GCMC simulations
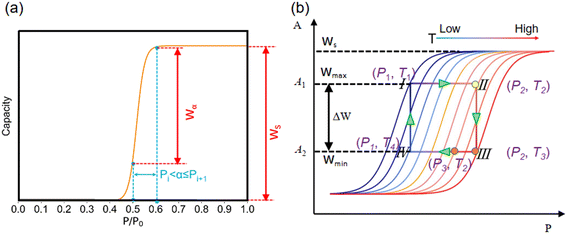
The structure characteristics of these porous structures, including largest cavity diameter (LCD), pore limiting diameter (PLD) and available pore volume (Va), were calculated by Zeo++ 0.3 (ref. 36) with a nitrogen probe radius of 1.82 Å, in which the LJ parameter (σ) was used as van der Waals diameter of the framework atoms.37–39 It was found that the accessible pore width for ethanol molecules should be greater than the dynamic size of ethanol molecules (3.95 Å) based on the TraPPE force field parameters of ethanol. GCMC simulations were carried out using RASPA 1.0 (ref. 40) to obtain the ethanol adsorption performance at a typical temperature of 303 K for adsorption cooling. The transferable potentials for the phase equilibria force field (TraPPE)41 were used for ethanol (Table S2†), and the reliability of TraPPE force fields in describing adsorption properties has been validated in previous studies.42,43 During GCMC simulations, four types of Monte Carlo moves, including insertion, deletion, rotation and translation with equal probability, were implemented. A total of 1 × 10⁵ cycles were performed to estimate the adsorption performance, in which 5 × 10⁴ cycles were used for equilibration and another 5 × 10⁴ cycles for production.To obtain the step location (α), saturation uptake (Ws), and uptake change at step location (Wα) at low computational cost, GCMC simulations of 3718 structures were performed at 303 K and P/P0 = 0–1.0 with an interval of 0.1. Thus, 10 GCMC simulations of each structure were conducted at P/P0 = 0.1, 0.2, 0.3, 0.4, 0.5, 0.6, 0.7, 0.8, 0.9 and 1.0 based on which the adsorption isotherm at 303 K was obtained. As demonstrated in Fig. 2a, the schematic adsorption isotherm comprises ten adsorption capacities at varying pressures, in which Ws is the saturation adsorption capacity at the saturation pressure of P/P0 = 1.0 or P0 = 10.3 kPa. Herein, α is defined as the pressure range at which the maximum uptake change is achieved. In detail, ten uptake changes (Wi+1 − Wi) under a pressure interval of P/P0 = 0.1 were calculated. Herein, α is defined as the pressure range instead of the pressure point at which the maximum uptake change is achieved. Thus, the step location α was defined as Pi < α ≤ Pi+1 when the corresponding uptake change (Wi+1 − Wi) achieves the maximum (Wα). Detailed uptake changes at varying pressure ranges are shown in Table S3 and Fig. S1.†
2.3. Theoretical analysis of the ideal adsorption heat pump
Notably, the working principle of an ideal adsorption heat pump (Fig. 2b) at typical conditions comprises four steps: 1) isosteric heating (I–II), in which the temperature and pressure of adsorbent are increased (from T1 = 303 K to T2 = 325 K and from P1 = 3000 Pa to P2 = 10![[thin space (1/6-em)]](https://www.rsc.org/images/entities/char_2009.gif) 300 Pa) without desorption at maximum loading (Wmax); 2) isobaric desorption (II–III), in which the temperature continues to increase at a fixed pressure (i.e., from 325 K to T3 = 353 K at 10300 Pa) and the desorption of working fluids from the adsorbent; 3) isosteric cooling (III–IV), in which both the temperature and pressure decreased (i.e., from 353 K to T4 = 328 K and from 10
300 Pa) without desorption at maximum loading (Wmax); 2) isobaric desorption (II–III), in which the temperature continues to increase at a fixed pressure (i.e., from 325 K to T3 = 353 K at 10300 Pa) and the desorption of working fluids from the adsorbent; 3) isosteric cooling (III–IV), in which both the temperature and pressure decreased (i.e., from 353 K to T4 = 328 K and from 10![[thin space (1/6-em)]](https://www.rsc.org/images/entities/char_2009.gif) 300 Pa to 3000 Pa) at minimum loading (Wmin); 4) isobaric adsorption (IV–I), in which the temperature continues to decrease at a fixed pressure (i.e., from 328 K to 303 K at 3000 Pa), and the working fluids were adsorbed. The working capacity (ΔW) is the uptake difference (Wmax − Wmin) between the maximum isostere at the adsorption stage I–II (i.e., T2 = 325 K and P2 = 10
300 Pa to 3000 Pa) at minimum loading (Wmin); 4) isobaric adsorption (IV–I), in which the temperature continues to decrease at a fixed pressure (i.e., from 328 K to 303 K at 3000 Pa), and the working fluids were adsorbed. The working capacity (ΔW) is the uptake difference (Wmax − Wmin) between the maximum isostere at the adsorption stage I–II (i.e., T2 = 325 K and P2 = 10![[thin space (1/6-em)]](https://www.rsc.org/images/entities/char_2009.gif) 300 Pa) and the minimum isostere at desorption stage III–IV (i.e., T3 = 353 K and P2 = 10
300 Pa) and the minimum isostere at desorption stage III–IV (i.e., T3 = 353 K and P2 = 10![[thin space (1/6-em)]](https://www.rsc.org/images/entities/char_2009.gif) 300 Pa).1 Herein, the orange point (P3, T2) with minimum adsorption potential A2 or uptake Wmin is highlighted because it is located in the same isotherm as II (P2, T2) and maximum A1 or Wmax. Thus, the working capacity (ΔW) can be expressed as the uptake difference between pressure P2 and P3 of a single isotherm, i.e., ΔW = f(T2, P2) − f(T2, P3), which is discussed later.
300 Pa).1 Herein, the orange point (P3, T2) with minimum adsorption potential A2 or uptake Wmin is highlighted because it is located in the same isotherm as II (P2, T2) and maximum A1 or Wmax. Thus, the working capacity (ΔW) can be expressed as the uptake difference between pressure P2 and P3 of a single isotherm, i.e., ΔW = f(T2, P2) − f(T2, P3), which is discussed later.
It has been validated that Dubinin–Astakhov (DA) equation44 can predict the adsorption performance of adsorbents over a wide range of temperatures and pressures. Herein, the DA equation was used to derive the potential working capacity of the adsorbents based on a single isotherm. In theory, the uptake of adsorbents can be described by the DA equation as follows:
 | (1) |
![[thin space (1/6-em)]](https://www.rsc.org/images/entities/char_2009.gif) ln(P/P0) is the adsorption potential, R is the gas constant, E is the characteristic energy and n is a dimensionless parameter44 and Ws is saturation uptake. Because E and n are constants for specific adsorption isotherm, the uptake can be rewritten as follows: W/Ws = f(A(P, T)). Thus, the working capacity (ΔW) that is the transferred amount of ethanol between the adsorption and desorption processes of AHPs could be simplified as follows: ΔW/Ws = f(A1(P2, T2)) − f(A2(P2, T3)). According to Fig. 2a, this equation can be also expressed as ΔW/Ws = f(A1(P2, T2)) − f(A2(P3, T3)), which is the uptake change at different pressures. Moreover, because Wα is the maximum uptake change at step location α under a pressure interval of P/P0 = 0.1, Wα can be written as Wα/Ws = f(A1(P2 + 0.1P0, T2)) − f(A2(P2, T2)). Although Wα is not working capacity at this given working condition, it can be taken as working capacity at specific working conditions to meet the requirements for AHPs. This is because a large loading lift with a small adsorption potential change is favored. Thus, Wα becomes an indicator of the potential working capacity within a narrow chemical potential range, which can evaluate the working capacity of an adsorbent with only a single isotherm provided.
ln(P/P0) is the adsorption potential, R is the gas constant, E is the characteristic energy and n is a dimensionless parameter44 and Ws is saturation uptake. Because E and n are constants for specific adsorption isotherm, the uptake can be rewritten as follows: W/Ws = f(A(P, T)). Thus, the working capacity (ΔW) that is the transferred amount of ethanol between the adsorption and desorption processes of AHPs could be simplified as follows: ΔW/Ws = f(A1(P2, T2)) − f(A2(P2, T3)). According to Fig. 2a, this equation can be also expressed as ΔW/Ws = f(A1(P2, T2)) − f(A2(P3, T3)), which is the uptake change at different pressures. Moreover, because Wα is the maximum uptake change at step location α under a pressure interval of P/P0 = 0.1, Wα can be written as Wα/Ws = f(A1(P2 + 0.1P0, T2)) − f(A2(P2, T2)). Although Wα is not working capacity at this given working condition, it can be taken as working capacity at specific working conditions to meet the requirements for AHPs. This is because a large loading lift with a small adsorption potential change is favored. Thus, Wα becomes an indicator of the potential working capacity within a narrow chemical potential range, which can evaluate the working capacity of an adsorbent with only a single isotherm provided.
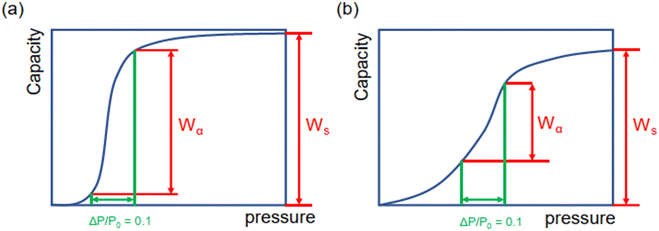
Moreover, as illustrated in Fig. 3, the ratio of Wα/Ws can represent the shape of the adsorption isotherm and the degree of uptake variation at step locations. If Wα is approximated to Ws, the high Wα/Ws corresponds to the very steep uptake at step location and indicates the high working capacity (ΔW), which favors cooling performance and vice versa.
3. Results and discussion
3.1. Structure–property relationship
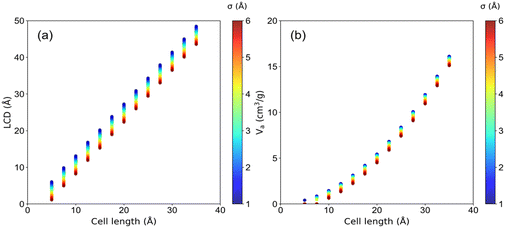
The structural characteristics of these pseudo nanoporous crystals shown in Fig. 4 indicate that LCD almost linearly depended on the cell length (l), which slightly decreased with the increase of the LJ sphere's van der Waals radius (σ). Moreover, the structures with large σ possess non-available pore volume (structures with l = 5 Å and σ > 1.2 Å, and those with l = 7.5 Å and σ > 4.2 Å). Hence, the ethanol adsorption performance of these structures was not considered in the following analysis.It is well documented that sufficient loading and large saturation uptake (Ws) of adsorbents are essential for AHPs.1,45,46 Hence, the correlation between Ws and crystal cell length (l) for LJ interaction parameters (σ and ε) is presented in Fig. 5. Notably, although the structures with 13 different cell lengths were constructed in this study, only four representative cell lengths (l = 5, 7.5, 10 and 35 Å) are shown in Fig. 5, and the rest are presented in Fig. S2.† It was found that the structures with high Ws exhibited a maximum Ws of 0.29 g g−1 (l = 5), 0.54 g g−1 (l = 7.5), 1.06 g g−1 (l = 10) and 3.95 g g−1 (l = 35 Å), at specific cell lengths (Fig. 5). Considering Fig. S2,† it can be found that, in general, the maximum Ws increased with l until Ws = 4.84 g g−1 at l = 27.5 Å and then decreased. This tendency is probably due to the structures with small l and pore volume Va (illustrated in Fig. 4), which limits the improvement of Ws. With increased cell length, more structures with high Ws were observed with increased σ. Except for the structures with remarkably high Ws, many structures exhibit significantly low Ws. In detail, for structures with l = 5 Å, the preferential σ of 1–1.2 Å and ε of 2.52–4.2 kJ mol−1 were observed for structures with Ws close to 0.29 g g−1. However, the preferential σ and ε are in the range of 1.2–4 Å and 0.42–4.2 kJ mol−1, respectively, for l = 7.5 Å, σ = 2–6 Å and ε = 0.42–4.2 kJ mol−1 for l = 10 Å, and σ = 6 Å and ε = 4.2 kJ mol−1 for l = 35 Å. It can be found that for the structures with high Ws, the high σ and ε were favored with increasing cell length to satisfy the interaction strength requirement for ethanol adsorption.
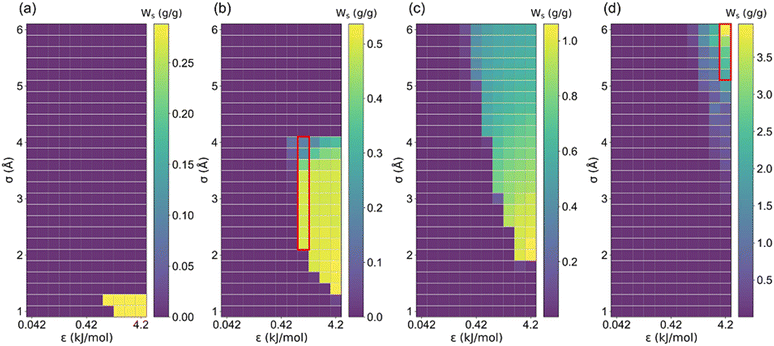 | ||
| Fig. 5 The relationship between saturation uptake (Ws) and LJ parameters (σ and ε) in (a) l = 5, (b) l = 7.5, (c) l = 10 and (d) l = 35 Å structure. | ||
Step location (α) plays a vital role in identifying promising adsorbents for AHPs.17 It was observed that α < 0.05 is the optimal step location for dehumidification, 0.1 < α < 0.3 is optimal for heat pump and water harvester, 0.15 < α < 0.5 is optimal for desalination, and 0.45 < α < 0.65 is optimal for humidity control.18,47 Hence, the correlation between the step locations of these structures and the LJ parameters is presented in Fig. 6. Notably, structures (σ ≥ 1.4 Å for l = 5 Å; σ ≥ 4 Å for l = 5 Å) with non-available pore volumes are excluded. It can be found that there is an unclear trend in α distribution for those structures with significantly low Ws. For the structure with high Ws, their step location is small (0 < α ≤ 0.2). For the structures with small cell lengths (Fig. 6a–c), the preferred step is 0 < α ≤ 0.1. For structures with large cell lengths, a large step location (0.6 < α < 1) is preferred for high saturation uptake (Ws) (Fig. 6d and S3†). This trend may be attributed to the multi-stage adsorption isotherm (i.e., type VI isotherm) of the structures with a large cell length, which is discussed later.
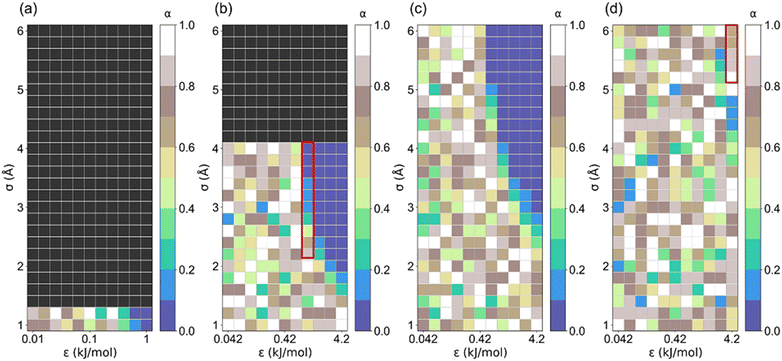 | ||
| Fig. 6 The correlation between step location (α) and LJ parameter (σ and ε) for (a) l = 5, (b) l = 7.5, (c) l = 10 and (d) l = 35 Å structures. | ||
The uptake change (Wα) at step location related to the maximum working capacity in AHPs was also investigated. As aforementioned, if Wα is approximate to Ws or Wα/Ws = 1, the isotherm tends to be intensely steep, and vice versa. As shown in Fig. 7 and S4,† the maximum Wα increased with cell length until 2.88 g g−1 and then decreased, similar to the trend of Ws. However, it was found that the optimal cell length for the maximum Wα is 20 Å, which is smaller than the optimal cell length for the maximum Ws (27.5 Å). Furthermore, as depicted in Table S4,†Wα/Ws decreased from 0.99 to 0.25 with an increased cell length, suggesting that the stepwise adsorption isotherm transforms to a non-stepwise or multi-stage adsorption isotherm in large-pore structures. Such results agree with the adsorption isotherm defined by IUPAC for existing porous materials,48 in which type I isotherms are preferred for small-pore materials and type IV and V are favorable for large-pore materials.
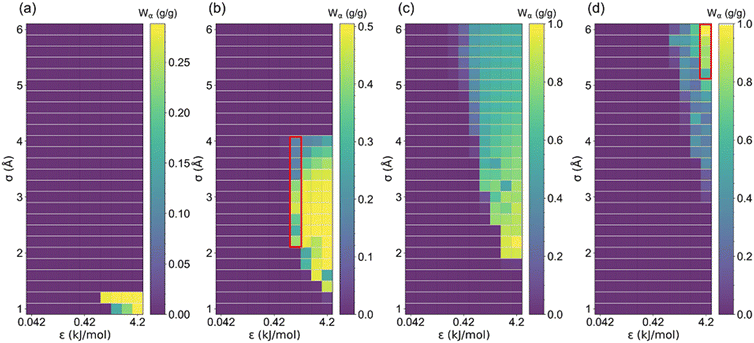 | ||
| Fig. 7 The uptake change at step location (Wα) changed with LJ parameter (σ and ε) for (a) l = 5, (b) l = 7.5, (c) l = 10 and (d) l = 35 Å structures. | ||
In order to clearly presented the optimal step location for large Wα (Wα ≥ 0.1 g g−1), structures satisfying Wα < 0.1 g g−1 were colored white, and the rest structures were colored by α, as presented in Fig. S5 and S6.† The percentage of the number of rest structures for each cell length is presented in Table S5,† in which the majority of the structures exhibit cell length of 10 and 15 Å. Such results indicate that the relatively small-pore structures tend to exhibit large Wα. Thus, based on a previous study, CoRE MOFs with LCD = 10–15 Å and ΔW > 0.2 g g−1 perform better in ethanol-based AHPs.25 Moreover, as demonstrated in Fig. 5–7, for small-pore structures with high Ws, taken 2 < σ ≤ 4 Å, ε = 1.68 kJ mol−1, and l = 7.5 Å as an example, the increase in σ leads to the decrease in step locations without any variation in Ws, while the Wα significantly decreases when σ > 3.2 Å. As for large-pore structures (i.e., 5 < σ ≤ 6 Å, ε = 4.2 kJ mol−1, and l = 35 Å), the increase in σ significantly improves Ws and Wα. Thus, for the relatively small pore-size structures, 0 < α < 0.2 is favorable for Wα and Ws, while for the relatively large pore-size structures, 0.6 < α < 1 is preferential for Wα and Ws.
3.2. Insight into adsorption properties
Because the LJ parameters of pseudo atoms affect the host–adsorbate interaction strength that dominates the ethanol adsorption performance, the relationship between host–adsorbate interaction (Qhost–ad) and saturation uptake (Ws) was investigated, as illustrated in Fig. 8 and S7.† Except for those structures with a non-available pore volume (l = 5 Å, σ > 1.2 Å; l = 7.5 Å, σ > 4.2 Å), the increase in σ and ε significantly improves the Qhost–ad for the structures with l ≤ 20 Å. It was found that the maximum Qhost–ad (∼70 kJ mol−1) was reached at l = 10 Å, σ = 6 Å and ε = 4.2 kJ mol−1. In contrast, for the structures with l > 20 Å, the Qhost–ad interaction for l > 20 Å is 10–22 kJ mol−1, which can be attributed to the weak interaction towards ethanol of the large-pore structures.49,50 In addition, the adsorbate–adsorbate (Qad–ad) interaction for all structures (Fig. S8 and S9†) is about 35 kJ mol−1. Therefore, the host–adsorbate interaction dominates the total interaction in small-pore structures (l ≤ 20 Å). However, the Qad–ad interaction plays a relatively important role in large-pore structures. It is noteworthy that for structures with high Ws and Wα, the total interaction (Qhost–ad + Qad–ad) is large than the enthalpy of vaporization of ethanol (42.3 kJ mol−1) at 298 K. It was observed that Qhost–ad for the structures with notoriously low Ws and Wα is smaller than 20 kJ mol−1, while for the structures with Ws and Wα greater than 0.1 g g−1, their Qhost–ad is over 20 kJ mol−1 to ensure sufficient ethanol adsorption.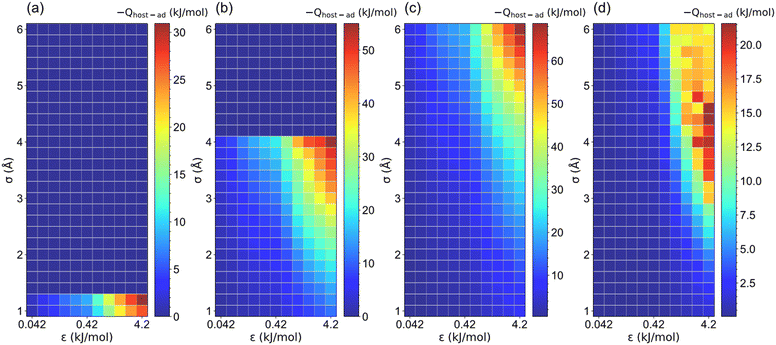 | ||
| Fig. 8 The host–adsorbate interaction (Qhost–ad) between pseudo material and ethanol under various LJ parameters (σ and ε) for (a) l = 5, (b) l = 7.5, (c) l = 10 and (d) l = 35 Å structures. | ||
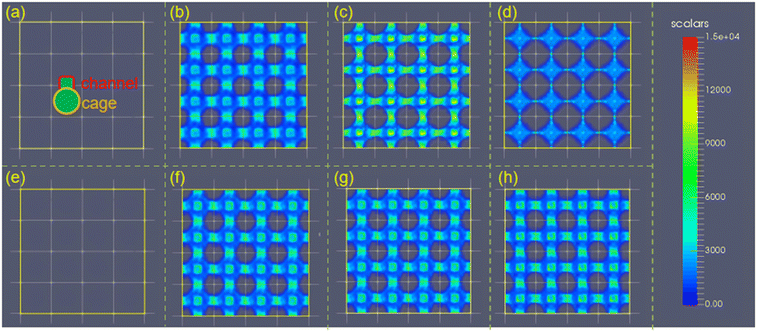
The ethanol adsorption density distribution of the structures with varying σ and ε (Fig. 9a and b) demonstrated that large σ (i.e., σ = 2–4 Å for l = 7.5 Å) is required for high ethanol uptake. The ultra-large van der Waals radius σ (i.e., σ = 4 Å for ε = 2.52 kJ mol−1 and l = 7.5 Å) may weaken the interaction strength by reducing the available adsorption sites (Fig. 9c and d). Moreover, the increase in ε enhances the interaction with ethanol, leading to ethanol molecule adsorption in the cage and channel (Fig. 9e and f). In addition, the increase in ε does not change the ethanol density in the structures, while the ethanol density is significantly reduced at large σ (4 Å). Hence, σ plays a more important role in ethanol density distribution in a small-pore-size structure.
Furthermore, the effect of pore size or the cell length of the structures on ethanol density distribution is more complicated. As presented in Fig. 10, there was no ethanol adsorption in the structure with l = 5 Å owing to the non-available pore volume. When the cell length increased to l = 7.5 Å, the highest adsorption density was observed in the cages and channels. When l > 7.5 Å, the increase in cell length remarkably reduces the ethanol uptake and density. Moreover, for structures with l ≥ 15 Å, only a small amount of ethanol molecules was adsorbed near the pseudo atoms. This is due to the low host–adsorbate interaction of 10–20 kJ mol−1 that cannot ensure ethanol adsorption in the cage, suggesting that a large pore size is unfavorable for ethanol adsorption.
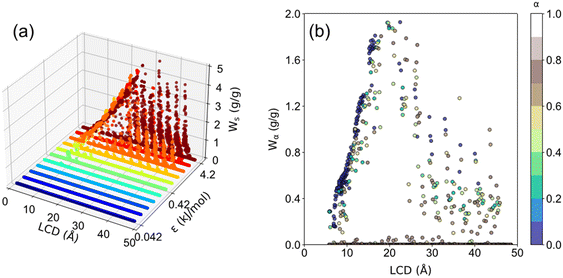
The ethanol adsorption performance, including Ws, Wα, and α of all 3718 structures, is presented in Fig. 11. It was found that structures with ε < 0.42 kJ mol−1 barely adsorb ethanol. As for the structures with ε ≥ 0.42 kJ mol−1, as ε increases, Ws increases. Moreover, the optimal LCD for Ws is 27.5 Å with a maximum Ws of approximately 5 g g−1. This result suggests a tradeoff between interaction strength and pore size. In principle, a large ε indicates the strong interaction strength, and a large σ indicates the large framework atom/linker size, leading to a smaller pore size. Strong host–adsorbate interaction favors the adsorption capacity. However, too small pore size or σ limits the available space for gas adsorption. Too large pore size or σ is unfavorable for adsorption capacity owing to the significantly weakened interaction strength in the space away from the pore surface. Thus, a tradeoff between interaction strength and pore size can be observed. As shown in Fig. 11b, it was found that Wα increases with LCD until ∼20 Å and then decreases. For structures with LCD ≤ 20 Å at high ε, most of them exhibit a step location of 0 < α < 0.4 with Wα ranging from 0 to 2.0 g g−1. For LCD > 20 Å, the preferential step location is 0.5 < α < 0.9. Moreover, it is noteworthy that the maximum Wα is about 2.0 g g−1, which is smaller than the maximum Ws (∼5 g g−1), suggesting that there is still great potential to improve Wα for improved AHP performance. Furthermore, the optimal LCD for Wα is 20 Å, which is smaller than the optimal LCD for maximum Ws (30 Å), indicating that it is an imperative challenge to achieve both satisfactory Wα and Ws by tuning the structural properties of adsorbents, which requires further in-depth exploration in the future.
4. Conclusion
To design and discover adsorbents for AHPs, GCMC simulations were performed to obtain the ethanol adsorption performance of 3718 ideal nanoporous structures comprising LJ spheres. The structure–property relationship, especially the effects of crystal cell length (l) and LJ interaction parameters (σ and ε) on the saturation uptake of ethanol (Ws), step location (α) and uptake change at step location (Wα) was investigated. It is found that both large σ and ε are favorable for Ws and Wα. Both Ws and Wα increase with cell length or pore size and then decrease, and the maximum Ws of 4.84 g g−1 was observed at l = 27.5 Å. The maximum Wα of 2.88 g g−1 was observed at l = 20.0 Å. A similar trend was observed for their host–adsorbate interaction, suggesting that the variation in σ, ε and cell length affects ethanol adsorption through tuning the host–adsorbate interaction within porous structures. Similarly, the shape of the adsorption isotherms is also affected by the three factors. It is found that 0 < α < 0.2 is favorable for Wα and Ws for small-pore structures, indicating the high Wα/Ws and stepwise adsorption isotherm, which is attributed to the strong interaction strength towards ethanol in small-pore structures. However, 0.6 < α < 1 is preferential for Wα and Ws of large-pore structures, implying the small Wα/Ws and non-stepwise adsorption isotherms or multistage isotherms, owing to the relatively weak interaction in large-pore structures. More specifically, for structures with LCD ≤ 20 Å, most of them exhibit steps of 0 < α < 0.4 with Wα ranging from 0 to 2.0 g g−1. As for LCD > 20 Å, the preferential step location is 0.5 < α < 0.9. In fact, both Wα and Ws are preferred for AHPs although it seems extremely challenging to improve them simultaneously. The hierarchical pores within one adsorbent may be the key to the future design of high-performing adsorbents. The findings in this study can guide the modification strategy to improve the interaction strength for enhanced ethanol uptake by tuning the structural properties of adsorbents. This study also provides insights into the design and discovery of high-performing adsorbents for ethanol-based AHPs.Conflicts of interest
There are no conflicts to declare.Acknowledgements
This work was supported by National Key Research and Development Program of China (No. 2020YFB1506300). We gratefully acknowledge the financial support from the Fundamental Research Funds for the Central Universities (No. 21621039), GuangZhou Basic and Applied Basic Research Foundation (No. 202201010433) and China Postdoctoral Science Foundation (2021M701413).Notes and references
- M. F. de Lange, K. J. F. M. Verouden, T. J. H. Vlugt, J. Gascon and F. Kapteijn, Chem. Rev., 2015, 115, 12205–12250 CrossRef CAS PubMed.
- C. Forman, I. K. Muritala, R. Pardemann and B. Meyer, Renewable Sustainable Energy Rev., 2016, 57, 1568–1579 CrossRef.
- L. Capuano, International Energy Outlook, 2019 Search PubMed.
- R. E. Critoph and Y. Zhong, Proc. Inst. Mech. Eng., Part E, 2016, 219, 285–300 CrossRef.
- R. Critoph, Int. J. Refrig., 2012, 3, 490–493 CrossRef.
- H. Demir, M. Mobedi and S. Ülkü, Renewable Sustainable Energy Rev., 2008, 12, 2381–2403 CrossRef.
- M. Erdos, M. F. de Lange, F. Kapteijn, O. A. Moultos and T. J. H. Vlugt, ACS Appl. Mater. Interfaces, 2018, 10, 27074–27087 CrossRef CAS PubMed.
- A. Karmakar, V. Prabakaran, D. Zhao and K. J. Chua, Appl. Energy, 2020, 269, 115070 CrossRef CAS.
- R. Al-Dadah, S. Mahmoud, E. Elsayed, P. Youssef and F. Al-Mousawi, Energy, 2020, 190, 116356 CrossRef CAS.
- D. Lenzen, P. Bendix, H. Reinsch, D. Frohlich, H. Kummer, M. Mollers, P. P. C. Hugenell, R. Glaser, S. Henninger and N. Stock, Adv. Mater., 2018, 30, 1705869 CrossRef PubMed.
- D. M. Steinert, S.-J. Ernst, S. K. Henninger and C. Janiak, Eur. J. Inorg. Chem., 2020, 2020, 4502–4515 CrossRef CAS.
- Y. J. Colon and R. Q. Snurr, Chem. Soc. Rev., 2014, 43, 5735–5749 RSC.
- J. Ehrenmann, S. K. Henninger and C. Janiak, Eur. J. Inorg. Chem., 2011, 2011, 471–474 CrossRef.
- S. M. T. Abtab, D. Alezi, P. M. Bhatt, A. Shkurenko, Y. Belmabkhout, H. Aggarwal, Ł. J. Weseliński, N. Alsadun, U. Samin, M. N. Hedhili and M. Eddaoudi, Chem, 2018, 4, 94–105 Search PubMed.
- B. T. Nguyen, H. L. Nguyen, T. C. Nguyen, K. E. Cordova and H. Furukawa, Chem. Mater., 2016, 28, 6243–6249 CrossRef CAS.
- I. S. Glaznev, D. S. Ovoshchnikov and Y. I. Aristov, Int. J. Heat Mass Transfer, 2009, 52, 1774–1777 CrossRef CAS.
- W. Li, Z. Liu and S. Li, Therm. Sci. Eng. Prog., 2021, 25, 101033 CrossRef.
- G. Mouchaham, F. S. Cui, F. Nouar, V. Pimenta, J.-S. Chang and C. Serre, Trends Chem., 2020, 2, 990–1003 CrossRef CAS.
- F. Meunier, Sep. Technol., 1993, 3, 143–150 CrossRef CAS.
- Y. I. Aristov, Appl. Therm. Eng., 2013, 50, 1610–1618 CrossRef CAS.
- N. S. Bobbitt, J. Chen and R. Q. Snurr, J. Phys. Chem. C, 2016, 120, 27328–27341 CrossRef CAS.
- H. Dureckova, M. Krykunov, M. Z. Aghaji and T. K. Woo, J. Phys. Chem. C, 2019, 123, 4133–4139 CrossRef CAS.
- D. Banerjee, C. M. Simon, A. M. Plonka, R. K. Motkuri, J. Liu, X. Chen, B. Smit, J. B. Parise, M. Haranczyk and P. K. Thallapally, Nat. Commun., 2016, 7, 11831 CrossRef PubMed.
- D. Nazarian, J. S. Camp and D. S. Sholl, Chem. Mater., 2016, 28, 785–793 CrossRef CAS.
- W. Li, X. Xia, M. Cao and S. Li, J. Mater. Chem. A, 2019, 7, 7470–7479 RSC.
- W. Li, X. Xia and S. Li, ACS Appl. Mater. Interfaces, 2020, 12, 3265–3273 CrossRef CAS PubMed.
- S. M. Moosavi, A. Nandy, K. M. Jablonka, D. Ongari, J. P. Janet, P. G. Boyd, Y. Lee, B. Smit and H. J. Kulik, Nat. Commun., 2020, 11, 4068 CrossRef CAS PubMed.
- M. Tong, Y. Lan, Z. Qin and C. Zhong, J. Phys. Chem. C, 2018, 122, 13009–13016 CrossRef CAS.
- M. Addicoat, K. Butler, O. Farha, L. Gagliardi, A. H. Farmahini, C. Hendon, M. Jorge, S. Kitagawa, C. Lamberti, J.-S. M. Lee, J. Li, X. Liu, S. Moggach, M. Ranocchiari, L. Sarkisov, S. Shevlin, I. Stassen, K. Svane, D. Volkmer, A. Walsh, C. Wilmer and O. M. Yaghi, Faraday Discuss., 2017, 201, 233–245 RSC.
- H. Babaei, A. J. H. McGaughey and C. E. Wilmer, Chem. Sci., 2017, 8, 583–589 RSC.
- E. Hastürk, S.-J. Ernst and C. Janiak, Curr. Opin. Chem. Eng., 2019, 24, 26–36 CrossRef.
- Y. Su, Z. Li, H. Zhou, S. Kang, Y. Zhang, C. Yu and G. Wang, Chem. Eng. J., 2020, 402, 126205 CrossRef CAS.
- M. Huang, K. Mi, J. Zhang, H. Liu, T. Yu, A. Yuan, Q. Kong and S. Xiong, J. Mater. Chem. A, 2017, 5, 266–274 RSC.
- H. Frost and R. Q. Snurr, J. Phys. Chem. C, 2007, 111, 18794–18803 CrossRef CAS.
- A. R. Kaija and C. E. Wilmer, J. Phys. Chem. Lett., 2018, 9, 4275–4281 CrossRef CAS PubMed.
- T. F. Willems, C. H. Rycroft, M. Kazi, J. C. Meza and M. Haranczyk, Microporous Mesoporous Mater., 2012, 149, 134–141 CrossRef CAS.
- J. Ju, P. M. Welch, K. Ø. Rasmussen, A. Redondo, P. Vorobieff and E. M. Kober, Theor. Comput. Fluid Dyn., 2018, 32, 215–233 CrossRef CAS.
- L. D. Gelb and K. E. Gubbins, Langmuir, 1999, 15, 305–308 CrossRef CAS.
- Y.-S. Bae, A. Ö. Yazaydın and R. Q. Snurr, Langmuir, 2010, 26, 5475–5483 CrossRef CAS PubMed.
- D. Dubbeldam, S. Calero, D. E. Ellis and R. Q. Snurr, Mol. Simul., 2016, 42, 81–101 CrossRef CAS.
- B. Chen, J. J. Potoff and J. I. Siepmann, J. Phys. Chem. B, 2001, 105, 3093–3104 CrossRef CAS.
- A. Nalaparaju, X. S. Zhao and J. W. Jiang, J. Phys. Chem. C, 2010, 114, 11542–11550 CrossRef CAS.
- R. Bueno-Perez, P. J. Merkling, P. Gómez-Álvarez and S. Calero, Chem. – Eur. J., 2017, 23, 874–885 CrossRef CAS PubMed.
- S. G. Chen and R. T. Yang, Langmuir, 1994, 10, 4244–4249 CrossRef CAS.
- K. H. Cho, D. D. Borges, U. H. Lee, J. S. Lee, J. W. Yoon, S. J. Cho, J. Park, W. Lombardo, D. Moon, A. Sapienza, G. Maurin and J.-S. Chang, Nat. Commun., 2020, 11, 5112 CrossRef CAS PubMed.
- Z. Liu, J. Xu, M. Xu, C. Huang, R. Wang, T. Li and X. Huai, Nat. Commun., 2022, 13, 193 CrossRef CAS PubMed.
- X. Liu, X. Wang and F. Kapteijn, Chem. Rev., 2020, 120, 8303–8377 CrossRef CAS PubMed.
- T. Matthias, K. Katsumi, V. N. Alexander, P. O. James, R.-R. Francisco, R. Jean and S. W. S. Kenneth, Pure Appl. Chem., 2015, 87, 1051–1069 CrossRef.
- A. Rehman and S.-J. Park, Chem. Eng. J., 2019, 362, 731–742 CrossRef CAS.
- T. Devic, P. Horcajada, C. Serre, F. Salles, G. Maurin, B. Moulin, D. Heurtaux, G. Clet, A. Vimont, J.-M. Grenèche, B. L. Ouay, F. Moreau, E. Magnier, Y. Filinchuk, J. Marrot, J.-C. Lavalley, M. Daturi and G. Férey, J. Am. Chem. Soc., 2010, 132, 1127–1136 CrossRef CAS PubMed.
Footnote |
| † Electronic supplementary information (ESI) available. See DOI: https://doi.org/10.1039/d2me00222a |
| This journal is © The Royal Society of Chemistry 2023 |

