 Open Access Article
Creative Commons Attribution 3.0 Unported Licence
Core–shell nanostructured Cu-based bi-metallic electrocatalysts for co-production of ethylene and acetate
Jeannie Z. Y.
Tan
 *,
Ashween Kaur
Virdee
 ,
John M.
Andresen
 and
M. Mercedes
Maroto-Valer

Research Centre for Carbon Solutions (RCCS), Heriot-Watt University, Edinburgh, EH14 4AS, UK. E-mail: j.tan@hw.ac.uk
First published on 19th June 2023
Abstract
Direct electrocatalytic CCU routes to produce a myriad of valuable chemicals (e.g., methanol, acetic acid, ethylene, propanol, among others) will allow the chemical industry to shift away from the conventional fossil-based production. Electrofuels need to go beyond the current electroreduction of CO2 to CO, and we will here demonstrate the continuous flow electroreduction of syngas (i.e., CO and H2), which are the products from CO2-to-CO, with enhanced product selectivity (∼90% towards ethylene). To overcome current drawbacks, including bicarbonate formation that resulted in low CO2 utilisation and low C2+ product selectivity, the development of nanostructured core–shell bi-metallic electrocatalysts for direct electrochemical reduction of syngas to C2+ is proposed. Electrosynthesis of ethylene is performed in a state-of-the-art continuous flow three-compartment cell to produce ethylene (cathodic gas phase product) and acetate (cathodic liquid phase product), simultaneously.
1. Introduction
Meeting the Paris Agreement1 will require a wide range of mitigation and removal strategies, among which carbon capture and utilization (CCU) is particularly appealing as it can curb emissions while creating economic value. Notably, according to estimates, the large-scale deployment of CCU could help to decarbonise industrial activities by saving up to 3.5 GtCO2eq per year in 2030, that is, an 83% reduction compared with conventional fossil-based technologies.2 Chemical industry is one of the top three emitting industries and is among the most difficult to decarbonise. The most effective way to decarbonise the chemical industry is to reduce the reliance on fossil fuels and gas demand as the feedstocks to the sector as the largest-volume chemicals to produce commodity chemicals to satisfy global markets. In addition, fossil fuels are also used to provide heat and pressure to drive those chemical reactions.Amongst the commodity chemicals, acetic acid, ethylene and ethylene glycol (6.5, 164 and 30.2 Mt per year, respectively) are the most important chemicals for the chemical and pharmaceutical sectors. Ethylene as the major platform chemical has a global production increased from 185 Mt in 2018 to 214 Mt in 2021 and the average price of ethylene worldwide has increased to 1235 USD per ton.3 Unfortunately, it is produced via steam cracking of naphtha, currently the predominant production route followed by the thermal cracking of ethane,4 that emits 1.51 kgCO2eq kg−1 of ethylene (cradle-to-gate),5 resulting in 0.26 GtCO2eq (in order to satisfy the 2021 production volume) and accounting for 30% of the total energy needs of the chemical industry.6
CO2 electrochemical reduction (CO2RR) into value added products using renewable energy offers a promising approach to reduce anthropogenic CO2 emissions and development of sustainable energy systems. Coupling the intermittent electricity generated from solar and wind energy for CO2RR has been explored extensively for storing renewable electricity in chemicals, such as ethylene. CO2RR can produce carbon monoxide (CO), methane (CH4), methanol (CH3OH), formic acid (HCOOH), ethylene (C2H4) ethanol (CH3CH2OH) and chemicals with longer chain hydrocarbons. However, implementations of this technology for large-scale applications are challenging as the molecule is thermodynamically stable. Some other bottlenecks, including carbonate formation, poor product selectivity, low carbon utilisation rate, competition of H2 evolution reaction at low potentials, and poor stability, need to be overcome to make low temperature CO2RR competitive with other CO2 conversion technologies or chemical and energy production processes.7
Cu is the only electrocatalyst with acceptable activity and selectivity for C2+ products due to the unique property of binding *CO and *H.8 However, CO2RR requires a high bias (approx. −1.0 V vs. reversible hydrogen electrode, RHE). Furthermore, under high biases (−0.9 to −1.1 V) up to 12 different C2 or C3 products can be identified at the Cu polycrystalline cathode.9 To improve the efficiency and selectivity of C2+ products, the alkaline flow electrolyser has been proposed because it is one of the best electrolysers with high faradaic efficiency (90%) as well as superior single pass conversion efficiency (40%).10 However, the electrolyser consumes a lot of the electrolyte due to reductive disproportionation into CO and CO32−. As a result, the CO2 utilisation rate is significantly limited, and large voltage is required.7 To date, the best performing electrolyser for CO2 to ethylene displayed a 15% energy efficiency, 2% carbon efficiency, 60 h of steady state operation at 3.5 V and 500 mA cm−2.11
Addressing the carbonate formation is vital for this technology to make it a viable option for renewable chemical and fuel production. To date, the best reported CO production performance could be achieved at 3 V with approx. 4000 h at steady state operation under 200 mA cm−2 with 98% product selectivity.12 The carbon efficiency reported is 43%. With this outstanding performance of CO production, the production of C2+ products in the sequential step needs to be developed to produce more valuable products, such as ethylene and acetic acid, which are ∼$1200 and ∼$800 per Mt in 2021. Furthermore, the electro-conversion of these C2+ products are among the potential commodity chemicals with high revenue.10 Hence, the optimisation of the co-production of these commodity chemicals is the aim of the first part of this study.
The use of bimetallic electrocatalysts has been proposed previously to enhance the product selectivity with low overpotential required. For instant, Wang et al. reported that bimetallic Cu–Ag nanoflowers showed enhanced product selectivity towards acetaldehyde (∼70%) from CO at −0.536 V vs. RHE.13 Kuhn et al. also pointed out that a Cu–Ag bimetallic electrocatalyst had shown enhanced product selectivity towards ethylene (43% at −0.75 V vs. RHE) due to increased conductivity, stability and concentration of adsorbed CO when compared to Ag and Cu single metallic electrocatalysts.14 Furthermore, Gao et al. demonstrated that the Cu–Co core–shell bimetallic electrocatalysts with Co-rich samples were more selective towards hydrocarbons, whereas Cu-rich samples were prone to produce oxygenated compounds from syngas.15 Herein, three types of core–shell bimetallic electrocatalysts were synthesized. The syngas conversion performances of these electrocatalysts were analysed as the second part of this study.
2. Experimental
2.1 Chemicals
Oleylamine (OAm, R&D grade); copper nanoparticles (CuRef., 60–80 nm, ≥99.5%); copper(II) acetylacetonate (Cu[acac]2, ≥99.9%); palladium(II) trifluoroacetate (Pd[OCOCF3]2, 97%); silver trifluoroacetate (AgOCOCF3, 98%); tetrahydrofuran (THF, anhydrous ≥99.9%); isopropanol (IPA, ACS reagent ≥99.5%); Nafion™ (20 wt%) and dimethyl sulfoxide (DMSO, ≥99.9%) were purchased from Sigma-Aldrich. Potassium hydroxide (KOH, 85%) was purchased from Acros. Methanol (HPLC grade ≥99.8%); hexane (HPLC grade ≥95%) and deuterated water (D2O) were purchased from Fisher Chemical. Diphenyl ether (DPE) and cobalt(II) acetylacetonate (Co[acac]2, ≥99.0%) were purchased from Merck. All chemicals were used without further purification. Carbon gas diffusion layer (GDL) was Teflonated Toray TGP-60 from Alfa Aesar GmbH & Co; nickel foam (Nanoshel, 99.9%). Milli Q water (18 ΩM) was used throughout the study.2.2 Methods
![[thin space (1/6-em)]](https://www.rsc.org/images/entities/char_2009.gif) 000 rpm for 3 min, followed by washing with hexane as the dispersing agent (3 mL) and methanol as the antisolvent (17 mL). The samples, labelled as Cu@Ag, Cu@Co or Cu@Pd, were dispersed in hexane for further use.
000 rpm for 3 min, followed by washing with hexane as the dispersing agent (3 mL) and methanol as the antisolvent (17 mL). The samples, labelled as Cu@Ag, Cu@Co or Cu@Pd, were dispersed in hexane for further use.
2.3 Electrocatalytic testing
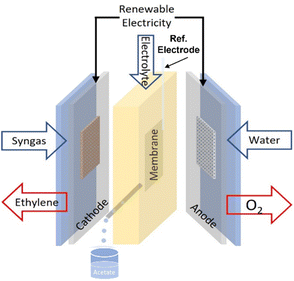
The electroreduction of syngas (CO/H2) was tested using an alkaline flow cell setup (Fig. 1). Gaseous CO/H2 (varied with different ratio) was continuously supplied to the back of the cathode at various rates controlled by a mass flow control (Bronkhorst EL-Flow Select). A syringe pump continuously fed KOH (refer to Table 1) as the catholyte and anolyte through two silicone rubber (SiloCell White from Polymax, 9 mm thickness) electrolyte chambers separated by an anion exchange membrane (AEM, AHA Membrane from Eurodia Ltd). The cell potential was varied via a potentiostat (Autolab PGSTAT302N) and the corresponding current density was continuously measured. Multimeters hooked up to the flow cell were used to measure cathode and anode potentials against an Ag/AgCl reference electrode (Ossila, C2015B1). For a typical procedure, the cell was first hooked up to the CO and/or H2 feed, electrolyte pump, potentiostat, multimeters, and gas chromatograph (GC, Agilent Technologies 7890B equipped with TCD-FID detectors). Each experiment was begun with two successive linear sweeps between −1.0 and −1.8 V versus Ag/AgCl to ensure proper functioning of the cell. The linear sweeps were followed by a potentiostatic preconditioning step at −1.0 V versus Ag/AgCl for 60 s. The cell was then stepped galvanostatically with one potentiostat and the cathode potentials were measured versus the Ag/AgCl reference electrode. Each galvanostatic step was 9 min in duration. Electrochemical impedance spectroscopy (EIS) measurements were conducted with the frequency range from 100 kHz to 0.1 Hz with an amplitude of 0.1 mA. Ten points were recorded per frequency decade.| Run no. | CO![[thin space (1/6-em)]](https://www.rsc.org/images/entities/char_2009.gif) : :![[thin space (1/6-em)]](https://www.rsc.org/images/entities/char_2009.gif) H2 H2 |
Concentration KOH (M) | Flowrate (mL min−1) |
|---|---|---|---|
| 1 | 1![[thin space (1/6-em)]](https://www.rsc.org/images/entities/char_2009.gif) : :![[thin space (1/6-em)]](https://www.rsc.org/images/entities/char_2009.gif) 0 0 |
0.1 | 0.54 |
| 2 | 1![[thin space (1/6-em)]](https://www.rsc.org/images/entities/char_2009.gif) : :![[thin space (1/6-em)]](https://www.rsc.org/images/entities/char_2009.gif) 1 1 |
0.1 | 0.41 |
| 3 | 1![[thin space (1/6-em)]](https://www.rsc.org/images/entities/char_2009.gif) : :![[thin space (1/6-em)]](https://www.rsc.org/images/entities/char_2009.gif) 0 0 |
0.1 | 1.07 |
| 4 | 1![[thin space (1/6-em)]](https://www.rsc.org/images/entities/char_2009.gif) : :![[thin space (1/6-em)]](https://www.rsc.org/images/entities/char_2009.gif) 1 1 |
0.1 | 1.07 |
| 5 | 1![[thin space (1/6-em)]](https://www.rsc.org/images/entities/char_2009.gif) : :![[thin space (1/6-em)]](https://www.rsc.org/images/entities/char_2009.gif) 0 0 |
2.0 | 0.54 |
| 6 | 1![[thin space (1/6-em)]](https://www.rsc.org/images/entities/char_2009.gif) : :![[thin space (1/6-em)]](https://www.rsc.org/images/entities/char_2009.gif) 1 1 |
2.0 | 0.41 |
| 7 | 1![[thin space (1/6-em)]](https://www.rsc.org/images/entities/char_2009.gif) : :![[thin space (1/6-em)]](https://www.rsc.org/images/entities/char_2009.gif) 0 0 |
2.0 | 1.07 |
| 8 | 1![[thin space (1/6-em)]](https://www.rsc.org/images/entities/char_2009.gif) : :![[thin space (1/6-em)]](https://www.rsc.org/images/entities/char_2009.gif) 1 1 |
2.0 | 1.07 |
| 9 | 1![[thin space (1/6-em)]](https://www.rsc.org/images/entities/char_2009.gif) : :![[thin space (1/6-em)]](https://www.rsc.org/images/entities/char_2009.gif) 1 1 |
1.0 | 0.78 |
2.4 Characterisation
The morphology of the synthesized products was examined using a field emission scanning electron microscope (FE-SEM, Quanta 200 F FEI), a high-resolution transmission electron microscope (HRTEM, FEI Titan Themis 200) equipped with an energy-dispersive X-ray spectroscopy (EDX) detector operated at 200 kV. To investigate the interior structures of the nanospheres, samples were embedded in TAAB 812 resin and sliced into ∼90 nm thick sections. The sliced sections were mounted on the TEM Ni grid. Crystallinity and phase identification of the synthesized products were conducted using powder X-ray diffraction XRD (Malvern Panalytical Empyrean Diffractometer) equipped with Cu Kα radiation (λ = 1.5418 Å) and compared with the ICDD-JCPDS powder diffraction file database. Nuclear magnetic resonance spectroscopy (NMR, Bruker AVIII-400) was used to analyse the liquid products. Typically, 100 μL of the catholyte sample was mixed with 100 μL of DMSO standard solution and 400 μL of D2O in an NMR tube. The DMSO standard solution was made by diluting the DMSO with D2O to obtain the final concentration (1.262 mM). The samples were analyzed using 1H NMR equipped with solvent suppression. The spectra were integrated and compared against a DMSO standard to quantify the concentrations of the liquid products.3. Results and discussion
The electroreduction of syngas parameters were optimised through a series of experiments using design of experiment (DOE). A blank GDL was loaded onto the Cu flow plate and the experiment was run following the procedure above. No observable product was detected based on the GC and NMR results.The parameters, including the concentration of electrolyte (i.e., 0.1, 1 and 2 M), ratio of CO![[thin space (1/6-em)]](https://www.rsc.org/images/entities/char_2009.gif) :
:![[thin space (1/6-em)]](https://www.rsc.org/images/entities/char_2009.gif) H2 and flow rate of syngas (Table 1), were manipulated to optimise the parameters for the electrocatalytic process. Using the stepped galvanostatic reduction method, the current applied was manipulated ranging from 1.0 to 4.5 mA. Each step (0.5 mA) was held for 9 min to allow sufficient time for sampling into GC. The optimised current applied was determined with the highest ethylene yielded from syngas. The experimental results were tabulated, and a Pareto chart was used to visualise the most significant factor in the DOE (Fig. 2). The Pareto chart revealed that the concentration of the electrolyte was the most significant factor affecting ethylene production efficiency. Meanwhile, −2.5 mA was the optimised applied current that resulted in the highest single pass production of ethylene, which was ∼2.5 mM cm−2.
H2 and flow rate of syngas (Table 1), were manipulated to optimise the parameters for the electrocatalytic process. Using the stepped galvanostatic reduction method, the current applied was manipulated ranging from 1.0 to 4.5 mA. Each step (0.5 mA) was held for 9 min to allow sufficient time for sampling into GC. The optimised current applied was determined with the highest ethylene yielded from syngas. The experimental results were tabulated, and a Pareto chart was used to visualise the most significant factor in the DOE (Fig. 2). The Pareto chart revealed that the concentration of the electrolyte was the most significant factor affecting ethylene production efficiency. Meanwhile, −2.5 mA was the optimised applied current that resulted in the highest single pass production of ethylene, which was ∼2.5 mM cm−2.
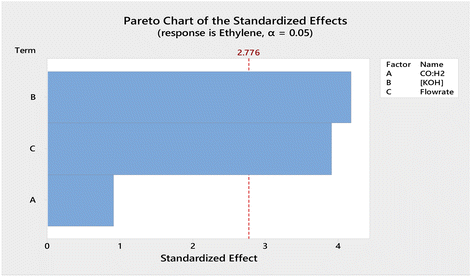 | ||
Fig. 2 Pareto chart of the standardized effects obtained for the factorial design optimization of the variables (A) CO![[thin space (1/6-em)]](https://www.rsc.org/images/entities/char_2009.gif) : :![[thin space (1/6-em)]](https://www.rsc.org/images/entities/char_2009.gif) H2, (B) concentration of KOH, and (C) flowrate of syngas. H2, (B) concentration of KOH, and (C) flowrate of syngas. | ||
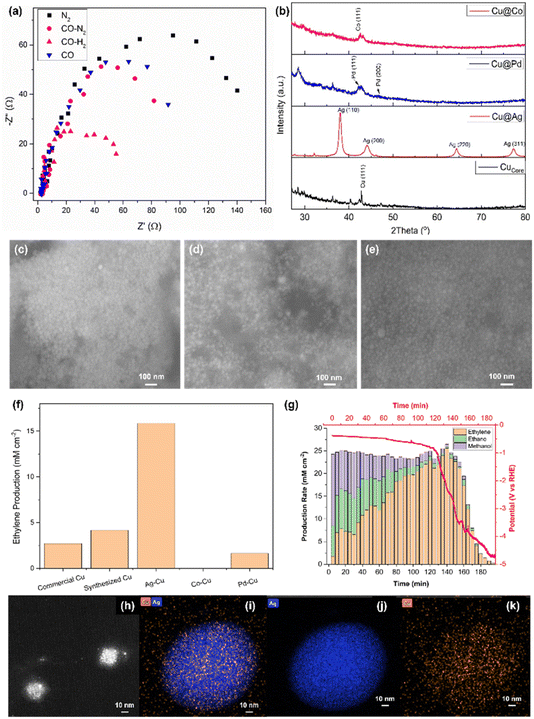
Electronic impedance analysis was performed to justify the role of H2 in the electroreduction of CO to ethylene (Fig. 3a). The Nyquist plot was obtained for commercial Cu being exposed to different gases, namely N2, CO–N2, CO–H2 and CO. In particular, the high frequency process was found to be not dependent on electrode material and applied current; on the contrary the low frequency one was different for the measurements under different gases and highly dependent on the current applied. The former was attributed to the ionic migration toward the reaction site, whereas the latter reflected the charge transfer due to the reduction reaction.16 The charge transfer resistance (Rct) was found to be decreasing in the order of N2 > CO > CO–N2 > CO–H2. When CO and CO–N2 were introduced into the electrolyser, the reduction of Rct was not significant. However, the exposure under CO–H2 largely decreased Rct. This result was attributed to the strong reducing power of CO and H2. When CO and/or H2 were introduced into the electrolyser, the oxidised Cu electrocatalyst was reduced to Cu. Being a stronger reducing agent, H2 tended to reduce more O2 that adsorbed on the electrocatalyst compared to CO, providing more electrochemically active area, thus, enhancing the conductance.17 Furthermore, a recent study concluded that the adsorption of H2 would reconstruct the surface Cu atoms in the electroreduction conditions based on the simulation, thus, reducing the potential barrier.18
The optimised experimental conditions, which were 1![[thin space (1/6-em)]](https://www.rsc.org/images/entities/char_2009.gif) :
:![[thin space (1/6-em)]](https://www.rsc.org/images/entities/char_2009.gif) 1 CO
1 CO![[thin space (1/6-em)]](https://www.rsc.org/images/entities/char_2009.gif) :
:![[thin space (1/6-em)]](https://www.rsc.org/images/entities/char_2009.gif) H2, 1.0 M of KOH and 0.78 mL min−1 of syngas, were applied for the following experiments using different bi-metallic electrocatalysts. The flow of electrolyte was maintained at 0.15 mL min−1.
H2, 1.0 M of KOH and 0.78 mL min−1 of syngas, were applied for the following experiments using different bi-metallic electrocatalysts. The flow of electrolyte was maintained at 0.15 mL min−1.
Three different types of bi-metallic electrocatalysts were synthesized using the sol–gel method as detailed in the experimental procedure section 2.2.2. The crystallinity of the synthesized electrocatalysts was evaluated using XRD (Fig. 3b). The synthesized Cucore with metallic dark brownish colour showed a very weak XRD signal probably due to the small nano-crystallite size. When Ag was loaded as the shell layer, Ag metal produced a strong XRD pattern at 38.1, 44.2, 64.4 and 77.4°, which corresponded to (110), (200), (220) and (311) phases, respectively. Pd and Co were also synthesized as the shell materials of Cucore using the same experimental conditions. Unfortunately, the XRD patterns of these metals were very broad and poor compared to Ag although the Pd (111), Pd (200) and Co (111), which were located at 42.3, 47.0 and 42.6°, respectively, were identified. This was due to very small nanocrystallite size deposited on Cucore.
The morphology of the nanoparticles was characterised using SEM. The synthesized samples appeared as very small nanoparticles. The synthesized Cucore was hardly seen under SEM, thus, the TEM image of Cucore was provided (Fig. 3h). The highly crystallized Ag@Cu revealed the largest particle size (∼25 nm, Fig. 3c) among the bi-metallic electrocatalysts (i.e., ∼15 and ∼12 nm for Pd@Cu and Co@Cu (Fig. 3d and e), respectively).
The synthesized electrocatalysts were used as the cathodic material in the tailor-made alkaline flow cell using the optimised conditions. Each sample was tested using the galvanostatic method as detailed in DOE experiments. The single conversion efficiency of Ag@Cu was the highest among the samples, which was ∼15.0 mM cm−2, when 2.5 mA was applied. Meanwhile, Cucore produced ∼4.9 mM cm−2, followed by commercial Cu (∼2.5 mM cm−2) and Pd@Cu (∼2 mM cm−2, Fig. 3f). Unfortunately, Co@Cu showed trace amount of ethylene production. The underperforming of Co@Cu and Pd@Cu was due to the strong electronegativity of Ag compared to Co and Pd. In addition, the low crystallinity and coverage of the Co and Pd compared to Ag@Cu led to unsatisfactory performance.
To further understand the morphology of the synthesized Cucore and Ag@Cu, HRTEM was utilised to examine these electrocatalysts. The synthesized Cucore exhibited a self-assembled nanosphere with diameter ∼10 nm that was formed from a group of nanoparticles (Fig. 3h). The elemental analysis on the electrocatalysts was conducted using EDX-HRTEM. The shell layer of Ag (Fig. 3i and j) exhibited a much stronger signal than Cu as the core material (Fig. 3k). This suggested that Ag had formed a thick, solid layer over the Cu.
The best performing sample Ag@Cu was used to perform a stability test. The current of −2.5 mA was supplied continuously to the cell, while the potential was measured simultaneously with the gas sampling through the connected GC. The production rate of ethylene was analysed and plotted (Fig. 3g, yellow bars). The production rate increased immediately after the first 5 min from 1 to ∼7.5 mM cm−2 (10–30 min). The production rate was doubled after 40 min and stabilised at ∼22 mM cm−2. The maximum production rate achieved was 25 mM cm−2 at the 140th min before the measured potential started to descend. The potential dropped quickly and approached −4.8 V vs. RHE after 140 min. This had also resulted in the decrease of ethylene production concurrently and eventually approached 0. The overall ethylene selectivity was 75% with ∼15% of ethane (Fig. 3g, green bars) and 10% of methanol (Fig. 3g, purple bars) based on the gaseous product analysis using GC. The total production of ethylene in the single pass conversion was calculated to be 0.5 M after 180 min, which was ∼40% efficiency.
To elucidate the liquid products from the cathode compartment, the catholyte, which was flowing through the middle compartment throughout the experiment, was analysed using NMR (Fig. 4). The catholyte obtained was analysed without purification. The NMR spectrum revealed that acetate was the only product in the catholyte. No other by-product was detected. The concentration of acetate was estimated to be 2.65 g L−1.
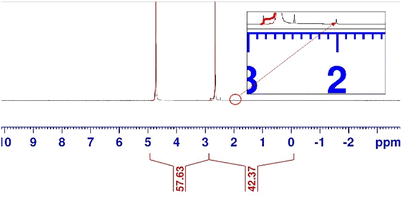 | ||
| Fig. 4 NMR spectrum of the solution obtained after a single pass conversion from the middle compartment of the electrolyser. | ||
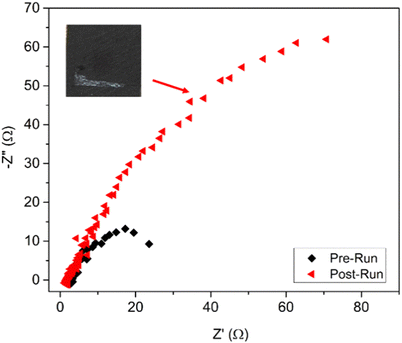
The impedance of Ag@Cu before and after the stability test was recorded as shown in the Nyquist plots (Fig. 5). The Rct of the post-run sample increased 5–6 times when compared to the fresh sample. In addition, the post-run electrocatalyst revealed some white deposition on the GDE (inset of Fig. 5), which was due to the accumulation of acetate. Hence, the increase in Rct was postulated to be due to the accumulation of acetate that increased the potential barrier and hindered the electrocatalytic sites. This explained the phenomenon of rapid reduction in products obtained from the electroreduction process after 140 min. The accumulation of acetate on the GDE over the time had also reduced and constrained the adsorption of CO on the GDE that probably shifted the product selectivity from methanol to ethylene as suggested by a recent study.19
The co-production of high selective ethylene from syngas in the gas compartment and potassium acetate in the middle compartment exhibited the advantage of the three-compartment electrolyser, in which the products in gas and liquid phases were prohibited to cross-over, which prevented the oxidation of reduced products. As a result, the product selectivity was promoted. Further enhancement of the single pass conversion efficiency with high product selectivity (i.e., avoid product purification/separation processes) would significantly enhance the economic feasibility of the electrolyser for CCU applications.
4. Conclusions
A three-compartment alkaline flow-through electrolyser was successfully developed and the single pass conversion of syngas to ethylene achieved was 2.5 mM cm−2 in the optimised conditions (i.e., 1![[thin space (1/6-em)]](https://www.rsc.org/images/entities/char_2009.gif) :
:![[thin space (1/6-em)]](https://www.rsc.org/images/entities/char_2009.gif) 1 of CO
1 of CO![[thin space (1/6-em)]](https://www.rsc.org/images/entities/char_2009.gif) :
:![[thin space (1/6-em)]](https://www.rsc.org/images/entities/char_2009.gif) H2; 1.0 M of KOH and 0.78 mL min−1 of total gas flow under −2.5 mA cm−2). The single pass conversion of syngas to ethylene was dramatically enhanced when the fabricated core–shell Cu@Ag sample (15 mM cm−2) was employed as the electrocatalyst, the co-production of ethylene (∼40%) and potassium acetate (2.65 g L−1) was obtained as the gas and liquid products, respectively, with high purity (>70%). The impedance measurements suggested that the shifting of product selectivity from methanol to ethylene over the time and deterioration of ethylene production after 2 h were due to the accumulated acetate that hindered the electrocatalytic sites. Further mechanistic study and optimisation are required to fully understand the reaction pathways. Although the core–shell Cu–Ag bimetallic electrocatalyst showed promising conversion efficiency, the stability of ethylene production would need to be explored further.
H2; 1.0 M of KOH and 0.78 mL min−1 of total gas flow under −2.5 mA cm−2). The single pass conversion of syngas to ethylene was dramatically enhanced when the fabricated core–shell Cu@Ag sample (15 mM cm−2) was employed as the electrocatalyst, the co-production of ethylene (∼40%) and potassium acetate (2.65 g L−1) was obtained as the gas and liquid products, respectively, with high purity (>70%). The impedance measurements suggested that the shifting of product selectivity from methanol to ethylene over the time and deterioration of ethylene production after 2 h were due to the accumulated acetate that hindered the electrocatalytic sites. Further mechanistic study and optimisation are required to fully understand the reaction pathways. Although the core–shell Cu–Ag bimetallic electrocatalyst showed promising conversion efficiency, the stability of ethylene production would need to be explored further.
Conflicts of interest
There are no conflicts to declare.Acknowledgements
The authors/we would like to acknowledge that this work was supported by the UKRI ISCF Industrial Challenge within the UK Industrial Decarbonisation Research and Innovation Centre (IDRIC) award number: EP/V027050/1.References
- United Nations Framework Convention on Climate Change (UNFCCC), Adoption of the Paris Agreement, 2015 Search PubMed.
- A. Kätelhön, R. Meys, S. Deutz, S. Suh and A. Bardow, Proc. Natl. Acad. Sci. U. S. A., 2019, 116, 11187–11194 CrossRef PubMed.
- https://www.statista.com/statistics/1170573/price-ethylene-forecast-globally/ .
- M. Ghanta, D. Fahey and B. Subramaniam, Appl. Petrochem. Res., 2014, 4, 167–179 CrossRef CAS.
- G. Wernet, C. Bauer, B. Steubing, J. Reinhard, E. Moreno-Ruiz and B. Weidema, Int. J. Life Cycle Assess., 2016, 21, 1218–1230 CrossRef.
- E. Worrell, D. Phylipsen, D. Einstein and N. Martin, Energy Use and Energy Intensity of the U.S. Chemical Industry, 2000 Search PubMed.
- J. A. Rabinowitz and M. W. Kanan, Nat. Commun., 2020, 11, 5231 CrossRef CAS PubMed.
- A. Bagger, W. Ju, A. S. Varela, P. Strasser and J. Rossmeisl, ACS Catal., 2019, 9, 7894–7899 CrossRef CAS.
- A. R. Woldu, A. H. Shah, H. Hu, D. Cahen, X. Zhang and T. He, Int. J. Energy Res., 2020, 44, 548–559 CrossRef CAS.
- J. Sisler, S. Khan, A. H. Ip, M. W. Schreiber, S. A. Jaffer, E. R. Bobicki, C.-T. Dinh and E. H. Sargent, ACS Energy Lett., 2021, 6, 997–1002 CrossRef CAS.
- F. P. García de Arquer, C.-T. Dinh, A. Ozden, J. Wicks, C. McCallum, A. R. Kirmani, D.-H. Nam, C. Gabardo, A. Seifitokaldani, X. Wang, Y. C. Li, F. Li, J. Edwards, L. J. Richter, S. J. Thorpe, D. Sinton and E. H. Sargent, Science, 2020, 367, 661–666 CrossRef PubMed.
- Z. Liu, H. Yang, R. Kutz and R. I. Masel, J. Electrochem. Soc., 2018, 165, J3371 CrossRef CAS.
- L. Wang, D. C. Higgins, Y. Ji, C. G. Morales-Guio, K. Chan, C. Hahn and T. F. Jaramillo, Proc. Natl. Acad. Sci. U. S. A., 2020, 117, 12572–12575 CrossRef CAS PubMed.
- A. N. Kuhn, H. Zhao, U. O. Nwabara, X. Lu, M. Liu, Y.-T. Pan, W. Zhu, P. J. A. Kenis and H. Yang, Adv. Funct. Mater., 2021, 31, 2101668 CrossRef CAS.
- W. Gao, Y. Zhao, H. Chen, H. Chen, Y. Li, S. He, Y. Zhang, M. Wei, D. G. Evans and X. Duan, Green Chem., 2015, 17, 1525–1534 RSC.
- A. Sacco, J. CO2 Util., 2018, 27, 22–31 CrossRef CAS.
- D. P. Nagmani, A. Tyagi, T. C. Jagadale, W. Prellier and D. K. Aswal, Appl. Surf. Sci., 2021, 549, 149281 CrossRef CAS.
- Z. Zhang, Z. Wei, P. Sautet and A. N. Alexandrova, J. Am. Chem. Soc., 2022, 144, 19284–19293 CrossRef CAS PubMed.
- J. Li, Z. Wang, C. McCallum, Y. Xu, F. Li, Y. Wang, C. M. Gabardo, C.-T. Dinh, T.-T. Zhuang, L. Wang, J. Y. Howe, Y. Ren, E. H. Sargent and D. Sinton, Nat. Catal., 2019, 2, 1124–1131 CrossRef CAS.
| This journal is © The Royal Society of Chemistry 2023 |

