 Open Access Article
Creative Commons Attribution 3.0 Unported Licence
Catalysts informatics: paradigm shift towards data-driven catalyst design
Keisuke
Takahashi
 *a,
Junya
Ohyama
 b,
Shun
Nishimura
 c,
Jun
Fujima
a,
Lauren
Takahashi
 a,
Takeaki
Uno
d and
Toshiaki
Taniike
c
aDepartment of Chemistry, Hokkaido University, North 10, West 8, Sapporo 060-0810, Japan. E-mail: keisuke.takahashi@sci.hokudai.ac.jp
bFaculty of Advanced Science and Technology, Kumamoto University, 2-39-1 Kurokami, Chuo-ku, 860-8555, Japan
cGraduate School of Advanced Science and Technology, Japan Advanced Institute of Science and Technology, 1-1 Asahidai, Nomi, Ishikawa 923-1292, Japan
dNational Institute of Informatics, 2-1-2 Hitotsubashi, Chiyoda-ku, 101-8430, Japan
First published on 18th January 2023
Abstract
Designing catalysts is a challenging matter as catalysts are involved with various factors that impact synthesis, catalysts, reactor and reaction. In order to overcome these difficulties, catalysts informatics is proposed as an alternative way to design and understand catalysts. The underlying concept of catalysts informatics is to design the catalysts from trends and patterns found in catalysts data. Here, three key concepts are introduced: experimental catalysts database, knowledge extraction from catalyst data via data science, and a catalysts informatics platform. Methane oxidation is chosen as a prototype reaction for demonstrating various aspects of catalysts informatics. This work summarizes how catalysts informatics plays a role in catalyst design. The work covers big data generation via high throughput experiments, machine learning, catalysts network method, catalyst design from small data, catalysts informatics platform, and the future of catalysts informatics via ontology. Thus, the proposed catalysts informatics would help innovate how catalysts can be designed and understood.
1 Introduction
Designing catalysts has been a challenging matter due to the high complexities regarding how catalysts behave under the reaction.1 In particular, catalytic activities are strongly coupled with catalyst compositions and experimental conditions.2–4 Furthermore, factors like oxidation state as well as catalyst structure impact the catalytic performance, leaving one to consider catalysis as a multi-dimensional problem.5–7 Within such circumstances, catalysts have been designed and developed via trial and error processes. During this process, researchers often acquire additional knowledge as well as intuition which often results in the successful development of active catalysts.8 While doing so, researchers might capture the unwritten rules and hidden trends regarding catalysts or catalysis. One can consider that catalyst design is achievable in principle if such unwritten rules are unveiled.9 The ultimate goal of catalysts informatics is to reproduce researchers' unwritten rules as well as unveil the hidden patterns and trends in catalysis, leading to the design of catalysts.Catalysis informatics is proposed to extract knowledge and trends from catalyst data, leading to accelerating the design of catalysts.10 In the early stage of catalysis informatics, computational catalysts data is mainly used to understand phenomena in catalysis due to the lack of available catalyst experimental data.10 In order to overcome the lack of experimental data and design catalysts, catalysis informatics must move one step further. As mentioned earlier, catalysts are involved with various factors as shown in Fig. 1. Fig. 1 shows that the activities of catalysts are based on synthesis, catalysts, reactor, and reaction. The structure, defects, and oxidation of catalysts are strongly coupled with synthesis method, composition, and conditions such as calcination. In addition, reactors and experimental conditions during the reaction play an important role. More importantly, the forms of catalysts are constantly changing like living beings under these factors, making the true form of catalysts invisible. This distinguishes catalysts informatics from chemoinformatics and materials informatics, where the former is considered to deal with dynamic matter and the latter is viewed as dealing with static matter. Here, catalysts informatics is specifically proposed for designing catalysts themselves in experiment where experimental data collection, data science technique development, and platform design are introduced. Thus, one can see that catalysts informatics offers data-driven design of catalyst as a fourth paradigm after experiment, theory and computation.
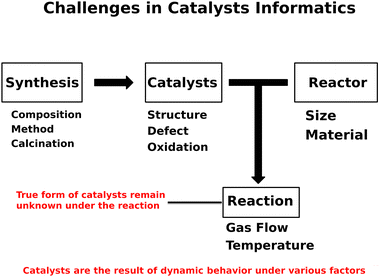 | ||
| Fig. 1 Challenges in catalysts informatics lie in the various factors of synthesis, catalysts, reactor, and reaction. | ||
Catalysts are investigated where the methane oxidation reaction is chosen as a prototype reaction for catalysts informatics. In particular, catalysts informatics is applied in the following two methane oxidation reactions: oxidative coupling of methane (OCM) and partial oxidation of methane to methanol. The OCM reaction aims for the direct conversion of methane (CH4) to ethylene (C2H4) and ethane (C2H6) using oxygen.11,12 However, the OCM reaction suffers from overoxidation of carbon, resulting in relatively low C2 yield, making OCM a challenging reaction. Furthermore, the OCM reaction takes place at high temperatures around 700–900 °C on top of the CH4 and O2 gas flow during the reaction.13 Direct methanol production from methane is also a challenging matter as keeping the synthesized methanol is difficult during the reaction.14,15 Thus, both the OCM reaction and methanol synthesis require innovative catalysts. Here, catalysts informatics is proposed as an alternative way of designing catalysts for methane oxidation.
2 Concepts
The idea of catalysts informatics is to design and understand catalysts from the perspective of catalyst data. Here, the following three key concepts are proposed in catalysts informatics: catalyst data, knowledge extraction from data, and catalysts data platform as shown in Fig. 2.9 It is important that these three concepts are synergistically integrated in order to complete the catalysts informatics. The details of each concept are explored.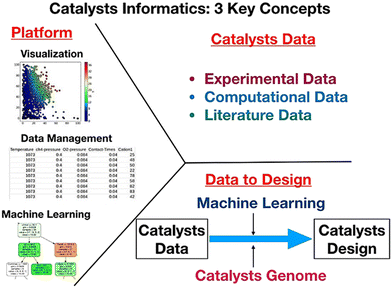 | ||
| Fig. 2 Three key concepts in catalysts informatics. Reproduced from ref. 9. | ||
Catalyst data is the fundamental part of catalysts informatics. One of the issues in catalyst data is that there are no standard rules for how data should be collected. Therefore, it is important to standardize data collection in catalysts informatics. Ontology is proposed in order to achieve standardization of catalysts data.8,16 With ontology, the meaning and relationships within catalysts data can be standardized. Moreover, it is important to create high quality and consistent data sets. Oftentimes, so-called negative results also play an important role in data analysis. Negative results are defined as data which does not achieve high catalytic performance. Feeding such data to machines proves to have a positive impact in machine learning and for other data science techniques. High throughput experiments and calculations are one of the solutions for such issues as large amounts of consistent data can be acquired in a relatively short period of time. Here, ontology and high throughput experiment and calculation are introduced as the way of collecting catalysts data in this article.
Extracting knowledge from catalyst data is the way towards designing and understanding catalysts. Machine learning is the way to extract knowledge from multidimensional catalyst data.17–19 Machine learning is essentially solving the y = f(x) function where y and x stand for objective variable and descriptor variable, respectively. In this article, random forest and support vector machine are mainly used. Random forest and support vector machine are both types of supervised machine learning. With random forest, multiple decision trees are made where the majority of the decision acts as the answer. Support vector machine is based on creating decision boundaries within the data. In catalysts informatics, y can represent yield, selectivity, conversion or any catalytic activity researchers want to predict while descriptor variables are responsible for variables representing the objective variable. Descriptor variables in catalysts can be comprised of factors such as catalyst composition, experimental conditions, or anything else relating to catalyst information. Therefore, one of the challenges in catalysts informatics is to seek the appropriate descriptor variables. Furthermore, data visualization is also a powerful approach that can be used to find the trends and patterns present in catalysts data. Thus, it is important to combine machine learning and data visualization in catalysts informatics. Catalyst design using machine learning and data visualization is demonstrated while alternative data science methods are also developed and proposed in this article.
Catalysts informatics involves sharing data and data science techniques including machine learning and visualization. Thus, various components are introduced. In addition, machine learning and data visualization generally require the use of programming language. Thus, it limits researchers who may wish to implement catalysts informatics tools. Therefore, it is important to create a platform which provides a user-friendly graphical user interface for data sharing and informatics techniques.
3 Literature data and machine learning
OCM literature data is investigated using catalysts informatics. Approximately 1800 data points related to OCM catalysts are available via patents and academic journals.13 Machine learning is implemented to predict the C2 yield; however, a regression model is unable to be applied due to the inconsistency of the data. Inconsistency of data is considered to be due to various factors including environmental factors, data handling and many others.20 Because regression models are unable to be used, random forest classification machine learning is implemented where C2 yield is divided into groups based on yield.18 In this way, rough estimation is achieved whether catalysts have high, medium, or low catalytic activities where some key catalysts are proposed.At the next stage, the discovery of unreported catalysts to possess a C2 yield over 30% expected by random forest classification are elucidated in validation.21 After excluding harmful and hard-to-control elements such as Ra and Fr, each of the 42 kinds of M1–M2 binary-component catalysts supported by SiO2 and γ-Al2O3 are examined for those features in OCM using fixed conditions. Comparing the C2 yield of 19.0% made by a standard NaMnW/SiO2 under the same conditions determined that the actual experimental data of the predicted catalysts did not satisfy the novel reactivity of OCM. Note that NaMnW/SiO2 is one of the high activity catalysts in OCM.22 The maximum C2 yield is observed as 10.6% over NaMn/SiO2. It is expected that targeting C2 yield exceeding 30% is hardly achievable among the predicted catalysts even if the reaction conditions are optimized. Refocusing of the approximately 1800 original data points from the literature data indicated that the outlier points of data from the random forest regression (RFR) model are mainly occupied by a C2 yield greater than 30% as shown in Fig. 3, and almost all those data points are generated with great efforts in not only selection of element components but also careful control of catalyst structure in preparation protocols and/or special atmospheric control in the feed stream. Accordingly, it is still an ongoing subject for how one can apply the ML engineering tools for predicting C2 yield beyond interpolation filling of original datasets.21 A difficulty arose in predicting the rare target OCM performance with a C2 yield greater than 30% with the original data covering a C2 yield lower than the target.
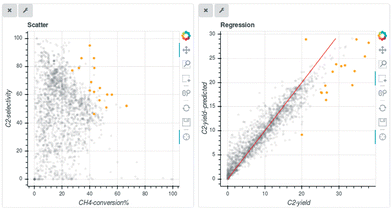 | ||
| Fig. 3 Scatter plot of C2 selectivity vs. CH4 conversion and predicted and true C2 yields. Reproduced from ref. 20 with permission from the Royal Society of Chemistry. | ||
When the machine learning possesses an attractive property covering the interpolation fillings in multidimensional trends, it can understand the trends of catalyst performance under various experimental conditions. An earlier study was conducted on accurately reproducing the experimental data with the well-known OCM catalyst NaMnW/SiO2.3 156 data points consisting of various experimental conditions were collected with five descriptor variables including reaction temperature, CH4/O2 ratio, CH4 + O2 concentration, total flow rate, and catalyst weight. Then, machine learning was implemented to trace the reaction features determining a C2 yield value. An extreme tree regression (ETR) constructed a high-score model with R2 = 0.86. Validity of the model was carefully conducted by comparisons to other regression models such as random forest regression (RFR) and non-linear support vector regression (SVR), and also to differences with the trends of actual experiment data points. Then, ETR describing a surface plot feature at C2 yield as shown in Fig. 4 was selected as the reasonable features. Moreover, it was found that even if the amount of experiment data decreased to 45 data points, the ETR model roughly can agree with enough accuracy to ascertain the experiment target in the reaction conditions. Accordingly, machine learning was conducted as an effective tool for determining how the next step of experiments should be designed and affording the best performance of the catalyst.3
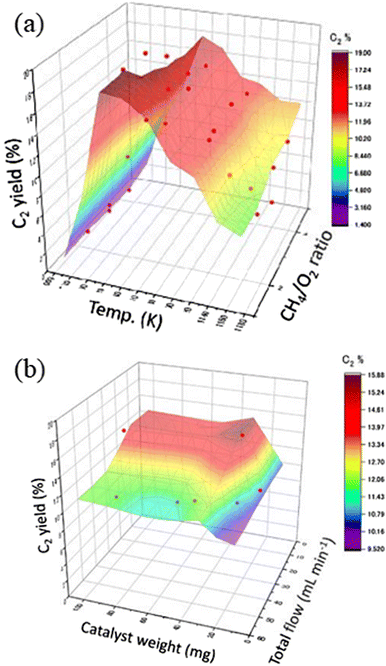 | ||
| Fig. 4 3D surface plots of the predicted C2 yield based on ETR against (a) reaction temperature and CH4/O2 ratio, and (b) catalyst weight and total flow. The marks highlighted with red color represent the experimental data points. Reproduced from ref. 3. | ||
4 High-throughput experiment
A key component in catalysts informatics is data collection. It has been demonstrated that inconsistency in the literature has become an obstacle when used with machine learning. In particular, when applying machine learning, it is desirable to have data that is appropriate in both quantity and quality according to the complexity of the problem to be modeled.23 Data scattered throughout individual literature reports are not large enough on their own. Therefore, data belonging to the subject of interest must be mostly manually curated from relevant literature in consideration of the completeness and fidelity of the data. The quantity of the curated data is highly dependent on the subject. For a specific subject such as catalysis, the quantity of data is much smaller; for instance, in spite of a time period of 30 years that the source literature covers, only approximately 1800 data points for OCM, one of the main reactions in this article, are collected.13 When relying on literature data, the quality of the data can also be problematic. From a purposeful or utilitarian point of view, negative results – also called failed experiments (e.g., experiments in which crystals did not form or catalysts performed poorly) – tend to be less valued and published less in scientific papers.24 However, these are critical pieces of information that determine the boundaries between positive and negative outcomes. As a catalyst is part of a chemical process, its performance is generally sensitive to the details of the employed process. Such details are not always explicitly stated in the literature and can result in inconsistent data, where the same catalyst exhibits different performance values between different literature reports.2 Thus, lack of consistent data and negative data limits the implementation of catalysts informatics.One solution to the data problem is high-throughput experimentation (HTE), which can generate systematic data according to a predefined experimental plan in a process-consistent manner. Here, HTE for OCM catalysts is developed as shown in Fig. 5 and applied to obtain data for catalysts informatics.2,4,25 Catalyst preparation based on wet impregnation is parallelized using a parallel hot stirrer and a centrifugal evaporator for drying. For catalyst evaluation, a high-throughput catalyst screening system is developed, which consists of a gas mixer to provide reaction gas at a specified composition, a flow distributor to divide the reaction gas equally into 20 fractions, a hollow electric furnace with three temperature zones, 20 quartz reactor tubes symmetrically arranged in the furnace, an autosampler that sequentially samples effluent gas from each tube by programmed action of solenoid valves, and a quadruple mass spectrometer (QMS) that determines the composition of the effluent gas based on external calibration as shown in Fig. 5.2,7 The instrument can evaluate the performance of 20 catalysts under a programmed series of reaction conditions in a fully automated fashion. For instance, the performance of 20 catalysts measured at 216 reaction conditions leads to 4320 data points within a single day. Note that the instrument yields consistent data with a conventional single reactor using a gas chromatograph.2
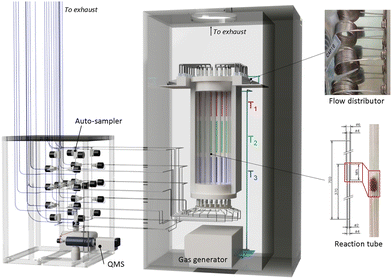 | ||
| Fig. 5 High throughput experiment device for the oxidative coupling of methane reaction. Reprinted with permission from ref. 4. Copyright 2021 American Chemical Society. | ||
The first demonstration of HTE is performed on 59 catalysts that consist of derivatives of Mn–Na2WO4–SiO2,26 one of the best OCM catalysts, and reference samples.2 Evaluation of the 59 catalysts under 216 reaction conditions is completed in three automated operations of the instrument, yielding a total of 12![[thin space (1/6-em)]](https://www.rsc.org/images/entities/char_2009.gif) 708 data points in three days. The power of HTE is evident even from simple visualizations. To start, a scatter plot of the entire dataset in terms of the CH4 conversion and the C2 selectivity exhibits a clear trade-off between them in Fig. 6. This trade-off is known to be the main obstacle of OCM, which arises from the fact that CH4 is much less reactive towards O2 than the C2 compounds. When all the data points are plotted against the CO and CO2 selectivities as shown in Fig. 6, the region where the high-C2-yield data points are concentrated suggests that the by-production of CO2 is hard to be eliminated, which determines the upper limit of the C2 yield. The maximum C2 yields of the 59 catalysts out of the 216 reaction conditions are compared in bar graphs shown in Fig. 7, showing that Si-containing supports, represented by SiO2, are the best support for Na2WO4, that tungstate and molybdate salts with alkali metal and alkaline earth metal elements lead to superior performance, and that only Mn and Ti can improve the performance of Na2WO4–SiO2. It is known that a Si-rich support with a high specific surface area is appropriate to form a highly dispersed Na2WO4 active phase.2,7,27 What must be stressed here is not the novelty of these findings, but the fact that they are obtained from a single series of experiments within one week.
708 data points in three days. The power of HTE is evident even from simple visualizations. To start, a scatter plot of the entire dataset in terms of the CH4 conversion and the C2 selectivity exhibits a clear trade-off between them in Fig. 6. This trade-off is known to be the main obstacle of OCM, which arises from the fact that CH4 is much less reactive towards O2 than the C2 compounds. When all the data points are plotted against the CO and CO2 selectivities as shown in Fig. 6, the region where the high-C2-yield data points are concentrated suggests that the by-production of CO2 is hard to be eliminated, which determines the upper limit of the C2 yield. The maximum C2 yields of the 59 catalysts out of the 216 reaction conditions are compared in bar graphs shown in Fig. 7, showing that Si-containing supports, represented by SiO2, are the best support for Na2WO4, that tungstate and molybdate salts with alkali metal and alkaline earth metal elements lead to superior performance, and that only Mn and Ti can improve the performance of Na2WO4–SiO2. It is known that a Si-rich support with a high specific surface area is appropriate to form a highly dispersed Na2WO4 active phase.2,7,27 What must be stressed here is not the novelty of these findings, but the fact that they are obtained from a single series of experiments within one week.
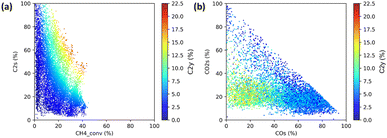 | ||
Fig. 6 Visualization of 12![[thin space (1/6-em)]](https://www.rsc.org/images/entities/char_2009.gif) 708 data points based on scatter plots. (a) CH4 conversion vs. C2 selectivity and (b) CO selectivity vs. CO2 selectivity with the C2 yield indicated by the color. Reprinted with permission from ref. 2. Copyright 2019 American Chemical Society. 708 data points based on scatter plots. (a) CH4 conversion vs. C2 selectivity and (b) CO selectivity vs. CO2 selectivity with the C2 yield indicated by the color. Reprinted with permission from ref. 2. Copyright 2019 American Chemical Society. | ||
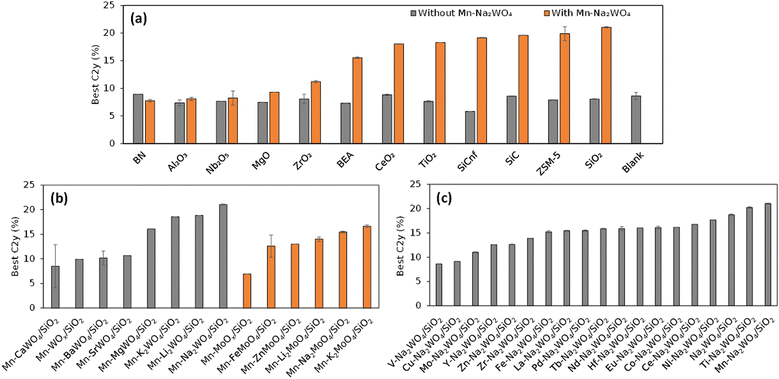 | ||
| Fig. 7 Best C2 yield of individual catalysts: (a) Mn–Na2WO4/support, (b) Mn–M21–2M3O4/SiO2, and (c) M1–Na2WO4/SiO2. Reprinted with permission from ref. 2. Copyright 2019 American Chemical Society. | ||
Further HTE was performed where 300 catalysts were randomly selected from 36![[thin space (1/6-em)]](https://www.rsc.org/images/entities/char_2009.gif) 540 M1–M2–M3/support catalysts, prepared, and evaluated under 135 reaction conditions, leading to the generation of 39
540 M1–M2–M3/support catalysts, prepared, and evaluated under 135 reaction conditions, leading to the generation of 39![[thin space (1/6-em)]](https://www.rsc.org/images/entities/char_2009.gif) 285 data points. Fig. 8 shows a scatter plot when these 291 catalysts are represented by their best C2 yield data points out of the 135 reaction conditions. The best C2 yield of the 291 catalysts was distributed in the range of 0–21%. With respect to the best C2 yield of about 10% for the non-catalytic reaction, catalysts with their best C2 yield greater than 13%, in the range of 7–13%, and lower than 7% are regarded as positive, neutral and negative catalysts, respectively. Li > (Mg, Mo, Ce, Eu) > (Ba, La, Hf) as the M1–M3 elements and basic supports like BaO and La2O3 are frequently seen in positive catalysts. Meanwhile, mid-to-late transition metal elements and acidic or redox-active supports are frequently observed in negative catalysts. However, elements and supports that frequently appear in positive catalysts are also seen in negative catalysts, and vice versa. As is obvious to researchers in catalysis, the performance of a catalyst largely depends on the combination, and what is truly desired is the discovery of a synergistic combination such as Mn–Na2WO4/SiO2. Accordingly, the combinatorial catalyst design was modeled by a decision tree (Fig. 9), where the catalysts are classified into positive and non-positive ones according to the presence or absence of each element (or the group of elements) and support. One can see that the main branches of the decision tree are devoted to specific supports, suggesting that the combinatorial design is dependent on the nature of the support. The predictive power of the decision tree was verified by the fact that 16 out of 20 catalysts that are randomly selected from the positive list of the decision tree actually exhibited the best C2 yield greater than 13%.4 In this series of experiments, seven new catalysts with the best C2 yields exceeding 18% are identified, which are Na–Eu–W/ZrO2, Li–Mg–Zr/BaO, K–V–Mo/BaO, Sr–Mo–none/BaO, Mo–Cs–W/BaO, Mg–Mo–Hf/BaO, and Li–Mo–La/BaO. Moreover, by extracting heuristics for achieving low-temperature CH4 activation and those for selective formation of C2 compounds at a high temperature from the HTE data, a mixed support between La2O3 and BaO was found to be effective.25 Thus, the combination of HTE and data science enables an exploration of a huge materials space such as 36
285 data points. Fig. 8 shows a scatter plot when these 291 catalysts are represented by their best C2 yield data points out of the 135 reaction conditions. The best C2 yield of the 291 catalysts was distributed in the range of 0–21%. With respect to the best C2 yield of about 10% for the non-catalytic reaction, catalysts with their best C2 yield greater than 13%, in the range of 7–13%, and lower than 7% are regarded as positive, neutral and negative catalysts, respectively. Li > (Mg, Mo, Ce, Eu) > (Ba, La, Hf) as the M1–M3 elements and basic supports like BaO and La2O3 are frequently seen in positive catalysts. Meanwhile, mid-to-late transition metal elements and acidic or redox-active supports are frequently observed in negative catalysts. However, elements and supports that frequently appear in positive catalysts are also seen in negative catalysts, and vice versa. As is obvious to researchers in catalysis, the performance of a catalyst largely depends on the combination, and what is truly desired is the discovery of a synergistic combination such as Mn–Na2WO4/SiO2. Accordingly, the combinatorial catalyst design was modeled by a decision tree (Fig. 9), where the catalysts are classified into positive and non-positive ones according to the presence or absence of each element (or the group of elements) and support. One can see that the main branches of the decision tree are devoted to specific supports, suggesting that the combinatorial design is dependent on the nature of the support. The predictive power of the decision tree was verified by the fact that 16 out of 20 catalysts that are randomly selected from the positive list of the decision tree actually exhibited the best C2 yield greater than 13%.4 In this series of experiments, seven new catalysts with the best C2 yields exceeding 18% are identified, which are Na–Eu–W/ZrO2, Li–Mg–Zr/BaO, K–V–Mo/BaO, Sr–Mo–none/BaO, Mo–Cs–W/BaO, Mg–Mo–Hf/BaO, and Li–Mo–La/BaO. Moreover, by extracting heuristics for achieving low-temperature CH4 activation and those for selective formation of C2 compounds at a high temperature from the HTE data, a mixed support between La2O3 and BaO was found to be effective.25 Thus, the combination of HTE and data science enables an exploration of a huge materials space such as 36![[thin space (1/6-em)]](https://www.rsc.org/images/entities/char_2009.gif) 540 catalysts and opens the possibility of giving novel catalyst systems without relying on previous knowledge.
540 catalysts and opens the possibility of giving novel catalyst systems without relying on previous knowledge.
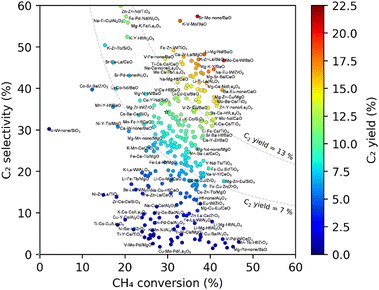 | ||
| Fig. 8 Scatter plot representation of the best C2 yield data points for randomly sampled catalysts. Reprinted with permission from ref. 4. Copyright 2021 American Chemical Society. | ||
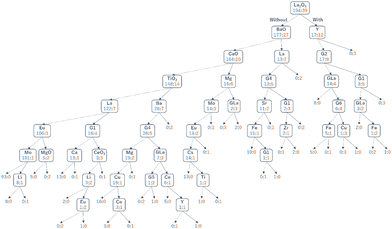 | ||
| Fig. 9 Decision tree that describes a relationship between the combinatorial catalyst design and the OCM performance. Catalysts are represented by the presence/absence of specific components in the composition, and classified according to their C2 yield with respect to the threshold (13%) into positive ones (orange) and non-positive ones (light blue). Note that GX corresponds to the group (1–12 and lanthanoid) in the periodic table. Reprinted with permission from ref. 4. Copyright 2021 American Chemical Society. | ||
5 High throughput experiment and machine learning
Because low-temperature OCM is attractive from the viewpoint of industrial application, further discoveries of potential catalysts are envisaged. Here, HTE catalysts data is used to design low temperature OCM catalysts. In particular, HTE is examined with high-temperature OCM (700–1000 °C); therefore, a direct machine learning prediction might not match fundamentally with the target for low-temperature OCM (approx. 400–600 °C). To overcome the mismatch between the collected and target area, the authors set the assumption in the output of the knowledge from the machine learning regression field made with high-temperature OCM features for designing low-temperature OCM catalysts. The selected ternary-element components supported catalysts (M1–M2–M3/support) based on HTE dataset-derived machine learning prediction showing higher C2 yield indicated friendly element combinations on the target support, which might have contributed to enhancement of the original nature of the support itself. This assumption has arisen on the basis of the nature of machine learning engineering, which can be adapted to find popular trends in data.30 Reportedly, La2O3-based catalysts have exhibited the unique character of low-temperature OCM, but multiple-components supported La2O3 catalysts are rarely reported.31 Therefore, investigation of potential M1–M2–M3 components enhancing La2O3-based low-temperature OCM catalysts is selected as the next subject. Applying the SVR on the HTE dataset (40![[thin space (1/6-em)]](https://www.rsc.org/images/entities/char_2009.gif) 330 points by 350 catalysts) suggests 41 multiple components in the La2O3 support category affording C2 yield higher than 16.01% at high-temperature OCM. Then, the top 20 C2 yield scoring catalysts were prepared and examined for OCM performance from 400 °C at 50 °C intervals. The result is shown in Fig. 10. The bare La2O3 denoted as none/La2O3 gives an onset temperature at 500 °C at the present reaction conditions (CH4/O2 = 2.0). Thus, appearances of C2 yield at 400 °C and 450 °C are a positive imprint of M1–M2–M3 components at this condition. The expected scores of C2 yield at the SVR field, which is higher from the top in the figure, do not show a linear trend with the enhancement capacity for the nature of La2O3. However, it is very interesting that 11 types of M1–M2–M3 components could be determined as effective components exhibiting C2 yield at 450 °C among 20 validations by means of such indirect ML application. The hit rate reached an attractive value of 55% (11 appearances/20 validations). Moreover, further implementation of data from literature combined with HTE datasets leads to finding two ternary-components derived from SVR per 12 validations. The hit rate for finding the low-temperature La2O3-based OCM is decreased to 16.7%; however it is important that addition of data from the literature expanded the possible area of elements for M1–M2–M3 component selections. Although element bias is recognized in selected M1–M2–M3 components, another regression of random forest regression (RFR) suggests a different 11 types per 12 validations based on HTE and literature data-driven indirect ML approach. This is a successful study on how to receive knowledge from the ML regression field based on the collected data made by different areas and researchers to design the target subject.28
330 points by 350 catalysts) suggests 41 multiple components in the La2O3 support category affording C2 yield higher than 16.01% at high-temperature OCM. Then, the top 20 C2 yield scoring catalysts were prepared and examined for OCM performance from 400 °C at 50 °C intervals. The result is shown in Fig. 10. The bare La2O3 denoted as none/La2O3 gives an onset temperature at 500 °C at the present reaction conditions (CH4/O2 = 2.0). Thus, appearances of C2 yield at 400 °C and 450 °C are a positive imprint of M1–M2–M3 components at this condition. The expected scores of C2 yield at the SVR field, which is higher from the top in the figure, do not show a linear trend with the enhancement capacity for the nature of La2O3. However, it is very interesting that 11 types of M1–M2–M3 components could be determined as effective components exhibiting C2 yield at 450 °C among 20 validations by means of such indirect ML application. The hit rate reached an attractive value of 55% (11 appearances/20 validations). Moreover, further implementation of data from literature combined with HTE datasets leads to finding two ternary-components derived from SVR per 12 validations. The hit rate for finding the low-temperature La2O3-based OCM is decreased to 16.7%; however it is important that addition of data from the literature expanded the possible area of elements for M1–M2–M3 component selections. Although element bias is recognized in selected M1–M2–M3 components, another regression of random forest regression (RFR) suggests a different 11 types per 12 validations based on HTE and literature data-driven indirect ML approach. This is a successful study on how to receive knowledge from the ML regression field based on the collected data made by different areas and researchers to design the target subject.28
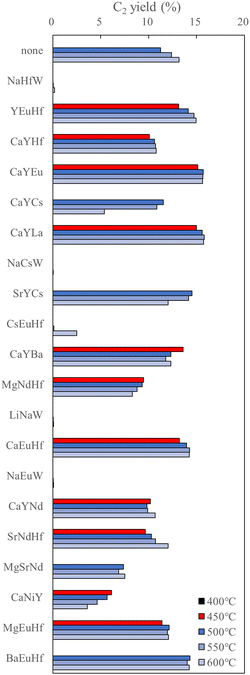 | ||
| Fig. 10 Plots of C2 yield for 20 types of M1–M2–M3 component-supported La2O3 based on SVR, together with no element supported La2O3 (none/La2O3). The order of element from top to bottom is corresponding to the predicted C2 yield from high to low scores at the SVR field based on HTS datasets. Reproduced from ref. 28 with permission from the Royal Society of Chemistry. | ||
The systematic HTEs supply a lot of datasets, which is helpful for understanding the trends of the data. Thus, identification of the next subject and determining the method to resolve the target would be possible from analyzing the HTE data characteristics. One earlier study was conducted on the modification of ternary-elements supported OCM catalysts with a manganese promoter under O2-lean conditions (CH4/O2 = 6.0). Fig. 11 shows the 2D plots of selected HTE datasets in accordance with the experiment conditions in validation. The O2-lean condition for OCM is a stricter condition for CH4 activation; however, there were nice performance catalysts affording a C2 yield over 10.0% observed in the HTE data.29 It is considered that co-existence of an appropriate element promoting CH4 activation can increase the CH4 conversion as well as the C2 yield value. Using the SVR field of HTE datasets, which might play a crucial role for enhancing the popular trends in the original data, the authors counted up the frequency of elements at a higher CH4 conversion value than 44.0%. Obviously, appearance of manganese (Mn) is the dominant element at high CH4 conversion values under the CH4/O2 = 6.0 condition. Then, investigation of the effect of the Mn promoter on the selected 10 catalysts from HTE data, which exhibited nice C2 yields as shown in Fig. 11, was conducted. Four catalysts, KVMo/BaO, LiMoNd/ZrO2, LiFeBa/La2O3 and LiBaLa/La2O3, received a positive impact on both CH4 conversion and C2 yield value with the Mn promoter. Optimization achieved 16.3% C2 yield with 88.4% selectivity over Mn-loaded LiFeBa/La2O3, and it is comparable to 15.0% C2 yield with 73.2% selectivity over a standard NaMnW/SiO2 catalyst under the same conditions at CH4/O2 = 6.0. It indicated that ML effectively assists scientists’ research strategies on catalyst modification.29
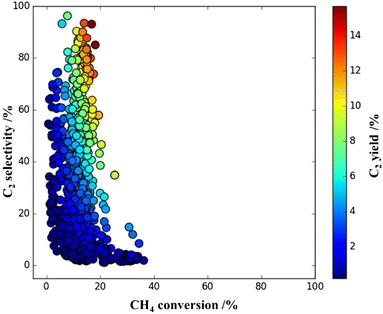 | ||
| Fig. 11 Selected 868 plots of C2 yield obtained by HTE experimentation with 300 catalysts at a 2D scale of C2 selectivity and CH4 conversion under the reaction conditions of the flow rate (20 mL min−1), CH4 + O2 conc. (85 vol%), and CH4/O2 ratio (6.0) in an earlier report. Reprinted with permission from ref. 29. Copyright 2022 American Chemical Society. | ||
6 New concepts in catalysts informatics
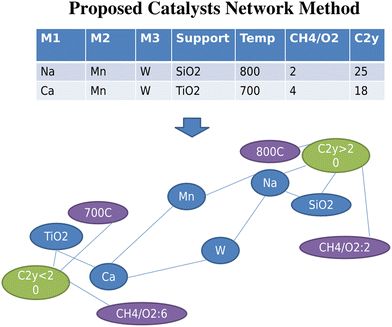
Three new concepts in catalysts informatics are proposed. The first concept is to construct the catalyst data network.33 This idea is based on the Semantic Web and ontology where the meaning and relationship of words and data are represented in the network. In particular, a catalyst network is constructed based on the proposed method shown in Fig. 12. Fig. 12 shows two catalyst datasets as an example. Each catalyst dataset consists of three metals, support, reaction temperature, and CH4/O2 ratio and corresponding C2 yield. In the network, two poles, C2 yield above and below 20, are created. Here, one can see that Mn and W connect to both high and low C2 yield nodes; therefore Mn and W are located in the middle space between the two poles. On the other hand, Ca and Na have low and high C2 yield, respectively, and therefore, Ca and Na are located at low and high C2 poles. In the same fashion, experimental conditions, temperature and CH4/O2, are also placed in appropriate locations. Thus, the relationships between the data become obvious. This network method is then applied to OCM catalysts big data as shown in Fig. 13. Fig. 13 demonstrates that in doing so, good and bad catalyst compositions and experimental conditions become clear. In other words, researchers can design catalysts that could result in high C2 yields as well as understand which elements should be avoided during the catalyst design process. By utilizing the network illustrated in Fig. 13, K–V–Er–BaO is designed where it has a C2 yield of 20%. One can see that this method is particularly powerful as researchers can see the relationships in data and can design catalysts according to these relationships, making this method a white box method. Although it has been demonstrated that machine learning is a powerful tool for designing catalysts from catalyst data, one of its main drawbacks is the inability to see the details regarding how the machine designs the catalysts, making it a blackbox method. This network method helps solve the blackbox issue in a way that machine learning is unable to do, opening the possibilities for the development of a catalyst search engine as well as a potential data structure for future artificial intelligence.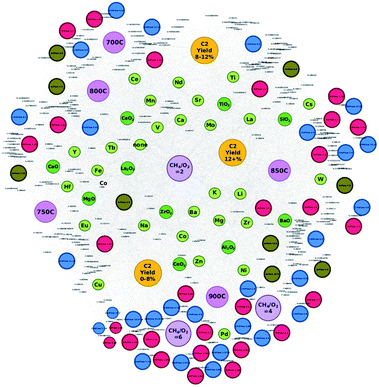 | ||
| Fig. 13 Catalyst network using oxidative coupling of methane catalysts big data. The relationships between C2 yield and composition and experimental conditions are unveiled. Reproduced from ref. 32 with permission from the Royal Society of Chemistry. | ||
The next proposed concept is the concept of catalyst genes.33 Within the OCM data, it is observed that some catalysts have different compositions but have similar optimal experimental conditions and catalytic activities as shown in Fig. 14. Fig. 14 demonstrates that Na–Ni–Y–MgO and Ni–Zn–La-Al2O3 have similar experimental conditions and catalytic performances. This suggests that there might be an alternative representation of catalysts. Here, patterns in OCM data are extracted and appropriate alphabetical symbols are assigned. Through combining with hierarchical clustering, an alternative representation – so called catalyst sequences – of catalysts are designed as shown in Fig. 15. These catalyst sequences are based on catalytic activities instead of chemical symbols. Because they reflect catalytic activity, it becomes possible to search for similar catalysts via natural language processing tools like edit distance. Thus, catalyst genes are proposed as an alternative representation of catalysts.
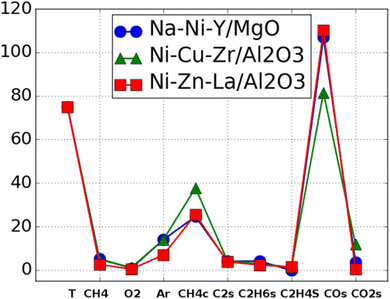 | ||
| Fig. 14 Catalyst performances of Na–Ni–Y/MgO, Ni–Cu–Zr/Al2O3, Ni–Zn–La/Al2O3 are visualized where those three catalysts have similar experimental condition and selectivities. Reprinted with permission from ref. 33. Copyright 2021 American Chemical Society. | ||
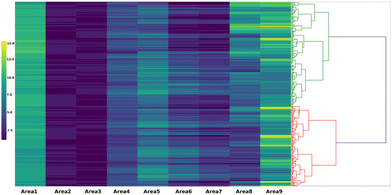 | ||
| Fig. 15 Catalyst genes. Reprinted with permission from ref. 33. Copyright 2021 American Chemical Society. | ||
Designing catalysts from first principles calculations has been a challenging matter as the link between experiments and calculations are ambiguous. One possible hypothesis is that first principles calculations result in local information such as atomic level phenomena while experiments result in the average information of complex local phenomena. Thus, one can consider that there is a gap between computations and experiments. In order to solve such a gap, computational results can be transformed into average information. This can be achieved by combining high throughput calculations and catalysts informatics.34 Within methane oxidation, high throughput calculations are performed to calculate methane related reactions over 1972 surface planes. Then, informatics is used to propose key catalytic compositions which result in active OCM catalysts. Suggested catalysts from network analysis, CoAg/TiO2, Mg/BaO, and Ti/BaO, are demonstrated as active OCM catalysts in experiment. Thus, combining high throughput calculations and informatics can be an alternative way to design catalysts.
Machine learning is also demonstrated to be powerful for constructing the reaction network.35 As previously shown, supervised machine learning solves the y = f(x) function. Here, y can be set to selectivity while x can be experimental conditions as well as other selectivities. For instance, it is demonstrated that C2H6 selectivity and experimental conditions in the OCM reaction have a strong correlation based on the cross validation score where C2H6 selectivity and experimental conditions are set as objective and descriptor variables, respectively. If experimental conditions are directly impacting C2H6 selectivity, one can consider that C2H6 is the first step reaction in OCM. On the other hand, C2H4 selectivity has a correlation when descriptor variables are experiment condition and C2H6 selectivity. This indicates that production of C2H4 is strongly coupled with C2H6; thus one can consider that to be the second step of the reaction in OCM. Based on the correlation between selectivities and experiment conditions, it becomes possible to draw a reaction map as shown in Fig. 16. Thus, machine learning can be potentially used to draw reaction maps.
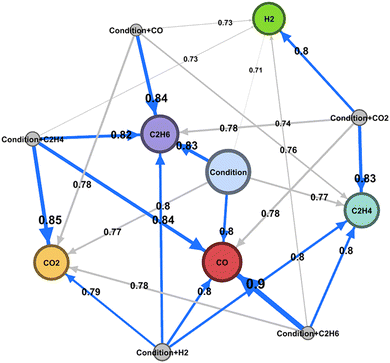 | ||
| Fig. 16 Oxidative coupling of methane reaction map created by machine learning. Reprinted with permission from ref. 35. Copyright 2020 American Chemical Society. | ||
Combined use of machine learning with data mining has the potential to be a powerful strategy for catalyst design. The direct design of low-temperature OCM catalysts is examined on the basis of 58 systematically-collected OCM catalyst datasets, which consisted of various metal oxides (19 catalysts), 1 wt% one-metal supported La2O3 (25 catalysts), 1 wt% indium (In) modified rare-earth oxides (10 catalysts), and 0.01–0.5 wt% In over lanthanoid oxides (4 catalysts) with corresponding C2 yield at 400–900 °C in 100 °C intervals. Then, Gaussian mixture model (GMM) with unsupervised machine learning is implemented to classify the common physical rules in a tagged group. Interestingly, these datasets can be represented in five categories by GMM, as shown in Fig. 17. To design low-temperature OCM catalysts, the features in Group 2 representing large production of C2 yield at 500 °C are applied for determining the common physical rules by item-set mining analysis.37 Then, metals of Mg, Al, Ca, Sc, Fe, Co, Ni, Cu, Zn, Ga, Sr, Ag, Cd, In, Ba, Es, Fm, Md, No, Lr, Rf, Db, Sg, Bh, Hs, Mt, Ds, Rg, and Cn were added to make 29 kinds, and support metal oxides of Y, La, Nd, Sm, Eu, and Gd to make six selections, which are proposed as important candidates for low-temperature OCM catalysts. Those selections are not included in the original datasets and have never been reported in previous papers. Interestingly, some selected catalysts such as Al/Y2O3 and Ag/Y2O3 gave low-temperature OCM features in validation. This study thus represented that unsupervised machine learning classification combined with data mining can open innovation for investigation of catalyst design based on the hidden rules of physicochemical properties.36
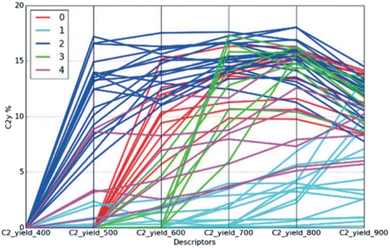 | ||
| Fig. 17 Parallel coordination of C2 yield at 400–900 °C. Color represents the predicted group by GMM. Reproduced from ref. 36 with permission from the Royal Society of Chemistry. | ||
7 Understanding catalysts in catalysts informatics
Catalytic activities are strongly coupled with catalyst structures as catalyst structures are considered to determine adsorption and diffusion of reactants and products. This means that catalyst design can be achieved if the effects of catalyst structure are understood. In addition, if catalyst structure can be controlled by catalyst composition and preparation methods, rational catalysts can be prepared according to the design guidelines. Accordingly, catalyst structure is analyzed in detail using various measurement techniques. For instance, pore size, pore volume, and specific surface area are investigated as they affect diffusion and adsorption of reactants and products. In addition, crystal structure, crystallinity, particle size, and local structure of active species including type of neighboring atoms, coordination number, and bond distance are also investigated as they are involved in adsorption and activation of compounds. Thus, various catalyst structure descriptors for machine learning are evaluated to understand how catalyst structure affects a catalytic reaction. For understanding the contribution of each structure descriptor, it is necessary to analyze complex multidimensional data consisting of structural descriptors and catalytic performance data obtained from various measurements and/or calculations. Here, machine learning can be a very powerful tool. Within catalysts informatics, machine learning is primarily used to predict catalytic activities such as C2 yield. However, one can consider that machine learning could be used to understand the relationship between the structure of catalysts and catalytic activities. In particular, supervised machine learning is essentially solving the y = f(x) function where, as previously mentioned, y and x stand for objective variable and descriptor variable, respectively. Here, y represents catalytic activities while x can represent structural information; thus, catalytic activities and structural information can be linked.As a case study, the structural effect of Cu zeolite catalysts for the partial oxidation of methane is investigated as Cu zeolites have been found to show catalytic activity. The catalytic performance of Cu zeolites has been suggested to depend on the zeolite framework structure and the local structure around Cu active sites, although which catalyst features are strongly responsible for the catalytic performance is still under debate. Therefore, the structural effect of Cu zeolite for methane oxidation has been investigated using machine learning.38 Here, 28 different Cu zeolites were prepared. The factors varied include the zeolite framework structure (CHA, MOR, FAU, FER, BEA), the Si/Al ratio of the zeolite, and the Cu loading amount. Methane partial oxidation is performed using the prepared Cu zeolite catalysts with H2O2 as the oxidant. The catalytic activity is evaluated from the amount of partially oxidized compounds per Cu loading amount. Meanwhile, the structural data of Cu zeolite catalysts are collected. The structural data of zeolite framework including framework density (FD), topological density (TD10), channel dimensionality (CD), maximum diameter of a sphere that can be included (DI), those that can diffuse along three unit vectors (Da, Db, Dc), and accessible volumes (AV) were taken from the database of zeolite structures of the International Zeolite Association. Si/Al2 ratios of zeolites (Si/Al2), the Cu loadings (Cu wt), and the ion exchange rates (IE) were determined by ICP/XRF measurements. The specific surface areas (SA) were evaluated by N2 adsorption. The absorption edge energies of Cu K edge XAFS spectra (E at abs 0.5) is evaluated as a descriptor for the oxidation state of Cu species. The peak intensities at ca. 1.5 and 2.1 Å in Cu K edge FT-EXAFS spectra (Int at 1.5 Å and Int at 2.1 Å) are extracted as descriptors of the local structure of the Cu active site. Consequently, 15 descriptors of Cu zeolites are collected. Then, a model for the 16-dimensional relationship between the catalytic activity and the 15 descriptors is built using random forest classification. Fig. 18 shows the importance of each descriptor evaluated by the random forest classification. 7 variables including Si/Al2 ratio, Cu wt, IE, SA, E at abs 0.5, Int at 1.5 Å, and Int at 2.1 Å, which are the descriptors of catalyst compositions or structures, show higher importance than the descriptors of zeolite types and pores including FD, TD10, DI, Da–c, AV and CD. The result suggests that the catalyst composition and/or structure are the key descriptors of catalytic activity. It is known that the compositions of Cu-zeolite strongly affect the local structures of the Cu site. Thus, the high importance of Cu zeolite compositions is considered to be derived from the correlation between the composition and the local structure. Accordingly, the local structures of Cu sites are considered to determine the catalytic activity. Once the structure descriptors are revealed as the activity controlling factors, the active site structures can be proposed based on the relationship between the catalytic activity and the structure descriptors. In the case of Cu zeolite catalysts for CH4–H2O2 reaction, square planar and distorted square pyramid structures are proposed as highly active structures of the Cu species in FAU and MOR type zeolites. Therefore, it has been demonstrated that machine learning is a powerful technique for understanding active structures of solid catalysts based on many descriptors of solid catalysts.
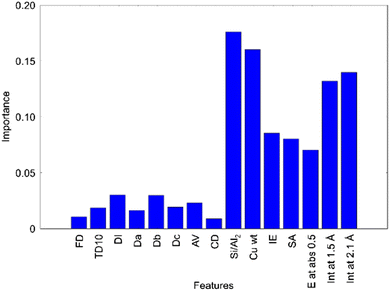 | ||
| Fig. 18 Importance of various descriptors of Cu zeolite catalysts for CH4–H2O2 reaction evaluated from the catalyst data of 28 Cu zeolites using the random forest classification.38 | ||
8 Bayesian optimization
The idea behind Bayesian optimization is to find a way to reduce the number of experimental steps for achieving the desired catalytic activities. Here, Bayesian optimization is used to find the optimal Cu zeolite in the partial oxidation of methane.39 In particular, Gaussian process regression combined with acquisition function provides the expected improvement, where the expected improvement indicates the optimal data points having high catalytic activities with high standard deviation. The designed Bayesian optimization workflow is shown in Fig. 19. Cu–CHA catalysts are prepared by changing the Cu ion exchange ratio at five different Si/Al2 ratios of CHA zeolite at the 1st cycle of the Bayesian optimization process. The catalysts are tested for a flow type methane partial oxidation using molecular oxygen as the oxidant, and the turnover number (TON) and selectivity of each catalyst are evaluated. Bayesian optimization is performed to predict both TON and selectivity. Expected improvement is used as an indicator to find optimal catalyst compositions that would increase both TON and selectivity. In the 2nd cycle of the Bayesian optimization workflow, four candidate catalysts predicted in the 1st cycle are tested. As a result, a fully optimized Cu–CHA catalyst is found where it has TON and selectivity of 2.9 molMeOH+HCHO/molCu and 100%. Thus, the Cu–CHA catalyst for the CH4–O2 reaction is optimized efficiently using Bayesian-optimization-based machine learning. Hence, machines can be used to minimize the number of experiments for achieving the desired goal.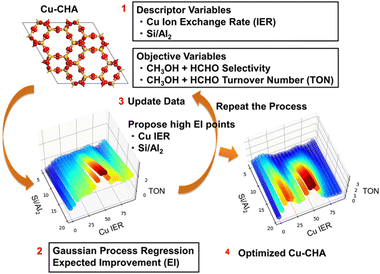 | ||
| Fig. 19 Bayesian optimization workflow for improving Cu–CHA catalysts for partial oxidation of methane using molecular oxygen as the oxidant. Reproduced by permission of the American Chemical Society.39 | ||
9 Catalysts informatics platform
Catalyst Acquisition by Data Science, CADS, has been developed as a catalysts informatics platform.20 CADS is operated under https://cads.eng.hokudai.ac.jp/ where the user can create an account for free. The goal of CADS is to provide a graphical user interface in which users can experience catalysts informatics without any programming skills or knowledge of catalysts informatics. The basic functions of CADS are shown in Fig. 20. Fig. 20 shows that CADS offers database sharing, machine learning, data visualization, and image processing. One of the main features of CADS is that CADS acts as a catalyst data center. The user can upload and share their own catalyst data where users can also choose whether data can be public or private. This would benefit the users who wish to share their catalyst data with the community while also giving users the choice to not share the data. All data presented in this article including OCM high throughput experimental data is available at CADS. Any user can freely download the publicly-available catalyst data via CADS. This is important in the early stage of catalysts informatics as there are still not many catalyst datasets available for use. It must be noted that ontology for data in CADS is still ongoing research. Another key feature of CADS is that CADS provides a graphical user interface for catalysts informatics tools such as data visualization and machine learning. In general, advanced data visualization and machine learning requires basic knowledge and programming skills which obstruct the implementation of catalysts informatics. CADS is thus designed for the researchers to enter and try catalysts informatics.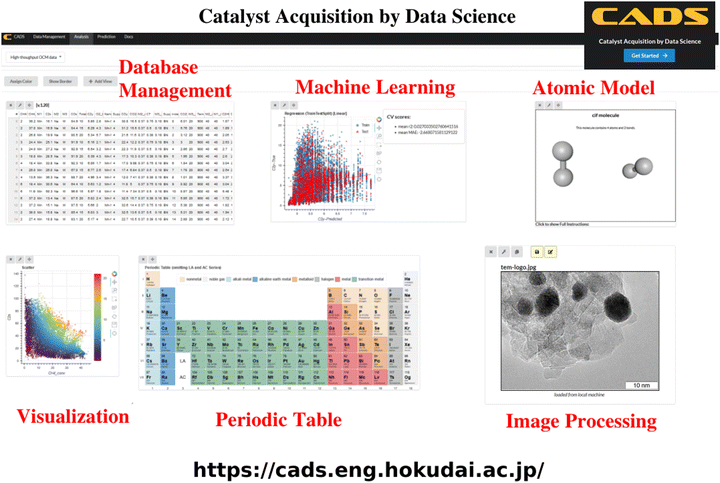 | ||
| Fig. 20 Basic function of catalysts informatics platform, CADS.20 | ||
One of the unique features of data visualization in CADS is that CADS offer interactive data visualization as shown in Fig. 21. Fig. 21 shows that CH4 conversion against C2 selectivity in OCM reaction is visualized in a scatter plot. Next to the scatter plot, a data table is also displayed. Here, the users can select certain areas in the scatter plot where the selected data points are immediately reflected to a data table; thus, the users can view the details of the data points at the same time as the plots. In CADS components, data is linked throughout the workspace, enabling users to explore the data from various points of view. Hence, CADS offers the users the ability to perform interactive data visualization. In the same fashion, CADS makes the use of machine learning as simple as possible. In particular, CADS offers a graphical user interface for machine learning as shown in Fig. 22. The users can select desired supervised and unsupervised machine learning algorithms by a click while the users can also select descriptor variables and objective variables. The trained machine is then evaluated by cross validation by a click. Thus, CADS offers users the complete experience of catalysts informatics.
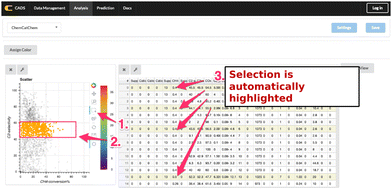 | ||
| Fig. 21 Interactive visualization in CADS.20 | ||
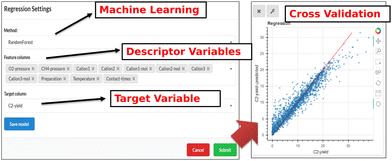 | ||
| Fig. 22 Graphical user interface for machine learning in CADS.20 | ||
10 Ontology
Data has become central to many different types of research. Thanks to the exponential growth of available data and with congruent developments and advancements in technology, it has become possible to conduct research from the aspect of data, which has resulted in the establishment of informatics as a fourth paradigm of science.9 With informatics, data is the central focus where knowledge, trends, and patterns are extracted from data using various data science techniques. Data science techniques have successfully been used towards many different aspects of material and catalyst design. However, as data science research develops further, it becomes clear that the quality and structure of data must also be addressed before informatics can truly flourish.40There are many issues that appear when attempting to use existing data, particularly for multidisciplinary fields like materials science where many different research disciplines are involved. To start, materials data typically is generated from experiments, theory, or computation. This, in itself, can potentially lead to problems as each type of data source deals with different data formats. For instance, experimental data may consist of tables of numbers and readings while computational data may be composed only of structural models of molecules. Without some type of preprocessing, it is very difficult to use the data as it is presented. Thus, understanding the data type helps one to understand what types of data preprocessing should occur.
More frequently, researchers are faced with issues regarding the organization and quality of databases that are made available to use. As seen in Fig. 23, these issues can be reduced to four areas: data loss via media conversion, exclusion of meta-data, communication barriers, and lack of field-wide standardization. As mentioned previously, data is available in a wide variety of formats, including multimedia such as imagery, graphs, and computational models. Important information to be found within the data's original format is often lost or miscommunicated when converted to another format (e.g. translating information from an image into text or numbers). In addition to this, there is little support for the inclusion of meta-data when creating databases. Meta-data often includes extra information regarding the raw data such as more detailed explanations about chosen categories, insights from the researchers, and clarifications about definitions and other information. By excluding this information from the database, there is an increased probability of data being misinterpreted or disregarded completely.
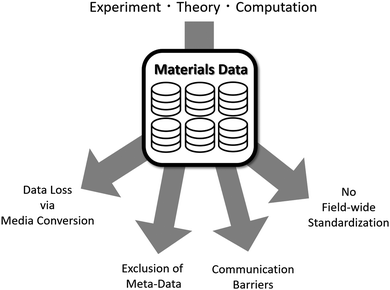 | ||
| Fig. 23 Composition of materials data and the issues faced by the materials science community. Reprinted with permission from ref. 8. Copyright 2019 American Chemical Society. | ||
Communication barriers are also encountered, especially by researchers conducting materials science research, which can also affect a database's usability. The materials science community is composed of many different disciplines of science – all which have different terminologies, assumptions, and perspectives when conducting research. These factors influence how one creates data as well as how one interprets data. To start, there are terms that may be the same between different fields, but their definitions are not the same. Without clarifying what these terms mean, the data is likely to be misinterpreted when shared across disciplines and lead to an increased chance of error. Additionally, with differences in interests, researchers who wish to utilize data from fields outside of their field of expertise may find that existing databases may not include the desired information. This could be due to factors such as the inability to collect said information, errors within the database that prevent access, or to the simple fact that the original researchers were not interested in said information and therefore did not record. Finally, there is no field-wide standardization in place to guide how databases should be created. This has led to databases being created according to individually-determined rules and assumptions, resulting in databases that range from being meticulously designed with clear definitions and notations to roughly put-together databases that have terms and category labels that are difficult to interpret. All of these factors make it difficult to understand and use, and thus result in researchers either spending extra time and efforts towards data preprocessing or ignoring the database altogether and recreate the data themselves.
In an effort to make it easier to share data with other researchers, ontology is proposed as an alternative method of structuring data.8,16 Traditionally, ontology is concerned with the definitions and rules that define existence within a specific world. This concept can be applied towards materials data. In an ontology, three components must be considered: groups (represented as classes and subclasses), individuals (also referred to as “instances”), and the relationships between these individuals (represented as object properties). Group/class definitions are based on description logic that define the shared sets of characteristics that members of a particular group share. Individuals/instances represent collections of different types of raw information, while relationships between individuals are defined using object properties, which are based on description logic. This structure helps one to understand how an object is defined, how it relates to other objects, and how it is different – and thus, unique – when compared to other objects. Fig. 24 illustrates a small example of how this structure may appear visually. Here, the subclass “Crystal Structure” is shown to be a class composed of other subclasses, which represent different types of crystal structure that a material within the database may have. The definition for the class connects the class to the raw data, connecting the ontology to the data. The ontology then infers class membership through this definition, which is seen by the list of instances (in this case, atomic elements) that are assigned to this class by the ontology.
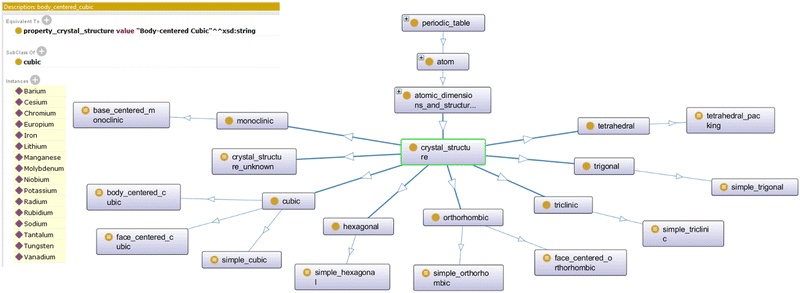 | ||
| Fig. 24 Subclasses, basic class definition, and instances/individuals that have inferred class membership. Reprinted with permission from ref. 16. Copyright 2018 American Chemical Society. | ||
This type of structure is useful for databases for several reasons. To start, web ontology languages provide the means to clearly define raw data while also incorporating meta-data. This allows the database creators to incorporate multiple layers of information with the raw data while also guiding users through interpreting the data they are looking at. This not only enriches the database and helps improve the data-to-knowledge process, but it also helps decrease the probability of translation errors that may otherwise occur when interpreting and preprocessing data. Structuring data in this manner also helps preserve relational information that may come with this data. This becomes important, for example, when one is dealing with raw data that is dependent on other data types (e.g. when processing experimental data like C2 yield and C2 selectivity). If this relational information is not incorporated, then each category is treated independently, thereby missing any relational trends or patterns that may be present within the data. Any previously-understood connections that are present within the data will also be included, making the data more multidimensional. Finally, restructuring data in this manner makes it possible for machines to navigate the data. Incorporating relational data through web ontology languages allows a machine to query data. This is very useful as it allows for machines to take user input and search the data within the ontology for cases that match the search input, potentially reducing a lot of time that would normally be spent manually reviewing data. This effect compounds exponentially when dealing with very large databases. Through the use of description logics defined using the data relation definitions, it becomes possible for researchers to navigate vast amounts of data and extract information that meets a set of defined restrictions or other types of query, thereby saving time that would otherwise be spent manually navigating the data.
Ontology is not only useful for structuring databases, but it is also a useful tool that provides a way for researchers to define information that is sourced from their personal expertise and experiences. Researchers are typically experts in specific fields and spend years studying topics that relate to their particular field of expertise and research. These experiences indirectly influence researchers as they work, subtly guiding them in ways that can introduce bias into research and decision-making. The large collection of knowledge that each researcher holds also allows their minds to unconsciously make connections and observations, which often leaves scientific discovery a product of “aha!” moments and accidents. This makes the scientific discovery process an unintentional process. By introducing ontology, it becomes possible to introduce structure into this process and make it a more intentional process.
Fig. 25 illustrates how introducing ontology can positively impact material design. To start, researchers can “extract” their knowledge of a topic and define it using ontology. This provides a framework that helps outline researchers’ intuition and pre-existing knowledge in a format that is compatible to use with databases. Ontologies can then be written for material data, where additional data properties or ontologies can be used to connect the scientists’ experiences and observations with the ontologies of the databases. In doing so, the following can be accomplished: querying/searching large databases, standardization of material data, and rearrangement of materials classification.
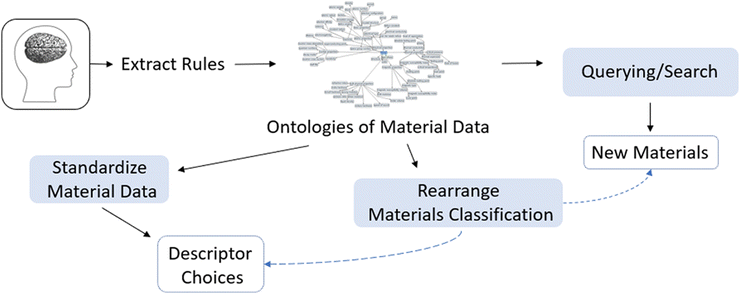 | ||
| Fig. 25 Benefits of using ontology. Reprinted with permission from ref. 8. Copyright 2019 American Chemical Society. | ||
An immediate benefit of ontology is the ability to query, or search, data. By defining data and its relationships with web ontology languages, it becomes possible for machines to navigate data while incorporating meaning in its search. This is important, as existing methods do not account for semantic correctness when attempting to navigate data without additional user input. This system lets a machine use the defined logics to find output that matches a given set of input or restrictions given by a user with databases that are so large it is nearly impossible for an individual to manually search themselves. This leads to the possibility of materials being discovered where the machine may find output that would be considered unconventional or unusual by the average researcher. These types of discoveries may not occur organically, save for the occasional accident, as researchers are affected by underlying biases and thus may unintentionally disregard possibilities due to incomplete understandings or other factors. Ontology helps overcome this by defining researchers’ knowledge in a way that provides structure.
Ontology also allows the possibility of standardizing material data. It allows for a clearer definition of how a material property may be expressed in a format that can be used across disciplines. This can potentially act as an industry standard for researchers to follow while also leading towards an increase in potential candidates for descriptor choices. Coupled with its ability to connect databases together into a larger network of interconnected databases, it is possible to update how different types of data relates to others as discoveries are made by redefining classes or introducing data properties, thereby helping to keep the material data up-to-date with current scientific knowledge.
Finally, ontologies can redefine how materials are classified. Through the use of data properties and description logic, it becomes possible for materials to be treated differently. As definitions for different properties are expressed and collected, it becomes possible for machines to infer class membership without being explicitly defined by a researcher. This is particularly useful when designing materials. By using these ontologies, machines can therefore process data from a more semantic perspective and classify information that researchers may not ever consider or even think to consider. Treating data in this manner also presents materials from a perspective, potentially challenging how researchers traditionally view materials.
Application of ontology towards materials data is still in its infancy yet shows much promise. With wider adoption of ontology and further development, it is possible to develop large networks of databases that connect and interact with each other based on semantics. This makes it possible to search databases based on meaning in a way that machines can read. In doing so, it becomes possible to search very large amounts of data in a short amount of time based on researchers’ experiences and scientific knowledge. Querying in this manner also opens the possibility of attempting inverse problems and directly designing materials, presenting the possibility of creating a knowledge-based “search engine” for researchers. With enough development and investment by the research community, there is a very real possibility of researchers foregoing machine learning techniques – thanks to reductions in redundancies in research projects – and potentially eliminate the need for machine learning, freeing up time and resources that can then be allocated to other projects. Ontology, thus, is potentially a crucial component towards advancements in material design and database construction and management.
11 Conclusion
Catalyst data is expected to become the central driving force of future catalyst design efforts where catalysts informatics will be used in order to uncover hidden trends and patterns within large sets of data and assist in targeted catalyst design. Three components of catalysts informatics are key to the successful development and establishment of catalysts informatics as a viable approach for catalyst design: catalyst data, knowledge extraction from data, and catalyst data platforms. The proper development of each of these areas benefits catalyst design in a variety of ways. To start, machine learning techniques can be used in order to help improve experiment design and catalyst performance while also making it possible to design catalysts that are predicted to have desired properties. Catalyst data can also be mass-produced in a standard format through the use of high throughput experiments, making it possible to properly apply data science techniques to the data. Concepts such as network analysis and ontology can also be applied to this data, making it possible to not only be able to introduce meaning into databases, but also be able to see what factors are associated with desirable catalyst activity. Finally, designing a catalyst data platform helps make catalysts informatics accessible by hosting catalyst databases and also providing graphic user interfaces that allow for users to analyse data across multiple windows. Thus, by developing these areas, it becomes possible for catalysts informatics to develop strongly and potentially revolutionize the entire catalyst design process.Conflicts of interest
There are no conflicts to declare.Acknowledgements
This work is funded by Japan Science and Technology Agency (JST) CREST Grant Number JPMJCR17P2. Professor Wataru Ueda and all CREST catalysts informatics project members are acknowledged for discussing the catalysts informatics.Notes and references
- I. Fechete, Y. Wang and J. C. Védrine, Catal. Today, 2012, 189(1), 2–27 CrossRef CAS
.
- T. N. Nguyen, T. T. P. Nhat, K. Takimoto, A. Thakur, S. Nishimura and J. Ohyama,
et al.
, ACS Catal., 2020, 10(2), 921–932 CrossRef CAS
.
- J. Ohyama, S. Nishimura and K. Takahashi, ChemCatChem, 2019, 11(17), 4307–4313 CrossRef CAS
.
- T. N. Nguyen, S. Nakanowatari, T. P. N. Tran, A. Thakur, L. Takahashi and K. Takahashi,
et al.
, ACS Catal., 2021, 11(3), 1797–1809 CrossRef CAS
.
- S. Lacombe, C. Geantet and C. Mirodatos, J. Catal., 1995, 151(2), 439–452 CrossRef CAS
.
- K. Takahashi, L. Takahashi, T. N. Nguyen, A. Thakur and T. Taniike, J. Phys. Chem. Lett., 2020, 11(16), 6819–6826 CrossRef CAS PubMed
.
- T. N. Nguyen, K. Seenivasan, S. Nakanowatari, P. Mohan, T. P. N. Tran and S. Nishimura,
et al.
, Mol. Catal., 2021, 516, 111976 CrossRef CAS
.
- L. Takahashi and K. Takahashi, J. Phys. Chem. Lett., 2019, 10(23), 7482–7491 CrossRef CAS PubMed
.
- K. Takahashi, L. Takahashi, I. Miyazato, J. Fujima, Y. Tanaka and T. Uno,
et al.
, ChemCatChem, 2019, 11(4), 1146–1152 CrossRef CAS
.
- A. J. Medford, M. R. Kunz, S. M. Ewing, T. Borders and R. Fushimi, ACS Catal., 2018, 8(8), 7403–7429 CrossRef CAS
.
- G. Keller and M. Bhasin, J. Catal., 1982, 73(1), 9–19 CrossRef CAS
.
- G. Hutchings, M. Scurrell and J. Woodhouse, Chem. Soc. Rev., 1989, 18, 251–283 RSC
.
- U. Zavyalova, M. Holena, R. Schlögl and M. Baerns, ChemCatChem, 2011, 3(12), 1935–1947 CrossRef CAS
.
- A. A. Latimer, A. Kakekhani, A. R. Kulkarni and J. K. Nørskov, ACS Catal., 2018, 8(8), 6894–6907 CrossRef CAS
.
- K. T. Dinh, M. M. Sullivan, P. Serna, R. J. Meyer, M. Dinca and Y. Román-Leshkov, ACS Catal., 2018, 8(9), 8306–8313 CrossRef CAS
.
- L. Takahashi, I. Miyazato and K. Takahashi, J. Chem. Inf. Model., 2018, 58(9), 1742–1754 CrossRef CAS PubMed
.
- K. T. Butler, D. W. Davies, H. Cartwright, O. Isayev and A. Walsh, Nature, 2018, 559(7715), 547–555 CrossRef CAS PubMed
.
- K. Takahashi, I. Miyazato, S. Nishimura and J. Ohyama, ChemCatChem, 2018, 10(15), 3223–3228 CrossRef CAS
.
- P. Schlexer Lamoureux, K. T. Winther, J. A. Garrido Torres, V. Streibel, M. Zhao and M. Bajdich,
et al.
, ChemCatChem, 2019, 11(16), 3581–3601 CrossRef CAS
.
- J. Fujima, Y. Tanaka, I. Miyazato, L. Takahashi and K. Takahashi, React. Chem. Eng., 2020, 5(5), 903–911 RSC
.
- S. Nishimura, J. Ohyama, T. Kinoshita, S. D. Le and K. Takahashi, ChemCatChem, 2020, 12(23), 5888–5892 CrossRef CAS
.
- S. F. Ji, T. C. Xiao, S. B. Li, C. Z. Xu, R. L. Hou and K. S. Coleman,
et al.
, Appl. Catal., A, 2002, 225(1–2), 271–284 CrossRef CAS
.
- R. Ramprasad, R. Batra, G. Pilania, A. Mannodi-Kanakkithodi and C. Kim, npj Comput. Mater., 2017, 3(1), 1–13 CrossRef
.
- C. Wulf, M. Beller, T. Boenisch, O. Deutschmann, S. Hanf and N. Kockmann,
et al.
, ChemCatChem, 2021, 13(14), 3223–3236 CrossRef CAS
.
- S. Nakanowatari, T. N. Nguyen, H. Chikuma, A. Fujiwara, K. Seenivasan and A. Thakur,
et al.
, ChemCatChem, 2021, 13(14), 3262–3269 CrossRef CAS
.
- S. Arndt, T. Otremba, U. Simon, M. Yildiz, H. Schubert and R. Schomäcker, Appl. Catal., A, 2012, 425, 53–61 CrossRef
.
- M. Yildiz, Y. Aksu, U. Simon, K. Kailasam, O. Goerke and F. Rosowski,
et al.
, Chem. Commun., 2014, 50(92), 14440–14442 RSC
.
- S. Nishimura, S. D. Le, I. Miyazato, J. Fujima, T. Taniike and J. Ohyama,
et al.
, Catal. Sci. Technol., 2022, 12(9), 2766–2774 RSC
.
- S. Nishimura, J. Ohyama, X. Li, I. Miyazato, T. Taniike and K. Takahashi, Ind. Eng. Chem. Res., 2022, 61(24), 8462–8469 CrossRef CAS
.
- W. Beker, R. Roszak, A. Wołos, N. H. Angello, V. Rathore and M. D. Burke,
et al.
, J. Am. Chem. Soc., 2022, 144(11), 4819–4827 CrossRef CAS PubMed
.
- Q. Zhou, Z. Q. Wang, Z. Li, J. Wang, M. Xu and S. Zou,
et al.
, ACS Catal., 2021, 11(23), 14651–14659 CrossRef CAS
.
- L. Takahashi, T. N. Nguyen, S. Nakanowatari, A. Fujiwara, T. Taniike and K. Takahashi, Chem. Sci., 2021, 12(38), 12546–12555 RSC
.
- K. Takahashi, J. Fujima, I. Miyazato, S. Nakanowatari, A. Fujiwara and T. N. Nguyen,
et al.
, J. Phys. Chem. Lett., 2021, 12(30), 7335–7341 CrossRef CAS PubMed
.
- K. Takahashi, L. Takahashi, S. D. Le, T. Kinoshita, S. Nishimura and J. Ohyama, J. Am. Chem. Soc., 2022, 144(34), 15735–15744 CrossRef CAS PubMed
.
- I. Miyazato, S. Nishimura, L. Takahashi, J. Ohyama and K. Takahashi, J. Phys. Chem. Lett., 2020, 11(3), 787–795 CrossRef CAS PubMed
.
- J. Ohyama, T. Kinoshita, E. Funada, H. Yoshida, M. Machida and S. Nishimura,
et al.
, Catal. Sci. Technol., 2021, 11(2), 524–530 RSC
.
-
T. Uno, M. Kiyomi and H. Arimura, Proceedings of the 1st international workshop on open source data mining: frequent pattern mining implementations, 2005, pp. 77–86 Search PubMed
.
- J. Ohyama, A. Hirayama, N. Kondou, H. Yoshida, M. Machida and S. Nishimura,
et al.
, Sci. Rep., 2021, 11(1), 1–10 Search PubMed
.
- J. Ohyama, Y. Tsuchimura, H. Yoshida, M. Machida, S. Nishimura and K. Takahashi, J. Phys. Chem. C, 2022, 126(46), 19660–19666 CrossRef CAS
.
-
K. Takahashi and L. Takahashi, Data in Materials and Catalysts Informatics, in Machine Learning in Materials Informatics: Methods and Applications, ACS Publications, 2022, pp. 239–246 Search PubMed
.
| This journal is © The Royal Society of Chemistry 2023 |


