 Open Access Article
Creative Commons Attribution 3.0 Unported Licence
Master equation modelling of non-equilibrium chemistry in stellar outflows†‡
John M. C.
Plane
 *a and
Struan H.
Robertson
b
aSchool of Chemistry, University of Leeds, Woodhouse Lane, Leeds LS2 9JT, UK. E-mail: j.m.c.plane@leeds.ac.uk
bDassault Systèmes, 334, Cambridge Science Park, Cambridge, CB4 0WN, UK
First published on 17th February 2022
Abstract
A current challenge in astrochemistry is to explain the formation of Fe–Mg silicate dust around evolved stars. The dust is observed to form within 2 to 3 stellar radii of oxygen-rich AGB stars, where the typical conditions are kinetic (translational) temperatures between 1200 and 1600 K, and total gas densities below 1011 cm−3. At these high temperatures, molecules with bond energies < 400 kJ mol−1 should be short-lived, and this results in kinetic bottlenecks in postulated mechanisms for converting the observed Fe, Mg, SiO and H2O into silicate. Here we show that, in the very low pressure regime of a stellar outflow, molecules can exhibit significant vibrational disequilibrium because optical transitions – both spontaneous and stimulated by the stellar radiation field – occur on a much faster timescale than collisions. As a result, relatively less stable molecules can form and survive long enough to provide building blocks to silicate formation. Here we use the molecule OSi(OH)2, formed by the recombination of SiO2 and H2O, as an example. When vibrational disequilibrium is accounted for in a master equation treatment which includes optical transitions, the quantity of metal silicates produced in a low mass loss rate evolved star (R Dor) is increased by 6 orders of magnitude.
Introduction
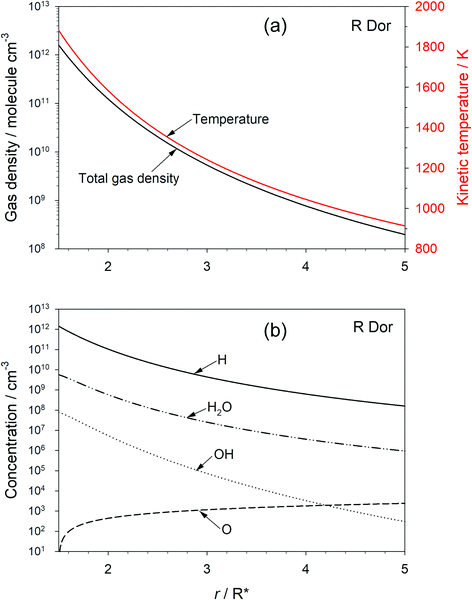
The chemical evolution of galaxies depends on mass loss from stars during the late stage of their evolution: asymptotic giant branch (AGB) stars lose a significant fraction of their mass in a short period, during which they tend to be surrounded by an optically thick shell of dust.1 The absorption and emission of radiation by this circumstellar dust creates a radiation pressure which induces a substantial acceleration in the outflow velocity of the dust (and gas), allowing escape from the star’s gravitational field. The dust is also a significant source of interstellar dust particles on which heterogeneous chemical synthesis can occur, and is central to the formation of new planets around young stars.In oxygen-rich outflows the dust is observed (by emission spectroscopy in the IR and far-IR) to be mostly composed of the Mg–Fe–silicates olivine and pyroxene (Fe2−2xMg2xSiO4 and FexMg1−xSiO3, respectively, where 0 ≤ x ≤ 1).2,3 However, a continuing challenge in astrochemistry is to explain how these metal silicates form from the components – chemically inert Fe, Mg, SiO – that are observed in the inner wind region close to the star. Although the overall formation of metal silicates from these components is thermodynamically favourable,4 identifying a convincing chemical network (i.e. a set of elementary reactions) which have favourable kinetics has proved to be elusive.5–9Fig. 1(a) illustrates the typical kinetic (i.e. translational) temperature and total gas density (mostly H2) modelled as a function of distance r (in units of stellar radius, R*) for the semi-regular variable AGB star R Dor.10–12Fig. 1(b) shows the concentration profiles of H, H2O, OH and O as a function of r, calculated using standard outflow chemistry.6 The inner edge of observable dust clouds is typically where the temperature in the outflow is between 1400 and 1000 K, in this case beyond 2R*. There are several reasons why this is a challenging environment in which to form metal silicates. Firstly, the precursor molecules need to be very stable to survive thermal dissociation. Secondly, the major constituents are H2 and H; these are chemically reducing species, which reduce metal oxides and hydroxides back to metal atoms, and SiO2 back to SiO.6 Indeed, we have shown recently using the Atacama Large Millimeter/submillimeter Array (ALMA) that metal oxides and hydroxides are not detectable in high sensitivity observations of R Dor; the upper limit abundances are in accord with our experimental and theoretical work on the reaction kinetics of these species with H and H2.13 Thirdly, the total pressure in the stellar outflow at 2R* is less than ∼0.003 Pa, which will slow down the rates of pressure-dependent recombination reactions. Lastly, the rates of formation of silicates from species such as Mg, Fe and SiO will have at least a second-order dependence on the total density in the outflow, and decrease rapidly as the flow expands away from the star.6
It has therefore been concluded that metal silicates are unlikely to form directly in an outflow at temperatures above 1000 K,7–9 so that attention has focused on more refractory alternatives in an O-rich stellar outflow, such as corundum (Al2O3),11 titania (TiO2),14 and perovskite (CaTiO3).6 If small “seed” particles of these substances were able to form in the inner wind at relatively high temperatures, then they might act as condensation nuclei for metal silicates in the cooler outer wind. However, this would still require metal silicate molecules to form at some point in the outflow.
In this discussion paper we explore the role of vibrational disequilibrium, which we define here as the internal vibrational temperature of a molecule being significantly different from its kinetic temperature. Vibrational disequilibrium can arise when the gas density is low enough so that optical transitions occur at a faster rate than collisional energy transfer. Nuth and co-workers pointed out in the 1980s that the assumption of local thermodynamic equilibrium (LTE) in some astrophysical regions may not be valid.15,16 This idea does not appear to have been pursued further, probably because the assumption of LTE greatly simplifies astrochemical modelling. However, observations in this century are clearly showing that molecules in the inner winds of AGB stars are far from LTE. For example, a very recent paper from Fonfría et al.17 shows that at 2R* around the AGB star Y CVn the vibrational temperature of HCN is only 590 K, compared with a kinetic temperature of 1800 K (see Fig. 9 of that paper); similarly low vibrational temperatures have been observed for C2H2 and C2H4.18,19
Here we consider the effect of vibrational disequilibrium on the formation and dissociation of the dehydrated form of silicilic acid, OSi(OH)2. This molecule is postulated to form in an outflow from the recombination reaction6
| SiO2 + H2O (+ M) → OSi(OH)2 ΔH°(0 K) = −284 kJ mol−1 | (1) |
| Ca + OSi(OH)2 → CaSiO3 + H2 ΔH°(0 K) = −234 kJ mol−1 | (2) |
| SiO + OH → SiO2 + H ΔH°(0 K) = −4 kJ mol−1 | (3) |
| OSi(OH)2 (+ M) → SiO2 + H2O | (−1) |
It is interesting to note that in the Faraday Discussions meeting of 1922 there was a vigorous debate about whether dissociation reactions were caused by collisions, the side championed by F. A. Lindemann, or by infra-red photon absorption (from the sun, or reactor walls) – the “radiation theory of chemical action” championed by the French physical chemist J. Perrin.23 The story of the relatively short-lived radiation hypothesis is well described by King and Laidler.24 Our aim is not to resurrect it here as originally proposed, but rather to show that in the very unusual environment of a stellar outflow optical transitions can have an important influence on the kinetics of recombination and dissociation.
Methods
Photochemistry of OSi(OH)2
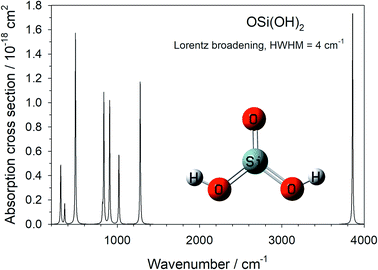
The harmonic vibrational frequencies and infra-red intensities of OSi(OH)2 were calculated at the B3LYP/6-311+g(2d,p) level of theory, using the Gaussian suite of programs.20 The absorption cross section spectrum is illustrated in Fig. 2, and the vibrational frequencies are listed in Table 1 (note that the 4th mode is infra-red inactive).| Mode number | Frequency/cm−1 | A ij /s−1 | B ij /m2 J−1 s−1 | B ij I /s−1 |
|---|---|---|---|---|
| a Not infra-red active. b Optical absorption/stimulated emission rate at 1R* for the AGB star R Dor. | ||||
| 1 | 313.19 | 0.468 | 3.04 × 10⁹ | 0.48 |
| 2 | 321.27 | 0.038 | 2.28 × 10⁸ | 0.037 |
| 3 | 361.07 | 0.21 | 8.92 × 10⁸ | 0.183 |
| 4a | 423.91 | — | — | — |
| 5 | 492.2 | 3.57 | 6.00 × 10⁹ | 2.2 |
| 6 | 820.78 | 3.5 | 1.27 × 10⁹ | 1.28 |
| 7 | 836.79 | 7.24 | 2.48 × 10⁹ | 2.51 |
| 8 | 907.47 | 8.13 | 2.19 × 10⁹ | 2.3 |
| 9 | 1019.81 | 5.75 | 1.09 × 10⁹ | 1.59 |
| 10 | 1278.14 | 18.8 | 1.81 × 10⁹ | 3.57 |
| 11 | 3859.43 | 243 | 8.51 × 10⁸ | 4.43 |
| 12 | 3861.1 | 1.91 | 6.67 × 10⁶ | 0.032 |
The integrated cross section σint (in units of cm2 Hz) for each vibrational mode was used to calculated the Einstein coefficients for spontaneous and stimulated emission (Aij and Bij, respectively) from the relations:25
 | (E1) |
 | (E2) |
![[thin space (1/6-em)]](https://www.rsc.org/images/entities/char_2009.gif) 000 nm by fitting a Planck distribution curve at 20
000 nm by fitting a Planck distribution curve at 20![[thin space (1/6-em)]](https://www.rsc.org/images/entities/char_2009.gif) 000 nm, the upper wavelength limit of the MARCS model. The values of Aij, Bij (in units of m2 J−1 s−1) and the product of Bij with the irradiance I (in units of J m−2 s−1 Hz−1 ≡ J m−2) at 1R* are listed in Table 1 for each vibrational mode. Note that close to the stellar surface the rates of spontaneous and stimulated emission are fairly similar, apart from the highest frequency modes 11 and 12 where spontaneous emission is much faster.
000 nm, the upper wavelength limit of the MARCS model. The values of Aij, Bij (in units of m2 J−1 s−1) and the product of Bij with the irradiance I (in units of J m−2 s−1 Hz−1 ≡ J m−2) at 1R* are listed in Table 1 for each vibrational mode. Note that close to the stellar surface the rates of spontaneous and stimulated emission are fairly similar, apart from the highest frequency modes 11 and 12 where spontaneous emission is much faster.
Optical transitions in the master equation
The Einstein coefficients in Table 1 are for excitation from the ground state to the first vibrational level of each mode. Here we assume that these coefficients remain constant for transitions between higher vibrational levels in each manifold. We also do not include overtone transitions (which would be formally correct for the harmonic oscillator approximation). The justification for these assumptions is that there is some evidence that the Einstein coefficients actually increase somewhat going up a vibrational manifold (which would enhance the role of optical transitions even more), and overtone transitions are much less probable.28Formation or dissociation of OSi(OH)2 is assumed to proceed via an excited adduct, which can either dissociate to SiO2 + H2O or be stabilized by collision with the H2 third body and spontaneous/stimulated emission, depending on the third body pressure and stellar radiation field i.e., the reaction occurs in a single well. In practice, the potential energy surface connecting SiO2 and H2O with OSi(OH)2 is somewhat more complicated: an initial SiO2–H2O complex rearranges over a barrier to produce an asymmetric form of OSi(OH)2, which then undergoes an internal torsional rotation to produce the most stable symmetric form. The complete surface is shown in the ESI,† along with all the relevant molecular parameters for carrying out a full multi-well master equation analysis. In fact, the SiO2–H2O complex and subsequent barrier are 89 and 59 kJ mol−1 below the entrance channel, respectively; we used the Master Equation Solver for Multi-well Energy Reactions program (MESMER)29 to show that these features are sufficiently submerged to have a very small effect (<1%) on the overall kinetics under the conditions of interest in this study. Hence, reaction (1) is treated here as a simple recombination involving a single well containing the more stable OSi(OH)2 isomer.
The internal energy of the OSi(OH)2 adduct was divided into a contiguous set of grains (width = 40 cm−1) containing a bundle of rovibrational states. Each grain was then assigned a set of microcanonical rate coefficients for dissociation, which were determined using inverse Laplace transformation to link them directly to krec,∞, the high-pressure limiting recombination coefficient. This was estimated using long-range transition state theory30 to be krec,∞ = 8.7 × 10⁻¹⁰ (T/1200 K)1/6 cm3 molecule−1 s−1. The density of states of each adduct was calculated with the vibrational frequencies in Table 1, without making a correction for anharmonicity, and a classical densities of states treatment for the rotational modes (see the ESI† for all rotational constants and vibrational frequencies used, including those of SiO2 and H2O). The probability of collisional transfer between grains was estimated using the exponential down model, where the average energy for downward transitions, 〈ΔEdown〉, was assigned a value of 200 cm−1 for H2 at 300 K and a small temperature dependence of the form T0.25.31 The probabilities for upward transitions were determined by detailed balance.31,32 The collision rate of H2 with the adduct as a function of temperature was calculated using Lennard-Jones parameters to characterise the intermolecular potential, giving Z(T) = 8.4 × 10⁻¹⁰ (T/1200 K)1/2 cm3 molecule−1 s−1.
The master equation, which describes the evolution with time of the adduct grain populations, is given by:
 | (E3) |
The master equation was then expressed in matrix form and solved via diagonalization to yield the recombination rate coefficient (k1) or dissociation rate coefficient (k−1) at a specified pressure and temperature.
Stellar outflow model
The stellar outflow is modelled here using a β-velocity law, which describes the net acceleration of the wind without explicitly considering pulsations:| vβ(r) = v0 + (v∞ − v0)(1 − R*/r)β | (E4) |
| T(r) = T*(r/R*)−α | (E5) |
 | (E6) |
The chemistry network in the model is taken from Plane.6 Measured rate coefficients are adopted from the NIST kinetics database,33 and those of other reactions (e.g. reactions (2), (3) and (−3)) were calculated6 using electronic structure theory combined with MESMER;29 these are listed in the ESI.† The model predictions of the total gas density, kinetic temperature, and major constituent concentrations are shown in Fig. 1.
Results and discussion
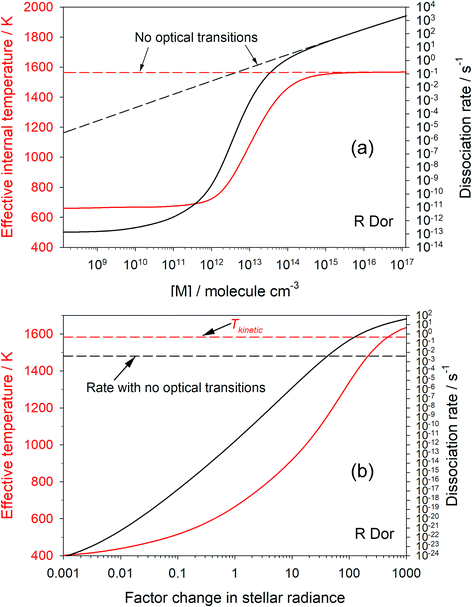
Fig. 3(a) shows how the first-order dissociation rate dissociation rate of OSi(OH)2 varies as a function of [M], for the conditions of the star R Dor at r = 2R*, where the kinetic temperature is 1583 K. Also shown is the effective internal temperature of the molecule, determined from the relative population of the grains in the molecular well. The solid lines show the case when optical transitions are turned on. As [M] approaches 1014 cm−3, both the dissociation rate and internal temperature increase to their respective thermal-only values (shown by the dashed lines which are the model run with optical transitions turned off). This is because the rate of collisional energy transfer now dominates over optical transitions. In contrast, when [M] is less than 109 cm−3 the internal temperature and dissociation rate become independent of [M], because energy transfer between grains is now controlled by optical transitions rather than collisions. Note that the internal temperature is now only 660 K.Fig. 3(b) shows how the internal temperature of OSi(OH)2 and its first-order dissociation rate vary as a function of stellar intensity ([M] is fixed at 1.2 × 1011 cm−3). As the star gets brighter, the internal temperature and dissociation rate increase. The dissociation rate exceeds that with optical transitions turned off when the intensity is increased by a factor of 42, and the internal temperature exceeds the translational temperature when the radiance is increased by a factor of 520. In contrast, if the star gets very dim (radiance factor < 10−3), the dissociation rate and temperature become constant because spontaneous emission keeps the molecule cool, but collisional excitation is still occurring.
Fig. 4 shows the second-order rate coefficient for the recombination of SiO2 and H2O (reaction (1)), as a function of [M]. The dashed line is the case for optical transitions turned off, where the reaction exhibits the expected fall-off behaviour as [M] increases. However, when optical transitions are included (solid line), the rate coefficient levels off at low [M] (<109 cm−3) to a constant value, which is the radiative recombination rate. Once [M] > 1014, the effect of optical transitions is minimal and collisional stabilization dominates. At this point the ratio of the recombination rate to the dissociation rate equals the thermal equilibrium constant of reaction (1), consistent with the internal temperature approaching the kinetic temperature (Fig. 3(a)).
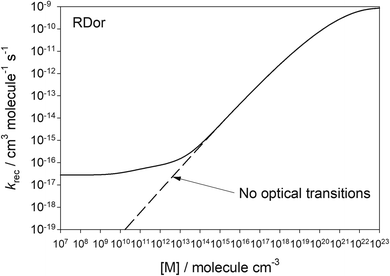 | ||
| Fig. 4 Second-order recombination rate coefficient for reaction (1) as a function of [M]. The stellar radiance is for R Dor at 2R*. | ||
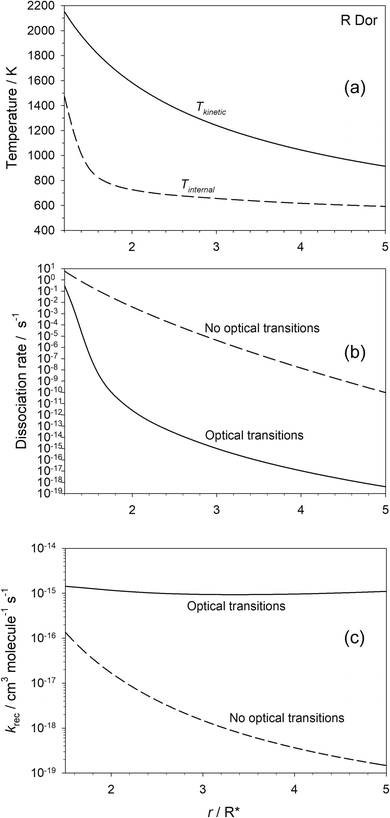
Fig. 5(a) shows the predicted variation of the internal temperature and kinetic temperature of OSi(OH)2 as a function of r for the star R Dor. At 2R*, these temperatures are 725 and 1583 K, respectively, illustrating significant disequilibrium of the molecule that is comparable to that observed recently for HCN,17 as discussed in the Introduction. Fig. 5(b) shows that when optical transitions are included, the dissociation rate of OSi(OH)2 becomes orders of magnitude lower because of the much colder internal temperature of the molecule. It is only close to the star that the H2 density is high enough for collisional energy transfer to warm the molecule to the point where the dissociation rate approaches that when optical transitions are turned off in the model.
The effect on the second-order recombination rate of SiO2 and H2O is illustrated in Fig. 5(c). Moving away from the star, the decrease in [H2] by 4 orders of magnitude between 1.5 and 5R* is only partially offset by the decrease in temperature, so that krec decreases by ∼3 orders of magnitude. In contrast, when optical transitions are turned on, there is very little change in the recombination rate with r, because radiative recombination quickly becomes the dominant process, particularly as the stellar radiance is decreasing as r2 so that spontaneous emission becomes more important than absorption.
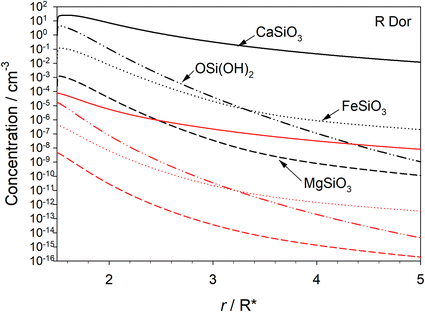
The rate coefficients plotted in Fig. 5(b) and (c) were parameterised as a function of r (see Table S2 in the ESI†) and then input into the stellar outflow model (Methods). Fig. 6 illustrates the predicted concentrations of the three metal silicates – CaSiO3, FeSiO3 and MgSiO3 – as well as OSi(OH)2 as a function of r. The black and red lines show the model run with and without optical transitions, respectively. When optical transitions are included for reactions (1) and (−1), the OSi(OH)2 concentration is on average 9.0 × 10⁵ times higher between r = 1.5 and 5R*. This accounts for the metal silicate concentrations being around 106 times larger when the OSi(OH)2 optical transitions are turned on. Note that CaSiO3 is predicted to be the dominant silicate that forms in the outflow: on average it is 3 × 10⁴ higher in concentration than FeSiO3, and 3 × 10⁷ higher than MgSiO3, in this part of the outflow. The reason is that reaction (2) does not have an energy barrier, whereas the analogous reactions of Fe and Mg with OSi(OH)2 have barriers of 31 and 51 kJ mol−1, respectively (see the ESI†).6 Fe, Mg, SiO and H2O probably then add to CaSiO3, producing mixed metal pyroxenes and olivines. This chemistry will be the subject of future work.
Conclusions
This study is a first step in incorporating optical transitions into a master equation treatment of recombination and dissociation reactions, motivated by the observation of significant molecular vibrational disequilibrium in stellar outflows. For this exploratory work we have made various assumptions and approximations, the most important being that the vibrational modes are treated as harmonic oscillators with Einstein coefficients that remain constant in each of the vibrational manifolds. Nevertheless, this model is able to reproduce the magnitude of vibrational disequilibrium that has been observed in small molecules.17,18 If a molecule is vibrationally cool then its dissociation rate will be reduced compared to the dissociation rate if the molecule were vibrationally equilibrated with the high kinetic temperatures in this environment. In addition, radiative recombination becomes more important than collisional energy transfer at these low pressures, so that the recombination rates are greatly enhanced over what would be expected by extrapolating from the higher pressures where these reactions tend to be studied in the laboratory.An important astronomical result is the substantial increase in the concentration of metal silicates that are predicted to form via this mechanism involving OSi(OH)2 when optical transitions are included. The modelled silicate mixing ratio with respect to H2 is 6 × 10⁻¹¹, which would produce a relatively small amount of dust.6 However, R Dor has a relatively low mass loss rate of only 2 × 10⁻⁷ M⊙ per year (where M⊙ = solar mass), whereas mass loss rates range from 2 × 10⁻⁸ to 4 × 10⁻⁵ M⊙ per year for M-type AGB stars.34 Because the rates of silicate-forming reactions like reaction (2) depend on the square of the concentrations of the relevant species (metals and SiO) in the outflow,6 for a high mass loss rate star of 1 × 10⁻⁵ M⊙ per year the predicted silicate mixing ratio would be ∼2500 times larger.
Author contributions
JMCP: conceptualisation, funding acquisition, formal analysis, software, writing. SHR: formal analysis, software, writing.Conflicts of interest
There are no conflicts to declare.Acknowledgements
This work was supported by the UK Science Technology and Facilities Council (grant ST/T000287/1).Notes and references
- H. P. Gail, S. V. Zhukovska, P. Hoppe and M. Trieloff, Astrophys. J., 2009, 698, 1136–1154 CrossRef CAS.
- H. P. Gail and E. Sedlmayr, Astron. Astrophys., 1999, 347, 594–616 CAS.
- L. Waters, F. J. Molster, T. deJong, D. A. Beintema, C. Waelkens, A. C. A. Boogert, D. R. Boxhoorn, T. deGraauw, S. Drapatz, H. Feuchtgruber, R. Genzel, F. P. Helmich, A. M. Heras, R. Huygen, H. Izumiura, K. Justtanont, D. J. M. Kester, D. Kunze, F. Lahuis, H. Lamers, K. J. Leech, C. Loup, D. Lutz, P. W. Morris, S. D. Price, P. R. Roelfsema, A. Salama, S. G. Schaeidt, A. Tielens, N. R. Trams, E. A. Valentijn, B. Vandenbussche, M. E. vandenAncker, E. F. vanDishoeck, H. vanWinckel, P. R. Wesselius and E. T. Young, Astron. Astrophys., 1996, 315, L361–L364 CAS.
- T. P. M. Goumans and S. T. Bromley, Mon. Not. R. Astron. Soc., 2012, 420, 3344–3349 CAS.
- D. Gobrecht, I. Cherchneff, A. Sarangi, J. M. C. Plane and S. T. Bromley, Astron. Astrophys., 2016, 585, A6 CrossRef.
- J. M. C. Plane, Philos. Trans. R. Soc., A, 2013, 371, 20120335 CrossRef PubMed.
- H. P. Gail and E. Sedlmayr, Faraday Discuss., 1998, 109, 303–319 RSC.
- H. P. Gail and E. Sedlmayr, in The Molecular Astrophysics of Stars and Galaxies, ed. T. W. Hartquist and D. A. Williams, Clarendon Press, Oxford, 1998, pp. 285–312 Search PubMed.
- H. P. Gail and E. Sedlmayr, Astron. Astrophys., 1999, 347, 594–616 CAS.
- T. P. Mangan, K. M. Douglas, R. E. Lade, D. Gobrecht, L. Decin and J. M. C. Plane, ACS Earth Space Chem., 2021, 5, 3385–3395 CrossRef CAS.
- D. Gobrecht, J. M. C. Plane, S. T. Bromley, L. Decin, S. Cristallo and S. Sekaran, Astron. Astrophys., 2022, 658, A167 CrossRef CAS.
- H. Olofsson, D. González Delgado, F. Kerschbaum and F. L. Schöier, Astron. Astrophys., 2002, 391, 1053–1067 CrossRef.
- L. Decin, T. Danilovich, D. Gobrecht, J. M. C. Plane, A. M. S. Richards, C. A. Gottlieb and K. L. K. Lee, Astrophys. J., 2018, 855, 113 CrossRef.
- K. S. Jeong, J. M. Winters, T. Le Bertre and E. Sedlmayr, Astron. Astrophys., 2003, 407, 191–206 CrossRef CAS.
- J. A. Nuth and B. Donn, Astrophys. J., 1981, 247, 925–935 CrossRef CAS.
- J. A. Nuth, M. Wiant and J. E. Allen, Astrophys. J., 1985, 293, 463–469 CrossRef CAS.
- J. P. Fonfría, E. J. Montiel, J. Cernicharo, C. N. DeWitt, M. J. Richter, J. H. Lacy, T. K. Greathouse, M. Santander-Garcia, M. Agundez and S. Massalkhi, Astron. Astrophys., 2021, 651, A8 CrossRef.
- J. P. Fonfría, J. Cernicharo, M. J. Richter and J. H. Lacy, Astrophys. J., 2008, 673, 445–469 CrossRef.
- J. P. Fonfría, K. H. Hinkle, J. Cernicharo, M. J. Richter, M. Agundez and L. Wallace, Astrophys. J., 2017, 835, 196 CrossRef PubMed.
- M. J. Frisch, G. W. Trucks, H. B. Schlegel, G. E. Scuseria, M. A. Robb, J. R. Cheeseman, G. Scalmani, V. Barone, G. A. Petersson, H. Nakatsuji, X. Li, M. Caricato, A. V. Marenich, J. Bloino, B. G. Janesko, R. Gomperts, B. Mennucci, H. P. Hratchian, J. V. Ortiz, A. F. Izmaylov, J. L. Sonnenberg, D. Williams-Young, F. Ding, F. Lipparini, F. Egidi, J. Goings, B. Peng, A. Petrone, T. Henderson, D. Ranasinghe, V. G. Zakrzewski, N. R. J. Gao, G. Zheng, W. Liang, M. Hada, M. Ehara, K. Toyota, R. Fukuda, J. Hasegawa, M. Ishida, T. Nakajima, Y. Honda, O. Kitao, H. Nakai, T. Vreven, K. Throssell, J. J. A. Montgomery, J. E. Peralta, F. Ogliaro, M. J. Bearpark, J. J. Heyd, E. N. Brothers, K. N. Kudin, V. N. Staroverov, T. A. Keith, R. Kobayashi, J. Normand, K. Raghavachari, A. P. Rendell, J. C. Burant, S. S. Iyengar, J. Tomasi, M. Cossi, J. M. Millam, M. Klene, C. Adamo, R. Cammi, J. W. Ochterski, R. L. Martin, K. Morokuma, O. Farkas, J. B. Foresman and D. J. Fox, Gaussian 16, Revision B.01, Gaussian, Inc., Wallingford, CT, USA, 2016 Search PubMed.
- J. A. Montgomery Jr, M. J. Frisch, J. W. Ochterski and G. A. Petersson, J. Chem. Phys., 1999, 110, 2822–2827 CrossRef.
- J. C. Gómez Martín, M. A. Blitz and J. M. C. Plane, Phys. Chem. Chem. Phys., 2009, 11, 10945–10954 RSC.
- F. A. Lindemann, S. Arrhenius, I. Langmuir, N. R. Dhar, J. Perrin and W. C. M. Lewis, Trans. Faraday Soc., 1922, 17, 598–606 RSC.
- M. C. King and K. J. Laidler, Arch. Hist. Exact Sci., 1984, 30, 45–86 CrossRef.
- H. Okabe, Photochemistry of Small Molecules, John Wiley & Sons, New York, 1978 Search PubMed.
- B. Gustafsson, B. Edvardsson, K. Eriksson, U. G. Jørgensen, Å. Nordlund and B. Plez, Astron. Astrophys., 2008, 486, 951–970 CrossRef CAS.
- L. Decin, A. M. S. Richards, L. B. F. M. Waters, T. Danilovich, D. Gobrecht, T. Khouri, W. Homan, J. M. Bakker, M. Van de Sande, J. A. Nuth and E. De Beck, Astron. Astrophys., 2017, 608, A55 CrossRef.
- J. S. A. Brooke, P. F. Bernath, C. M. Western, C. Sneden, M. Afsar, G. Li and I. E. Gordon, J. Quant. Spectrosc. Radiat. Transfer, 2016, 168, 142–157 CrossRef CAS.
- D. R. Glowacki, C.-H. Liang, C. Morley, M. J. Pilling and S. H. Robertson, J. Phys. Chem. A, 2012, 116, 9545–9560 CrossRef CAS PubMed.
- Y. Georgievskii and S. J. Klippenstein, J. Chem. Phys., 2005, 122, 194103 CrossRef PubMed.
- R. G. Gilbert and S. C. Smith, Theory of Unimolecular and Recombination Reactions, Blackwell, Oxford, 1990 Search PubMed.
- K. A. Holbrook, M. J. Pilling and S. H. Robertson, Unimolecular Reactions, John Wiley & Sons, New York, 1996 Search PubMed.
- J. A. Manion, R. E. Huie, R. D. Levin, D. R. Burgess Jr, V. L. Orkin, W. Tsang, W. S. McGivern, J. W. Hudgens, V. D. Knyazev, D. B. Atkinson, E. Chai, A. M. Tereza, C.-Y. Lin, T. C. Allison, W. G. Mallard, F. Westley, J. T. Herron, R. F. Hampson and D. H. Frizzell, NIST Chemical Kinetics Database, NIST Standard Reference Database 17, Version 7.0 (Web Version), National Institute of Standards and Technology, Gaithersburg, Maryland, 2021 Search PubMed.
- S. Höfner and H. Olofsson, Astron. Astrophys. Rev., 2018, 26, 1 CrossRef.
Footnotes |
| † Electronic supplementary information (ESI) available. See DOI: 10.1039/d2fd00025c |
| ‡ Potential energy surface for SiO2 + H2O, molecular parameters used in the master equation and rate coefficients in the stellar outflow model are provided in DOI: 10.5281/zenodo.5925205 |
| This journal is © The Royal Society of Chemistry 2022 |

