 Open Access Article
Creative Commons Attribution 3.0 Unported Licence
Tuning HIV drug release from a nanogel-based in situ forming implant by changing nanogel size†
Adam R.
Town
a,
Jessica
Taylor
a,
Karl
Dawson
b,
Edyta
Niezabitowska
a,
Nancy M.
Elbaz
a,
Andrew
Corker
b,
Esther
Garcia-Tuñón
 b and
Tom O.
McDonald
 *a
*a
aDepartment of Chemistry, University of Liverpool, Crown Street, Liverpool, L69 7ZD, UK. E-mail: Thomas.Mcdonald@liverpool.ac.uk
bSchool of Engineering, Brownlow Hill, University of Liverpool, Liverpool, L69 3GH, UK
First published on 20th December 2018
Abstract
HIV is a global public health threat and requires life-long, daily oral dosing to effectively treat. This pill burden often results in poor adherence to the medications. An injectable in situ forming implant with tuneable drug release kinetics would allow patients to replace some of their daily pills with a single infrequent injection. In this work, we investigate how the size of poly(N-isopropylacrylamide) (polyNIPAm) nanogels influences the long-acting release behaviour of the HIV drug lopinavir from an in situ forming implant. Four sizes of polyNIPAm nanogels were prepared with mean diameters of 65, 160, 310 and 450 nm as characterised by dynamic light scattering. These nanogels all displayed synergistic dual stimuli responsive behaviour by aggregating only upon heating above 31 °C at physiological ionic strength. Mixing the nanogels with solid drug nanoparticles (SDNs) of lopinavir and exposing this concentrated dispersion to physiological temperature and ionic strength resulted in the in situ formation of nanocomposite implants. Three different loadings of the SDNs (33, 50 and 66% w/w) with each of the nanogels were prepared. The drug release behaviour and stability of these nanocomposite implants were then assessed in vitro over 360 hours. All samples displayed a single phase of drug release and application of the Ritger–Peppas equation indicated Fickian diffusion. Nanocomposites with the lowest loading of SDNs (33%) showed a linear relationship between nanogel diameter and the dissolution constant. These results show an attractive method for tuning the release of lopinavir from in situ loading implants with high drug loadings.
Introduction
HIV is a communicable disease that is a global threat to public health with an estimated 37 million people worldwide infected with the virus. In 2016 alone, over 1 million people died of HIV-related illnesses.1 HIV can be effectively treated by antiretroviral therapies that require life-long daily-dosing, however this results in poor adherence with less than 50% of patients fully complying with their treatment regime.2 Generally, poor adherence can be addressed by the simplification of therapeutic regimes through reducing the dosing frequency.3 For example, when self-administered treatment regimens such as oral dosing are replaced with long acting formulations adherence can be greatly improved.4 Indeed, long-acting formulations of HIV drugs are becoming increasingly important in pre-exposure prophylactic treatment of at risk populations.5,6A range of technologies have been developed to provide long acting drug delivery, these include microparticles,7 nanoparticles,8 nanosuspensions,9,10 oils4 and in situ forming implants.11In situ forming implants (ISFIs) consist of an injectable drug formulation that solidifies after injection into the body to form a matrix with an embedded drug. ISFIs are an attractive approach to providing long-acting drug delivery as they are easily administered and can be tuned to provide varying rates of drug release. Additionally, the formation of a solid implant offers the opportunity to remove the implant in the event of adverse effects, an option that it not possible for injectable depot formulations.
ISFIs based on a wide range of different materials have been investigated, for example Kang et al. have shown a degradable implant formed from the thermo gelation of a diblock copolymer consisting of polyethylene glycol block, and a random copolymer block of polycaprolactone (PCL) and poly-L-lactic acid (PLLA). In adapting the ratio of PCL to PLLA, the rate of degradation could be tuned, with in vivo studies showing degradation of the implant to be tuneable in the range of weeks to months.12 Amiram et al. showed that a glucagon-like peptide used in the treatment of diabetes could be fused to a thermally sensitive elastin-like polypeptide which forms an implant at body temperature. This allowed a 120 fold increase in therapeutic effect duration, in which blood glucose level was reduced.13 ISFIs are also useful where localised drug delivery is required.14 Kilicarslan et al. showed that mucoadhesive sodium carboxymethyl cellulose and carbopol polymers could be combined with poly(lactide-co-glycolide) (PLGA) to give an ISFI capable of releasing the drug metronidazole locally to treat periodontal pockets. The implant was degradable and the rate of drug release could also be tuned depending upon the composition of the implant.15 While the simplicity of administration of ISFIs by injection is beneficial, there are issues typically shown for current systems. These include a large burst release of drug,16 potential toxicity of materials,17 cytotoxicity and inflammation response,18 long-term stability of the drugs,19 and finally variation in the shape of the implant formed, which leads to a variation in the amount of drug released.11
We have recently shown promising proof of concept data for a novel ISFI based on a colloidal assembly of two types of nanoparticles that avoids many of these issues. In this system, poly(N-isopropyl acrylamide) (polyNIPAm) nanogels responded to the stimuli present upon injection into the body to form a solid implant.20 The reservoir of drug was provided by solid drug nanoparticles (SDNs)10,21–25 which are nanoparticles composed entirely of solid drug, stabilised by amphiphilic molecules and therefore have very high drug-loadings compared to other nanomedicines. This ISFI system exploited a synergistic dual-stimuli responsive behaviour of the nanogels which require the simultaneous stimuli of body temperature and physiological ionic strength to cause aggregation of the nanogel particles causing the formation of a solid implant. PolyNIPAm nanogels have well established thermoresponsive behaviour where the particles deswell when heated above their volume phase transition temperature (VPTT).26 Additionally, polyNIPAm nanogels can also demonstrate synergistic dual-stimuli responsive behaviour where the combination of two stimuli such as temperature with either pH27,28 or ionic strength20 results in the nanogels losing colloidal stability and aggregating into a gel matrix material. The rate of release of drug molecules from the implant was thus controlled by dissolution of the drug from the SDNs through the gel matrix. It is known that when drug release occurs in a hydrophobic polymer matrix, particularly for drug loaded at a concentration above its solubility limit, release of the drug occurs via diffusion through interconnected water-filled pores.29–31 We found that the drug release behaviour was influenced by the composition of the nanogels and structure of the aggregates. The biocompatibility of polyNIPAm is well established32–34 and we showed good cytocompatibility for the nanogel aggregates.20 We hypothesise that the size of the nanogel used in this ISFI would have an impact on the ISFI behaviour, in terms of drug payload entrapment and drug release rate.
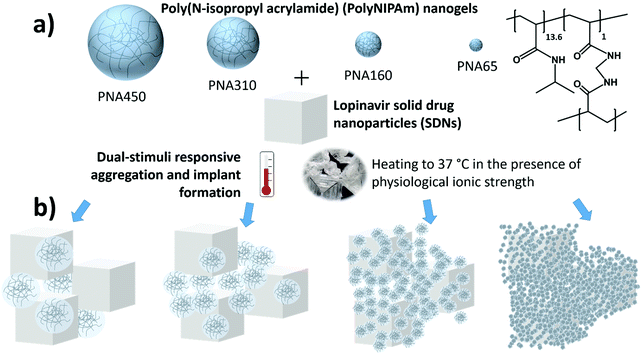
In this work, we investigate the effect of nanogel size and drug loading on the drug release of the HIV drug lopinavir from synergistic dual stimuli-responsive in situ forming implants. Four polyNIPAm nanogels samples with mean diameters from 65–450 nm were synthesised and studied to demonstrate how size modifies the drug release behaviour (Fig. 1). Nanogels of different sizes would likely create aggregates of different pore size and pore interconnectivity, and hence change the diffusion rate of drug through the matrix. In terms of pore size, the pores created between the packing of larger nanogels (and openings between these pores) are naturally likely to be larger and so allow greater permeability than those between smaller nanogel particles.35 In terms of pore interconnectivity, polyNIPAm nanogels act as soft spheres,36 which as a concentrated dispersion undergo compression, deformation, and possibly interpenetrate.37–39 Hence it is important to understand the role of nanogel size and structure on release.
Experimental
Materials
N-Isopropylacrylamide (NIPAm, ≥99%), N,N-methylenebis(acrylamide) (BIS, 99%), potassium persulfate (KPS, ≥99%), sodium chloride (NaCl, ≥99.5%), sodium phosphate dibasic dihydrate (Na2HPO4, ≥99%) potassium phosphate monobasic (KH2PO4, ≥99%), orthophosphoric acid solution 50% (H3PO4, HPLC grade), anhydrous sodium hydroxide pellets (NaOH, analysis grade), sodium dodecyl sulphate (SDS, ≥99%) were purchased from Sigma-Aldrich Company Ltd, Gillingham (Dorset) UK, a subsidiary of Merck KGaA, Darmstadt, Germany. Lopinavir (ABT-378) (LPV) was purchased from WuXi PharmaTech, Shanghai, China. Kolliphor TPGS was purchased from BASF, Ludwigshafen, Germany. Phosphate buffered saline (PBS) tablets (Bioreagent), acetonitrile (MeCN, HPLC grade), hydrochloric acid 37% (HCl, analytical grade), were purchased from Fischer Scientific UK, Loughborough, UK, a part of Thermo Fisher Scientific. Type I distilled water obtained from a water purification system with a resistivity of >18 MΩ cm−1 (PURELAB option R, Veolia). Spectra/por 2 (MWCO = 12–14 kDa) and spectra/por 3 (MWCO = 3.5 kDa) dialysis tubing was purchased from Spectrum Europe B.V., Breda, The Netherlands. Chromafil Xtra PET 0.45 μm syringe filters were purchased from Hicrom Ltd, Theale, UK.Synthesis of polyNIPAM nanogels
The polyNIPAm nanogels were synthesised by dispersion polymerisation. The composition used in the synthesis of each nanogel can be found in Table 1. The NIPAm monomer (7000 mg, 61.9 mmol), BIS crosslinker (700 mg, 4.5 mmol) and SDS surfactant (PNA450 = 30.0 mg, PNA310 = 78.8 mg, PNA160 = 260.2 mg, PN60 = 939.1 mg) were dissolved in distilled water (470 mL) in a 1 L two-neck round bottom flask equipped with a stir bar and reflux condenser. This was then sealed and nitrogen was bubbled through the aqueous solution for 1 hour whilst stirring (400 rpm) to remove dissolved oxygen. The solution was then heated to 70 °C. Separately KPS initiator (280 mg) was dissolved in distilled water (30 mL) and degassed with N2 for 1 hour before being transferred to the flask containing the monomers. The reaction was maintained under a N2 atmosphere for 4 hours at 70 °C before being cooled down to room temperature. The solution was then filtered through glass wool. To remove unreacted impurities, the nanogel suspension was dialyzed for 5 days using regenerated cellulose dialysis tubing (12–14 kDa MWCO for PNA450, PNA310 and PNA160 and 3.5 kDa MWCO for PNA65), (Spectrum Labs), replacing the distilled water every 12 hours. The purified suspension was then lyophilized (Virtis Benchtop K with ultra-low temperature condenser) and stored in a desiccator.| Sample | NIPAm (mg) | [SDS] (mg mL−1) | BIS (mg) | KPSa (mg) | Waterb (mL) |
|---|---|---|---|---|---|
| a KPS dissolved at 9.3 mg mL−1 in distilled water. b Total volume of water, including addition of KPS dissolved in water. | |||||
| PNA65 | 7000 | 1.88 | 700 | 280 | 500 |
| PNA160 | 7000 | 0.52 | 700 | 280 | 500 |
| PNA310 | 7000 | 0.16 | 700 | 280 | 500 |
| PNA450 | 7000 | 0.06 | 700 | 280 | 500 |
Characterisation of polyNIPAm nanogels
Characterisation of the nanogels was carried out using dynamic light scattering (DLS) and laser Doppler electrophoresis (LDE). DLS and LDE was performed using a Malvern Zetasizer Nano ZS (running Malvern Zetasizer software V7.12) with 633 nm He–Ne laser and the detector positioned at 173°. Dialysed samples were diluted to 1 mg mL−1. The Z-average diameter was recorded in the range (15–55 °C) using a thermal equilibration time of 600 seconds in 1 cm path length disposable polystyrene cuvettes. Measurements were repeated in triplicate to give a mean Z-average diameter and polydispersity index (PdI). Zeta Potential measurements were performed using DTS1070 folded capillary cells (Malvern, UK). The pH of the sample was measured before performing zeta potential measurements, and for all samples fell in the range pH 7 ± 0.5. Capillary cells were flushed with ethanol and water prior to usage. The zeta potential measurement was made with a minimum of 10 and maximum of 40 runs, with a voltage of 150 V. The Smoluchowski approximation was used to calculate zeta potential. Due to the tendency of the nanogels to aggregate with increasing ionic strength solution when above 32 °C, the measurements were conducted in the highest stable concentration of 0.001 M NaCl. This is despite the ISO 13099-2:2012 and ASTM E2865-12 standard recommendation of 0.01 M NaCl to avoid potentially inducing electrode polarisation, which causes voltage irregularities if solution conductivity is too low. Hence the zeta values give a relative qualitative comparison of zeta potential trends between the samples measured under the same conditions, rather than a quantitative value.The structure of the nanogel aggregates and nanogel/SDN implants was analysed by scanning electron microscopy (SEM). Firstly nanogel aggregates were prepared using the following method, a mass of 12 wt% (68.2 mg) of each lyophilised nanogel was dispersed to form a swollen self-supporting gel in 0.5 mL of PBS (pH 7.4, 0.137 M NaCl and 0.0027 M KCl) in a glass vial of internal diameter 14 mm. These were then heated to 37 °C for 1 hour to form shrunken cylinders with excess PBS expelled from the cylinders in the heating process, the samples were then left at 37 °C without a lid for 3 days to allow all the water to evaporate. The dried cylinders were then broken into smaller pieces and placed on adhesive carbon tabs, which were secured to aluminium stubs. Each specimen received a thin (ca. 20 nm) Au coating, using a Quorum Technologies Q150T sputter coater, to help alleviate the effects of sample charging. Back scattered electron images were recorded using the electron column of a FEI, dual beam, Helios NanoLab 600i, focussed ion beam (FIB) microscope. Images were formed using a retractable concentric back scattered electron detector, with beam conditions of 5 kV acceleration voltage and a 1.4 nA beam current. Image J was used for measurements from the SEM images. The values for the mean diameters of nanogels or SDNs was taken from at least 20 measurements of individual particles. The mean porosity of the aggregates was taken from at least 50 pores.
The mechanical properties of the nanogel aggregates and nanogel/SDN nanocomposites were then assessed by rheology. Oscillatory rheology measurements were carried out on a TA Ares G2 rheometer using a 25 mm polyphenylene sulphide (PPS) parallel plate. The amplitude sweeps were conducted at 37 °C in PBS at a frequency of 0.5 Hz and strain of 0.1–50.0%. The mechanical properties of the nanogels aggregates was compared by using three key parameters; the yield stress σy (the oscillation stress at limit of the linear viscoelastic region), the flow stress σf (the oscillation stress at G′ = G′′) and the at rest G′ (the elastic modulus in the static linear viscoelastic region region).
Synthesis of lopinavir (LPV) solid drug nanoparticles (SDNs)
The LPV SDNs were prepared by emulsion-spray-drying as described by Giardiello et al.22 Briefly, a stock solution of LPV (200 mg mL−1 in dichloromethane (DCM)), polyvinyl alcohol (PVA grade 4–88, MW 57–77![[thin space (1/6-em)]](https://www.rsc.org/images/entities/char_2009.gif) 000) (50 mg mL−1 in water), Kolliphor TPGS (50 mg mL−1 in water) were prepared. Three stock solutions were mixed in the LPV
000) (50 mg mL−1 in water), Kolliphor TPGS (50 mg mL−1 in water) were prepared. Three stock solutions were mixed in the LPV![[thin space (1/6-em)]](https://www.rsc.org/images/entities/char_2009.gif) :
:![[thin space (1/6-em)]](https://www.rsc.org/images/entities/char_2009.gif) PVA
PVA![[thin space (1/6-em)]](https://www.rsc.org/images/entities/char_2009.gif) :
:![[thin space (1/6-em)]](https://www.rsc.org/images/entities/char_2009.gif) Kolliphor TPGS ratio of 60
Kolliphor TPGS ratio of 60![[thin space (1/6-em)]](https://www.rsc.org/images/entities/char_2009.gif) :
:![[thin space (1/6-em)]](https://www.rsc.org/images/entities/char_2009.gif) 192
192![[thin space (1/6-em)]](https://www.rsc.org/images/entities/char_2009.gif) :
:![[thin space (1/6-em)]](https://www.rsc.org/images/entities/char_2009.gif) 48 (mL) in a 1
48 (mL) in a 1![[thin space (1/6-em)]](https://www.rsc.org/images/entities/char_2009.gif) :
:![[thin space (1/6-em)]](https://www.rsc.org/images/entities/char_2009.gif) 4 DCM to water mixture. Emulsification was conducted using a Hielscher UP400S ultrasonic processor equipped with a H14 Probe at 100% output (140 W) for 180 seconds, with immediate spray-drying using a benchtop spray-dryer (BUCHI Mini-290) with an air-atomizing nozzle and compressed air as the drying gas. Spray-drying process conditions: 7 mL min−1 solution flow rate; 65 °C outlet temperature; 110 °C inlet temperature. Resultant powders were further dried under vacuum for 48 hours to remove residual DCM. SDN dispersions result from subsequent powder dispersion in water; for DLS characterisation, powders were dispersed in distilled water at 2 mg mL−1 (1 mg mL−1cf. LPV). The LPV SDNs had a Z-average diameter of 330 nm and PdI of 0.18.
4 DCM to water mixture. Emulsification was conducted using a Hielscher UP400S ultrasonic processor equipped with a H14 Probe at 100% output (140 W) for 180 seconds, with immediate spray-drying using a benchtop spray-dryer (BUCHI Mini-290) with an air-atomizing nozzle and compressed air as the drying gas. Spray-drying process conditions: 7 mL min−1 solution flow rate; 65 °C outlet temperature; 110 °C inlet temperature. Resultant powders were further dried under vacuum for 48 hours to remove residual DCM. SDN dispersions result from subsequent powder dispersion in water; for DLS characterisation, powders were dispersed in distilled water at 2 mg mL−1 (1 mg mL−1cf. LPV). The LPV SDNs had a Z-average diameter of 330 nm and PdI of 0.18.
In vitro release study
The in vitro drug release was performed using adaptations of the sample and separate method,40 as performed in previous work.41 A mass of 12 wt% (68.2 mg) of each lyophilised nanogel was dispersed to form a swollen self-supporting gel in 0.5 mL of PBS (pH 7.4, 0.137 M NaCl and 0.0027 M KCl) in a glass vial of internal diameter 14 mm. To this 33, 50 or 66 wt% (34.1, 68.2 or 136.4 mg) of LPV SDNs (50% (w/w) loading of LPV) were vortexed. These were then heated to 37 °C for 1 hour to form shrunken cylinders with excess PBS expelled from the cylinders in the heating process, this was removed and used as the first release time point. These cylinders were transferred to 150 μm mesh bags suspended in the release media in 250 mL glass sample jars with 200 mL of fresh PBS. Subsequent release samples were taken at pre-determined intervals by removing 200 mL from the vessel and replacing with 200 mL of fresh PBS at 37 °C to prevent a saturation limit with a large excess of solvent. Release vessels were kept at 37 °C ± 0.5 °C in a water bath. The amount of LPV released was quantified by HPLC analysis. For each of the different nanogel samples (PNA65, 160, 310 and 450) one sample was prepared at each SDN loading (33, 50 or 66 wt%) and used for the in vitro release study. This gave a total of 12 nanocomposite in vitro release samples and there was also one control that was the SDNs alone. A similar setup was used for the saturation study with PNA-450-66-S (Table 3). However only 1 mL of release media was removed from 200 mL of PBS at each sampling interval.HPLC procedure
The HPLC method was adapted from the method published by Giovanni Di Perri et al.42 Briefly, HPLC grade acetonitrile (MeCN) (1.8 mL) was added to each release sample (4.2 mL) to create 30% (v/v) MeCN samples, followed by filtering through a 0.45 μm PTFE syringe filter. 40 μL of the solution was injected into a HPLC-PDA system (PerkinElmer Series 200). The mobile phase was composed of solvent A (KH2PO4 50 mM dissolved in HPLC grade water then pH adjusted with H3PO4 to reach pH 3.23) and solvent B (MeCN) with the gradient reported in Table 2. Chromatographic separation was performed with an Agilent ZORBAX Eclipse Plus 3.5 μm C18 column (100 × 4.6 mm ID, Santa Clara, CA) maintained at 25 °C in a column oven with a solvent flow rate of 0.5 mL min−1 giving a retention time of LPV of 9.6 ± 0.2 min. The PDA detector was set to 210 nm with a bandwidth of 2 nm. The concentration of LPV in the samples was calculated against known standards using the area under the chromatogram peaks. Three standards covering the concentration range of the HPLC method were used to verify the results, and samples were analysed in duplicate.| Time (min) | Solvent A % (v/v) | Solvent B % (v/v) | Flow (mL min−1) |
|---|---|---|---|
| 0.0 | 70 | 30 | 0.5 |
| 1.0 | 70 | 30 | 0.5 |
| 3.0 | 30 | 70 | 0.5 |
| 11.5 | 30 | 70 | 0.5 |
| 12.0 | 70 | 30 | 0.5 |
| 12.5 | 70 | 30 | 0.5 |
Results and discussion
Synthesis and characterisation of polyNIPAm nanogels
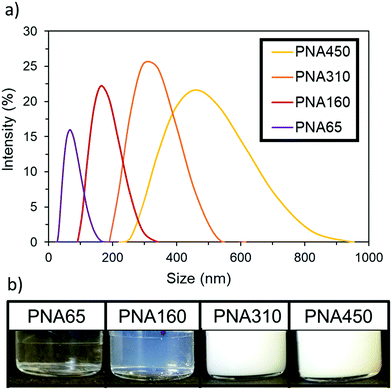
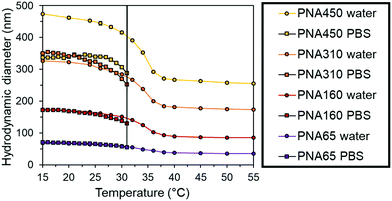
PolyNIPAm nanogels of four different sizes were synthesised by using different amounts of the surfactant sodium dodecyl sulphate (SDS) in a dispersion polymerisation, following the relationship previously reported by Pelton et al.43 Increasing the concentration of SDS reduced the mean particle diameter and the relationship between nanogel size and SDS concentration used can be seen in Fig. S1, ESI.† The resulting four polyNIPAm samples are denoted PNA65, PNA160, PNA310 and PNA450, corresponding to their hydrodynamic diameter as determined by dynamic light scattering (DLS) in water at 25 °C. All four nanogel samples produced well-defined narrow size distributions; the hydrodynamic diameter and polydispersity index (as determined by DLS) of each nanogel was: PNA65, 65 nm, 0.13; PNA160, 160 nm, 0.02; PNA310, 310 nm, 0.01; PNA450, 450 nm, 0.03. The size distribution of the samples as determined by DLS can be seen in Fig. 1a with monomodal distributions apparent for all samples and the clear relationship between particle size and scattering intensity can be seen in Fig. 1b. Tyndall scattering was observed for PNA160, (Fig. S2, ESI†), while samples with a larger diameter were completely turbid.The change in hydrodynamic diameter of these nanogels in response to a rise in temperature when dispersed in water was then measured by DLS (Fig. 2). At the lowest temperature measured (15 °C), the nanogels were at their most swollen, and hence at their maximum hydrodynamic diameter at this temperature. All samples then showed the characteristic thermoresponsive behaviour of polyNIPAm nanogels, with a dramatic decrease in hydrodynamic diameter at the VPTT of 34 °C, where de-swelling occurs at a much greater rate with rise in temperature. This behaviour occurred as the polymer–solvent hydrogen bonding becomes less favourable and the polymer–polymer interactions dominate.44 The samples also all displayed similar swelling/deswelling behaviour, as was quantified by the swelling ratio (the ratio of the nanogel diameter at a given temperature to the diameter at 55 °C), (Fig. S3, ESI†). The particles were colloidally stable over the whole temperature range tested. Below the VPTT the nanogels were sterically stabilised by the solvated polymer chains on the surface of the particles.45 Above the VPTT the nanogels were electrostatically stabilised by the surface charge provided by the sulphate groups at the chain ends that were derived from the persulfate initiator.43 Analysis of the zeta potential of the four samples below and above the VPTT (25 °C and 40 °C respectively) (Fig. S4, ESI†) revealed that all samples had values between −19.6 to −36.9. These findings support the concept that the nanogels were electrostatically stabilised above their VPTT in water.
The nanogels were then dispersed in phosphate buffered saline (PBS) to mimic physiological ionic strength. At temperatures below the VPTT of the particles there was a slight reduction size of the each nanogel in PBS compared to water (Fig. 3). This behaviour was due to the increased ionic strength of the solvent making it a poorer solvent for the nanogels. However, the PNA450 nanogel had a significantly smaller diameter when dispersed in PBS compared to water, with a 24% reduction in diameter at 25 °C, giving it a diameter similar to PNA310 when dispersed in PBS. In water, the sulphate groups derived from the initiator fragment present at the chain ends may provide some swelling due to the electrostatic repulsion within the particles, in the presence of PBS these charges will be screened by the increased concentration of ions and result in less swelling. Vincent and Rasmusson have shown that even a low NaCl concentration led to a reduction in the diameter of larger (700 nm) particles due to electrolyte screening of sulphate initiator fragments on the surface of the nanogel.46 The heterogeneity of the crosslinking within nanogels has been shown to be influenced by the amount of SDS used during the synthesis, with larger nanogels tending to show denser core crosslinking compared to the shell.47,48 The looser shell crosslinking of PNA450 may therefore be more sensitive to screening of the sulphate initiator fragments these charged groups than the smaller nanogel. When the nanogels were progressively heated, the synergistic dual stimuli-responsive behaviour was observed (Fig. 3). The dramatic increase in diameter that occurred for all samples in PBS was due to the nanogels aggregating, with aggregation occurs at 31 °C for all samples, being completely independent of the particle size (as seen by the immediate increase in diameter at 31 °C to a size that could not be accurately measured by DLS). This aggregation was due to the loss of all colloidal stabilisation of the particles. Upon heating above the VPTT (31 °C), the steric stabilisation was likely lost as the solvated surface chains collapse and the ions in the PBS screened the electrostatic repulsion resulting in particle aggregation.49
Formation of nanocomposite aggregates under dual-stimuli conditions
Given the synergistic dual stimuli-responsive aggregation observed by DLS of the dilute dispersions (concentration of 1 mg mL−1), this aggregation behaviour of the nanogels was examined as a concentrated dispersion (13.6% w/v) in order to form an implant that contained a reservoir of drug. This concentration was selected based on our previous work.20 In order to assess the capacity of the nanogels to effectively entrap a drug payload all four nanogels were loaded with varying amounts of lopinavir SDN which were 50% w/w with regards to drug.22 These SDNs had a mean diameter of 330 nm as determined by DLS and as imaged by SEM were seen to be non-spherical with a film coating caused by the residue polymer used as excipients (Fig. S5, ESI†). The mean diameter of the SDNs as measured from the SEM images was 490 nm, this over estimation of the diameter compared to DLS is likely due to the difficulty to measuring the smaller SDNs due to the film formation. Drug loading was tested at a nanogel![[thin space (1/6-em)]](https://www.rsc.org/images/entities/char_2009.gif) :
:![[thin space (1/6-em)]](https://www.rsc.org/images/entities/char_2009.gif) SDN mass ratio of 2
SDN mass ratio of 2![[thin space (1/6-em)]](https://www.rsc.org/images/entities/char_2009.gif) :
:![[thin space (1/6-em)]](https://www.rsc.org/images/entities/char_2009.gif) 1, 1
1, 1![[thin space (1/6-em)]](https://www.rsc.org/images/entities/char_2009.gif) :
:![[thin space (1/6-em)]](https://www.rsc.org/images/entities/char_2009.gif) 1 and 1
1 and 1![[thin space (1/6-em)]](https://www.rsc.org/images/entities/char_2009.gif) :
:![[thin space (1/6-em)]](https://www.rsc.org/images/entities/char_2009.gif) 2, which corresponds to 33, 50 and 66 wt% of loaded SDN mass with regards to the total mass of SDNs and nanogels. The different formulations can be seen in Table 3.
2, which corresponds to 33, 50 and 66 wt% of loaded SDN mass with regards to the total mass of SDNs and nanogels. The different formulations can be seen in Table 3.
| Formulation | LPV SDN (mg) | SDN loadinga wt% | PNA65 (mg) | PNA160 (mg) | PNA310 (mg) | PNA450 (mg) |
|---|---|---|---|---|---|---|
| All samples were dispersed in 0.5 mL of PBS (pH 7.4).a Wt% based on dry nanogel mass, (mass of SDN/(mass of SDN + mass of nanogel) × 100). | ||||||
| Free SDN | 68.2 | 100 | — | — | — | — |
| PNA65-33 | 34.1 | 33 | 68.2 | — | — | — |
| PNA65-50 | 68.2 | 50 | 68.2 | — | — | — |
| PNA65-66 | 136.4 | 66 | 68.2 | — | — | — |
| PNA160-33 | 34.1 | 33 | — | 68.2 | — | — |
| PNA160-50 | 68.2 | 50 | — | 68.2 | — | — |
| PNA160-66 | 136.4 | 66 | — | 68.2 | — | — |
| PNA310-33 | 34.1 | 33 | — | — | 68.2 | — |
| PNA310-50 | 68.2 | 50 | — | — | 68.2 | — |
| PNA310-66 | 136.4 | 66 | — | — | 68.2 | — |
| PNA450-33 | 34.1 | 33 | — | — | — | 68.2 |
| PNA450-50 | 68.2 | 50 | — | — | — | 68.2 |
| PNA450-66 | 136.4 | 66 | — | — | — | 68.2 |
Upon dispersion of the nanogels and SDNs in PBS the samples were heated to 37 °C to simulate body temperature. Shrunken cylinders of the nanogels and SDNs were formed with excess PBS expelled from the cylinders in the heating process. All nanogel samples prepared in Table 3 were formed implants that consisted of the aggregated nanogels with the SDNs. An example of the implant can be seen in Fig. 4, where the aggregate is retained in a mesh bag. The cylinder shape morphology presented was a result of the geometry on the vial in which the implant was formed.
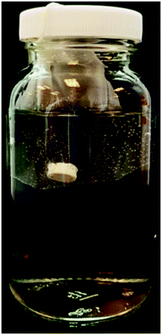 | ||
| Fig. 4 PNA65-50 cylindrical aggregate nanogel implant held inside 150 μm pore size mesh bag suspended in release media. | ||
In vitro drug release from the aggregate implants based on different sizes of nanogels
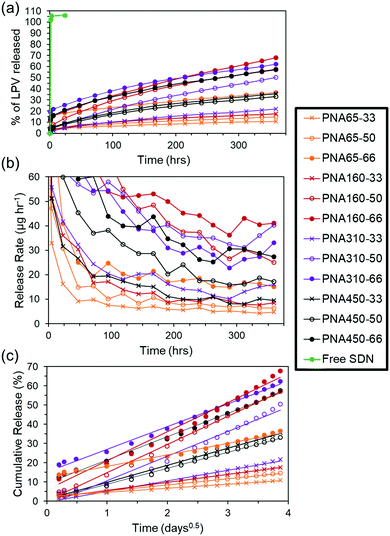
In order to investigate the effect of the nanogel size and drug loading on the payload entrapment efficiency and drug release rate a sample and separate in vitro release experiment was carried out. The release of drug from the aggregate implants into a surrounding PBS solution was quantified using HPLC. The low solubility of LPV (predicted at 0.00192 mg mL−1) meant that saturation of the release media was a potential issue. Therefore, a short release study was undertaken to determine the timeframe over which the saturation limit of the release media was approached (Fig. S6, ESI†). Using this data, a sampling interval of 24 h was selected for a 15 day in vitro study of drug release from aggregate implants, as a compromise between realistic experimental parameters, and avoiding a saturation limit on the rate of drug release. With a greater SDN loading into the aggregates it was expected that aggregate implants would be potentially more mechanically unstable and fracture upon or after formation. For this reason, aggregates were retained in 150 μm mesh bags suspended in the release media to prevent loss of aggregate upon replacement of release media, (see Fig. 4). At the start of the release period in the in vitro release study, sampling was performed after the first 1, 2, and 5 hours to avoid any chance of saturation of the release media occurring in the event of burst release. It can be seen in the LPV SDNs control sample with no nanogel matrix ‘Free SDN’, (Table 3), that 100% release occurred after the first sample point at 1 h, revealing that there was no limitation imposed by the mesh bag on release of the SDNs or drug into the release medium, (Fig. 5a). The aggregate implants composed of different sized nanogels and different loadings of SDNs all showed controlled release after a prolonged period of time. After 360 hours (15 days), the percentage of drug released ranged from a minimum of 14.6% for PNA65-33 to a maximum of 67.8% for PNA160-66. This corresponds to a single order of magnitude difference in release rate of 4.9 and 40.3 μg h−1 respectively, (Fig. 5b).Applying the Ritger–Peppas equation,50 to the release data with the assumption that drug release occurs via Fickian diffusion as observed previously,20 shows that a single phase of release occurs from all aggregate implants, with the equation showing a good linear fit to the data, (Fig. 5c). The associated dissolution constant values (k), and correlation coefficients (Rc) can be found in Table S1, ESI.† This release behaviour suggests that the polyNIPAm nanogels form dense aggregates which completely entrap SDNs after any initial burst release during aggregate formation, so that drug is only released in dissolved form, rather than two release phases being present, where SDNs are released from the aggregate implant, followed by dissolved drug. The suboptimal therapeutic threshold for LPV has been shown to be 3000 ng mL−1,51 and the half-life upon oral dosing as 6 hours (when administered with ritonavir) resulting in 7.5 mg of drug being cleared every 6 hours. Based on the release rates in our in vitro study, it may potentially be possible to provide therapeutic release of LPV using three intramuscular/subcutaneous injections of 5 mL of the nanogel/SDNs ISFI. This 15 mL of the implant would provide <2000 mg of LPV potentially released at a rate of 1.35 mg h−1 (see the ESI† for further details on how this estimation was made). In vivo studies will be conducted in the future to properly investigate the pharmacokinetics of drug release from the implants as the route of administration also impacts on the pharmacokinetic profile.52,53
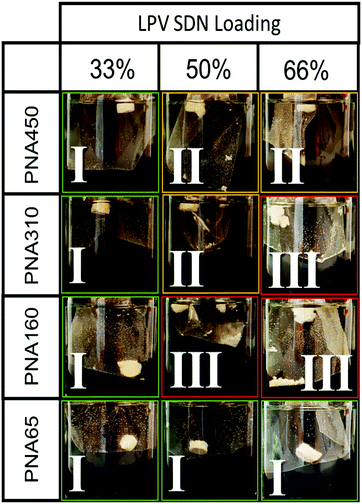
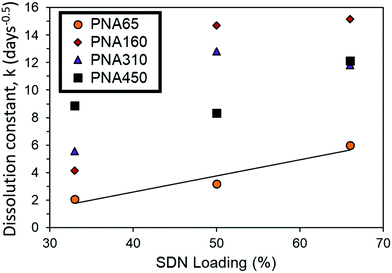
During the release experiment, certain aggregate implants of higher drug loading started to fail mechanically and fracture. This can be seen visually in Fig. 6. This instability was categorised into (I) a stable implant which retains its shape with no fracturing, (II) a low number of fractures occur, where ca. <10% of the implant volume may separate into a small number of fragments, (III) a high number of fractures occur so that the implant separates into many fragments (ca. >10% of the implant volume). The instability of some of the aggregate implants was reflected in the greater than expected release rate of the implant. This can be seen by comparing the dissolution constant (k) of implants which were mechanically stable (I) and those which fractured (III). PNA65 showed excellent stability, with no implant fracturing even at high loading of 66% LPV SDNs. This is reflected in the linear increase in dissolution constant (k) with greater SDN loading % (Fig. 7). The smaller size of the PNA65 nanogels may provide a greater surface area for interaction between the nanogels and the SDNs resulting in a more robust aggregate. Hence, even with a high wt% of payload, the implant appeared to remain mechanically stable with no observed fracturing occurring.
 | ||
| Fig. 7 Comparison of dissolution constant (k) for mechanically stable aggregate implants (PNA65) and implants which fracture during release at increased loading % (PNA160, PNA310, PNA450). | ||
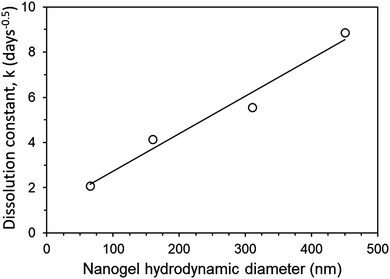
The release rate could be tuned simply by changing the amount of SDN loaded into the implants. Greater SDN loading is likely to introduce greater porosity into the release matrix, increasing the drug dissolution rate due to the increase in permeability of the implant. Theoretically as drug and excipient dissolves from the SDNs contained at the outer boundary of the implant over time, they are likely to be replaced with porous channels, to aid in the release of drug further within the implant. It is acknowledged that further detailed study into the structure of the aggregates is required to confirm this. In the case of PNA160, the implant only remained mechanically stable at 33% loading, with a great amount of fracturing (III) occurring with 50% and 66% loading. Hence a much greater increase in dissolution constant occurs for PNA160 at 50% and 66% loading compared to PNA65, (Fig. 8). Similar behaviour is seen for PNA310 and PNA450, which also became mechanically unstable above 33% loading. The dramatic increase in the diffusion constant can be explained by the fact that as the implant fractures into smaller fragments the drug has a shorter distance to diffuse, and greater surface area to diffuse from. The non-linear increase in dissolution constant for 50% and 66% loading for PNA160, PNA310 and PNA450 can be attributed to an increase in the porosity of the material with greater drug loading combined with a varying and unknown degree of fracturing of the aggregate to enhance release rate. At the lowest loading of SDNs of 33%, all the nanogels samples produced aggregate implants remained mechanically. Within this sample set, where the effect of implant fracture is excluded, it can be seen that the dissolution constant increased in a linear manner with nanogel size (Fig. 8). Hence it is likely that smaller particles contained smaller pores between the deswollen nanogels, lowering the permeability and hence drug diffusion rate.
 | ||
| Fig. 8 Comparison of dissolution constant (k) for mechanically stable (I) implants of different sized nanogels at a fixed SDN loading of 33%. | ||
In order to better understand the structure of the nanogel aggregates investigation by scanning electron microscopy (SEM) was carried out. Samples of the four nanogels with 50% loading of SDNs were aggregated in PBS at 37 °C and then air dried (at 37 °C) and fractured before imaging the internal structure of the aggregates (Fig. 9). Due to the presence of the water soluble polymer excipients used with the SDNs all samples displayed a film covered surface. This film coating was not observed for the nanogel aggregates without SDNs (Fig. S5, ESI†). As for all SEM analysis of dried samples of normally solvated systems, it is important to consider that the dry nature of the samples will not necessarily represent the structures that are present in the hydrated aggregates. Additionally, the film coating on the SDN loaded samples made it difficult to quantify the porosity within the samples. In this context, it was observed that PNA65 (Fig. 9A) displayed a textured film-like surface, likely caused by the small size of the nanogels and the propensity for nanogels to film form at high concentrations. Analysis of PNA160 (Fig. 9B) showed a sample with large defects in between materials from 70–790 nm in diameter. In the sample of PNA310 (Fig. 9C), the dehydrated individual nanogel particles could be clearly seen (mean diameter of 120 nm) this sample showed a fewer defects in the material compared to the PNA160 nanocomposite and the non-spherical individual lopinavir SDNs could be seen in the nanocomposites as indicated by the arrows on the figure. The PNA450 sample displayed a relatively homogenous surface consisting of the dehydrated individual nanogels (mean diameter of 175 nm) and some SDNs within the material. Differences in the porosity of the differently sizes nanogels was more apparent in the absence of the SDNs and the associated polymers that film formed as shown in Fig. S7, ESI.† For each nanogel size, the general morphology of the nanogel aggregates and nanogels/SDNs implants was similar, showing that the presence in the SDNs did not significantly disrupt the structure. In the absence of the SDNs, the interstitial porosity between the nanogels themselves could be measured for the larger two nanogel samples. The mean diameter of the pores was found to be 38 nm (±52 nm) for PNA310 and 65 nm (±30 nm) for PNA450. It is therefore our hypothesis that larger nanogels form aggregates with greater porosity which leads to faster diffusion of drug through the nanocomposites. The effect of nanogel size on release rate provides another way to tune drug release kinetics to suit a required drug delivery need.
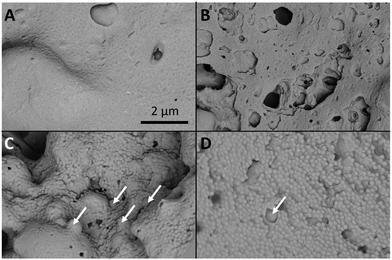 | ||
| Fig. 9 The four different nanogel aggregates with SDNs at 50% loading. (A) PNA65, (B) PNA160, (C) PNA310, (D) PNA 450. The arrows indicate lopinavir SDNs. The scale bar corresponds to all images. | ||
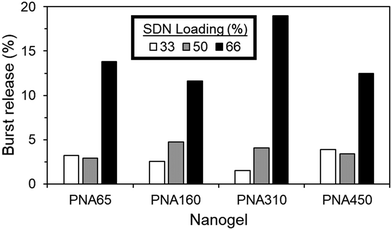
The nanogel aggregate implants generally showed excellent control over burst release, even with increasing SDN loading %, with values as low as 1.5% burst release achieved, (Fig. 10). The burst release period was deemed to occur within the first hour, due to the rapid aggregation of the nanogels, with no dramatic increase in the cumulative % of drug released after the first hour (Fig. S8, ESI†). Regardless of nanogel size, burst release was generally 4.8% or less for ≤50% SDN loading. When loading was increased to 66%, all sizes of nanogel were no longer capable of fully retaining the SDN payload, with burst release now in the range of 11.6% to 18.9%.
Rheological analysis of the nanogel aggregates and implants
The mechanical properties of the nanogel aggregates and nanogel/SDN nanocomposites were then assessed by rheology. All nanogel aggregates had gel-like structures (G′ > G′′) at low stresses due to the formation of a network of aggregated nanogels through the samples.54 There appeared to be no clear correlation with the mechanical properties of the nanogels with particle size. The moduli of the nanogel aggregates were found to be PNA65 < PNA450 < PNA310 < PNA160. The smallest nanogel (PNA 65, Fig. 11A) with the smallest initial G′, showed a σy = 25 Pa, σf = 676 Pa and at rest structure of ∼G′ = 2181 Pa whereas the nanogel with the largest particles (PNA 450) showed only marginally higher elastic modulus of ∼G′ = 4260 Pa but was far more brittle with a much faster structural breakdown of σy = 6 Pa, σf = 23 Pa. The mechanically strongest nanogel was the PNA160 with σy = 166 Pa, σf = 1336 Pa and G′ of ∼48862 Pa. The differences in the mechanical properties of the differently sized nanogels was likely due to the differences in the internal architecture of the nanogels. Larger nanogels have been shown to show greater heterogeneity in crosslinking density with a tendency towards a more densely crosslinked core and loosely crosslinked shell.47,48 As such, there may be greater chain entanglement between nanogels occurring for the larger nanogels, leading to increase moduli. However, smaller nanogels will also possess a higher surface area to volume ratio which may provide increased interparticle interactions. Therefore the different mechanical properties of the nanogels likely arise due to a combination of the different architecture and surface areas of the nanogels. This is an area we will investigate in future studies. The in situ formation of nanogel/SDNs (with the SDNs comprising 50% w/w) implants was then investigated using a temperature sweep measurement. These experiments were carried out in PBS in order investigate the implant formation of the smallest and largest nanogels with SDNs (Fig. 11B). Both samples showed gel-like properties (G′ > G′′) over the temperature range tested. Below the VPTT the swollen nanogels close pack to form a gel. As the samples were heated to the PNA65 + LPV showed a rapid and structural change at T > 36 °C with both G′ and G′′ showing a sharp increase. The PNA450 + LPV did not show the same rapid increase but did show some form of structural change at 36 °C with G′ and G′′ dropping slightly. Above the VPTT of the nanogels, the synergistic dual-responsive behaviour of the nanogels results in aggregation of nanogels into an extended network structure.54 The increased the moduli for the PNA65 + LPV sample may be a result of a denser implant structure compared to the PNA450 + LPV which is broadly supported by the SEM analysis (Fig. 9 and Fig. S7, ESI†). The rheology analysis reveals that the nanogel/SDNs implants formed a gel-like material at body temperature and physiological ionic strength.Conclusions
Four different polyNIPAm nanogels were prepared by varying the amount of surfactant used during the synthesis resulting in samples with mean diameters of 65, 160, 310 and 450 nm. These samples all displayed similar thermoresponsive behaviour in which they deswelled approaching their VPTT of 34 °C in water. In the presence of both elevated temperature and physiological ionic strength the nanogels displayed synergistic dual-stimuli responsive behaviour by aggregating. All nanogel samples showed the ability to aggregate in the presence of lopinavir SDNs as an in situ forming implant at SDN loadings from 33–66 wt%. It was shown that the size of the nanogels resulted in differences in the; (a) release rate of drug from SDN loaded implants of different sized nanogels and (b) implant mechanical stability over time. In the in vitro drug release study, all nanogels proved suitable, with sustained release of drug over time, and low burst release when the SDN payload was as high as 50% loading. The release rate of drug could also be tuned in a linear fashion by changing the % loading of SDN in a matrix of PNA65 nanogels, or the size of the nanogel used to form the implant at 33% SDN loading. Larger nanogels showed faster drug release behaviour likely due to the larger pores present between the deswollen nanogels through which the drug molecules could diffuse. PNA65 showed the greatest performance, as unlike the larger nanogels at higher % loading, PNA65 implants remained stable over time regardless of SDN loading %, with no fracturing of the implant. The nanogel/SDN implants were found to show gel-like mechanical properties at body temperature and physiological ionic strength. The potential to tune the drug release behaviour directly by controlling the size of the nanogels provides an opportunity for personalised medicine by tailor the release kinetics to a patient's needs. It is noteworthy that the polyNIPAm nanogels used in this study are not degradable. However, we are currently designing degradable analogues of these nanogels that would degrade after the drug has been release. Such in situ forming implants may address issues of medication adherence for HIV treatment in the future.Conflicts of interest
There are no conflicts to declare.Acknowledgements
We gratefully acknowledge financial support from the EPSRC (Grant Number EP/M01973X/1) and a DTA studentship. The authors would also like to thank Prof. Steve Rannard for access to equipment and technical support.References
- WHO|HIV/AIDS, http://www.who.int/gho/hiv/en/, accessed 27 October 2017.
- L. Sherr, F. Lampe, S. Norwood, H. Leake Date, R. Harding, M. Johnson, S. Edwards, M. Fisher, G. Arthur, S. Zetler and J. Anderson, AIDS Care – Psychol. Socio-Medical Asp. AIDS/HIV, 2008, 20, 442–448 CrossRef PubMed.
- A. J. Claxton, J. Cramer and C. Pierce, Clin. Ther., 2001, 23, 1296–1310 CrossRef CAS PubMed.
- E. J. Park, S. Amatya, M. S. Kim, J. H. Park, E. Seol, H. Lee, Y. H. Shin and D. H. Na, Arch. Pharmacal Res., 2013, 36, 651–659 CrossRef CAS PubMed.
- K. Meyers, K. Rodriguez, R. W. Moeller, I. Gratch, M. Markowitz and P. N. Halkitis, PLoS One, 2014, 9, e114700 CrossRef PubMed.
- A. Owen and S. Rannard, Adv. Drug Delivery Rev., 2016, 103, 144–156 CrossRef CAS PubMed.
- L. Hu, H. Zhang and W. Song, J. Microencapsulation, 2013, 30, 369–382 CrossRef CAS PubMed.
- R. F. Pagels and R. K. Prud’Homme, J. Controlled Release, 2015, 219, 519–535 CrossRef CAS PubMed.
- D. A. Margolis, J. Gonzalez-Garcia, H. J. Stellbrink, J. J. Eron, Y. Yazdanpanah, D. Podzamczer, T. Lutz, J. B. Angel, G. J. Richmond, B. Clotet, F. Gutierrez, L. Sloan, M. S. Clair, M. Murray, S. L. Ford, J. Mrus, P. Patel, H. Crauwels, S. K. Griffith, K. C. Sutton, D. Dorey, K. Y. Smith, P. E. Williams and W. R. Spreen, Lancet, 2017, 390, 1499–1510 CrossRef CAS.
- R. P. Bakshi, L. M. Tatham, A. C. Savage, A. K. Tripathi, G. Mlambo, M. M. Ippolito, E. Nenortas, S. P. Rannard, A. Owen and T. A. Shapiro, Nat. Commun., 2018, 9, 315 CrossRef PubMed.
- S. Kempe and K. Mäder, J. Controlled Release, 2012, 161, 668–679 CrossRef CAS PubMed.
- Y. M. Kang, S. H. Lee, J. Y. Lee, J. S. Son, B. S. Kim, B. Lee, H. J. Chun, B. H. Min, J. H. Kim and M. S. Kim, Biomaterials, 2010, 31, 2453–2460 CrossRef CAS PubMed.
- M. Amiram, K. M. Luginbuhl, X. Li, M. N. Feinglos and A. Chilkoti, J. Controlled Release, 2013, 172, 144–151 CrossRef CAS PubMed.
- R. R. S. Thakur, H. L. McMillan and D. S. Jones, J. Controlled Release, 2014, 176, 8–23 CrossRef CAS PubMed.
- M. Kilicarslan, M. Koerber and R. Bodmeier, Drug Dev. Ind. Pharm., 2014, 40, 619–624 CrossRef CAS PubMed.
- H. Kranz and R. Bodmeier, Int. J. Pharm., 2007, 332, 107–114 CrossRef CAS PubMed.
- E. Ruel-Gariépy and J. C. Leroux, Eur. J. Pharm. Biopharm., 2004, 58, 409–426 CrossRef PubMed.
- J. C. Wright and D. J. Burgess, Long Acting Injections and Implants, Springer-Verlag, Berlin, 2012 Search PubMed.
- D. Y. Ko, U. P. Shinde, B. Yeon and B. Jeong, Prog. Polym. Sci., 2013, 38, 672–701 CrossRef CAS.
- A. R. Town, M. Giardiello, R. Gurjar, M. Siccardi, M. E. Briggs, R. Akhtar and T. O. McDonald, Nanoscale, 2017, 9, 6302–6314 RSC.
- T. O. McDonald, M. Giardiello, P. Martin, M. Siccardi, N. J. Liptrott, D. Smith, P. Roberts, P. Curley, A. Schipani, S. H. Khoo, J. Long, A. J. Foster, S. P. Rannard and A. Owen, Adv. Healthcare Mater., 2014, 3, 400–411 CrossRef CAS PubMed.
- M. Giardiello, N. J. Liptrott, T. O. McDonald, D. Moss, M. Siccardi, P. Martin, D. Smith, R. Gurjar, S. P. Rannard and A. Owen, Nat. Commun., 2016, 7, 13184 CrossRef CAS PubMed.
- T. O. McDonald, L. M. Tatham, F. Y. Southworth, M. Giardiello, P. Martin, N. J. Liptrott, A. Owen and S. P. Rannard, J. Mater. Chem. B, 2013, 1, 4455 RSC.
- T. Yu, J. Chisholm, W. J. Choi, A. Anonuevo, S. Pulicare, W. Zhong, M. Chen, C. Fridley, S. K. Lai, L. M. Ensign, J. S. Suk and J. Hanes, Adv. Healthcare Mater., 2016, 5, 2745–2750 CrossRef CAS PubMed.
- J. Du, X. Li, H. Zhao, Y. Zhou, L. Wang, S. Tian and Y. Wang, Int. J. Pharm., 2015, 495, 738–749 CrossRef CAS PubMed.
- Z. Dai and T. Ngai, J. Polym. Sci., Part A: Polym. Chem., 2013, 51, 2995–3003 CrossRef CAS.
- W. Xiong, X. Gao, Y. Zhao, H. Xu and X. Yang, Colloids Surf., B, 2011, 84, 103–110 CrossRef CAS PubMed.
- R. Mohsen, G. J. Vine, N. Majcen, B. D. Alexander and M. J. Snowden, Colloids Surf., A, 2013, 428, 53–59 CrossRef CAS.
- R. Gurny, E. Doelker and N. A. Peppas, Biomaterials, 1982, 3, 27–32 CrossRef CAS PubMed.
- X. Tongwen and H. Binglin, Int. J. Pharm., 1998, 170, 139–149 CrossRef CAS.
- M. V. S. Varma, A. M. Kaushal, A. Garg and S. Garg, Am. J. Drug Delivery, 2004, 2, 43–57 CrossRef CAS.
- P. C. Naha, K. Bhattacharya, T. Tenuta, K. A. Dawson, I. Lynch, A. Gracia, F. M. Lyng and H. J. Byrne, Toxicol. Lett., 2010, 198, 134–143 CrossRef CAS PubMed.
- L. H. Lima, Y. Morales and T. Cabral, J. Ophthalmol., 2016, 2016, 5356371 Search PubMed.
- M. A. Cooperstein and H. E. Canavan, Biointerphases, 2013, 8, 1–12 CrossRef PubMed.
- L. C. Graton and H. J. Fraser, J. Geol., 1935, 43, 785–909 CrossRef CAS.
- H. Senff and W. Richtering, Colloid Polym. Sci., 2000, 278, 830–840 CrossRef CAS.
- U. Gasser, J. S. Hyatt, J.-J. Lietor-Santos, E. S. Herman, L. A. Lyon and A. Fernandez-Nieves, J. Chem. Phys., 2014, 141, 034901 CrossRef CAS PubMed.
- D. M. Öle Kiminta and P. F. Luckham, Polymer, 1995, 36, 4827–4831 CrossRef.
- B. R. Saunders and B. Vincent, Adv. Colloid Interface Sci., 1999, 80, 1–25 CrossRef CAS.
- J. Shen and D. J. Burgess, J. Pharm. Pharmacol., 2012, 64, 986–996 CrossRef CAS PubMed.
- H. Hyun, Y. H. Kim, I. B. Song, J. W. Lee, M. S. Kim, G. Khang, K. Park and H. B. Lee, Biomacromolecules, 2007, 8, 1093–1100 CrossRef CAS PubMed.
- A. D’Avolio, L. Baietto, M. Siccardi, M. Sciandra, M. Simiele, V. Oddone, S. Bonora and G. Di Perri, Ther. Drug Monit., 2008, 30, 662–669 CrossRef PubMed.
- W. McPhee, K. C. Tam and R. Pelton, J. Colloid Interface Sci., 1993, 156, 24–30 CrossRef CAS.
- Y. Ono and T. Shikata, J. Am. Chem. Soc., 2006, 128, 10030–10031 CrossRef CAS PubMed.
- R. Pelton, Adv. Colloid Interface Sci., 2000, 85, 1–33 CrossRef CAS PubMed.
- M. Rasmusson and B. Vincent, React. Funct. Polym., 2004, 58, 203–211 CrossRef CAS.
- M. Andersson and S. L. Maunu, J. Polym. Sci., Part B: Polym. Phys., 2006, 44, 3305–3314 CrossRef CAS.
- L. Arleth, X. Xia, R. P. Hjelm, J. Wu and H. U. Zhibinc, J. Polym. Sci., Part B: Polym. Phys., 2005, 43, 849–860 CrossRef CAS.
- M. Rasmusson, A. Routh and B. Vincent, Langmuir, 2004, 20, 3536–3542 CrossRef CAS PubMed.
- P. L. Ritger and N. A. Peppas, J. Controlled Release, 1987, 5, 23–36 CrossRef CAS.
- C. Solas, I. Poizot-Martin, M.-P. Drogoul, I. Ravaux, C. Dhiver, A. Lafeuillade, T. Allegre, M. Mokhtari, J. Moreau, G. Lepeu, N. Petit, A. Durand and B. Lacarelle, Br. J. Clin. Pharmacol., 2004, 57, 436–440 CrossRef CAS PubMed.
- M. Hoekstra, C. Haagsma, C. Neef, J. Proost, A. Knuif and M. van de Laar, J. Rheumatol., 2004, 31, 645–648 CAS.
- D. Kurnik, R. Loebstein, E. Fishbein, S. Almog, H. Halkin, S. Bar-Meir and Y. Chowers, Aliment. Pharmacol. Ther., 2003, 18, 57–63 CrossRef CAS PubMed.
- Z. Shao, A. S. Negi and C. O. Osuji, Soft Matter, 2013, 9, 5492–5500 RSC.
Footnote |
| † Electronic supplementary information (ESI) available. See DOI: 10.1039/c8tb01597j |
| This journal is © The Royal Society of Chemistry 2019 |

