 Open Access Article
Removal of methylene blue from aqueous solution by cattle manure-derived low temperature biochar
Yao Zhua,
Baojun Yi *ab,
Qiaoxia Yuanab,
Yunlian Wua,
Ming Wangab and
Shuiping Yanab
aCollege of Engineering, Huazhong Agricultural University, No. 1, Shizishan Street, Hongshan District, Wuhan, 430070, P. R. China. E-mail: bjyi@mail.hzau.edu.cn; Fax: +86 27 87282120; Tel: +86 27 87282120
bKey Laboratory of Agricultural Equipment in the Mid-lower Yangtze River, Ministry of Agriculture, Wuhan, 430070, P. R. China
First published on 30th May 2018
Abstract
Biochar is a low cost and renewable adsorbent which can be used to remove dye from wastewater. Cattle manure-derived low temperature biochar (CMB) was studied to remove methylene blue (MB) from aqueous solution in this paper. The effect of factors including initial concentration of MB, dosage, contact time, and pH on the adsorption properties of MB onto biochar were studied. Characterization of the CMB and MB adsorbed on CMB was performed using techniques including BET, FTIR and SEM. The adsorption isotherm, kinetics, thermodynamics and mechanism were also studied. The results showed the equilibrium data were well fitted to the Langmuir isotherm model, and the saturation adsorption capacity of CMB200 was 241.99 mg g−1. Pseudo-second order kinetics was the most suitable model for describing the adsorption of MB onto biochar. The adsorption thermodynamics of MB on biochar showed that the adsorption was a spontaneous and endothermic process. Through zeta potential measurement, Boehm titration, cation exchange, deashing and esterification experiments, the importance of ash to adsorption was verified, as well as the adsorption mechanism. The adsorption mechanism of MB on CMB200 involved cation exchange, electrostatic interaction, hydrogen bonding, physical effects and others. This work shows that CMB200 holds promise to act as an effective adsorbent to remove MB in wastewater.
1. Introduction
The use of dye in industry produces a large amount of printing and dyeing wastewater, which causes great harm to the environment and human body. Therefore, removing dye from wastewater is a prerequisite for preventing its discharge into the environment.1,2 Methylene blue (MB) is a cationic dye which has been widely studied because of its known strong adsorption onto solids, and it often serves as a model compound for removing organic contaminants and colorants from aqueous solutions.3 In various processing technologies, adsorption is widely considered to be superior to other technologies in terms of cost, flexibility, design simplicity, ease of operation, and sensitivity to toxic pollutants.1,4,5 However, the high cost of activated carbon makes it increasingly important to find low-cost, renewable adsorption materials.2,6Compared to activated carbon, biochar has a wide range of sources, including industrial waste,7 agricultural by-products,3,8,9 livestock manure,10,11 sludge, etc.12 Biochar itself has the advantages of large pores,9,13 high surface area,13 and rich surface functional groups.7,9 Rich surface functional groups are considerably more important than high porosity in the adsorption process.14
With the expansion of large-scale farms, the disposal of livestock manure is becoming a major problem.15,16 In a previous study, livestock manure-derived biochar was used for soil improvement and soil pollution control.17 However, the amount of livestock manure produced by large-scale farms exceeds the needs of local farmlands. In addition, direct utilization as fertilizer generates unpleasant smells. The anaerobic fermentation of livestock and poultry manure can reduce the smell, but the process is too slow. Therefore, it is urgent to find a new method of fecal treatment and resource utilization.18
In experiments comparing the use of cattle manure (CM) and rice husks for heavy metal adsorption, it was found that CM had better adsorption characteristics than rice husks,19 indicating that CM had good adsorption properties. Cattle manure biochar (CMB) is particularly effective for treatment of heavy metals,19–21 and represents a new form of resource utilization of CM. As was shown in a previous study, dairy manure (DM) biochar presents a high adsorption efficiency of Cu, Zn, and Cd. The adsorption efficiency of DM biochar prepared at 350 °C is higher than that prepared at 200 °C.21 The precipitation-based mechanism is the main reason for the high efficiency of the heavy metal adsorption of CMB, and its effectiveness is attributed to the high ash content of CMB.21 Studies of CMB have focused on the adsorption of heavy metals, while the study of the adsorption of organic matter has concentrated on straw biochar.1,2 Thus, there has been little research on the adsorption of organic matter by CMB. An earlier experiment compared the use of washed and unwashed peanut straw for the adsorption of methyl violet, and found a weak adsorption ability of the washed peanut straw biochar, which showed that the existence of soluble salts in biochar can improve its ability to adsorb organics.22 Elsewhere, the adsorption performance of biochar modified with phosphate and carbonate was improved greatly; therefore, the soluble alkali salts in ash play a role in ion exchange in the adsorption process. Ash content is beneficial to the adsorption of organic matter, so the high ash content of CM makes it a promising research object.23
Leng used sludge biochar to adsorb dye, and found that the adsorption performance of the sludge biochar prepared at 260 °C was superior to that at 340 °C.14 Adsorption of lead by sugarcane biochar is facilitated at low temperature, because the functional groups on the surface of high temperature biochar are less abundant than those of low temperature biochar.24 Preparing CMB at low temperature is more economical in addition to the improvements in its practical performance.25 CM300 has good adsorption properties for alastin,26 but the underlying mechanism has not been analyzed. However, the clarification of the reaction mechanism is very important for the removal of organic matter by CMB.25
To address the lack of research on the adsorption of organic matter by CMB, especially for CMB as an adsorbent prepared under low temperature conditions, this study carried out experiments on the adsorption of MB by low temperature CMB from three aspects: (1) the feasibility of low temperature pyrolysis to prepare CMB as an adsorbent for removal of MB from aqueous solution; (2) the adsorption properties of MB and the optimum parameters; (3) possible mechanisms of action.
2. Experimental
2.1. Materials and pretreatment
CM was obtained from Wuhan Jiangxia District Crusades Animal Husbandry Limited Liability Company (Wuhan, China). Fresh CM samples were dried, crushed, sieved through 60-mesh sieves and oven dried at 105 °C for 24 h to ensure drying, then crushed to a particle size between those of 60-mesh sieves and 200-mesh sieves. Because most research has focused on the adsorption of organic matter by straw biochar,1,2 for the purpose of comparison with the data on conventional methods, five kinds of agricultural and forestry wastes including sawdust (SD), cotton stalk (CS), rape stalk (RS1), rice stalk (RS2) and rice chaff (RC) were selected as adsorbents for control experiments to determine the adsorption ability of CM in this paper. The CS, RS1, and RS2 were taken from a location in Hubei. The SD and RC were purchased from a wood processing plant and rice processing plant, respectively. The stalks were also broken up, dried and sieved. As shown in Table 1, all the samples in this study had about 9% moisture content on an air-dried basis, while CM had a lower volatile matter (VM) content and a higher ash (A) content than the other samples. The contents of A in SD and CS were low, and the fixed carbon (FC) contents of RS1 and RS2 were low. The CM contained relatively low contents of C and H and higher contents of O and N. MB was purchased from Sinopharm and used without further purification. The molecular weight of MB is 373.9 g mol−1. Ultrapure water was used to prepare all sorbent solutions and wash all vessels. All solutions were prepared by diluting the stock solution with ultrapure water to the needed concentration.| No. | Sample | Proximate analysis (wt% ad) | Ultimate analysis (wt% daf) | |||||||
|---|---|---|---|---|---|---|---|---|---|---|
| M | VM | FC | A | C | H | Oa | N | S | ||
| a Calculated by difference. | ||||||||||
| 1 | CM | 9.49 | 45.80 | 12.52 | 32.19 | 41.13 | 5.89 | 49.92 | 2.69 | 0.37 |
| 2 | SD | 9.60 | 76.08 | 13.86 | 0.47 | 59.67 | 7.34 | 32.55 | 0.41 | 0.03 |
| 3 | CS | 9.80 | 67.19 | 19.50 | 3.51 | 47.48 | 6.28 | 44.42 | 1.21 | 0.61 |
| 4 | RS1 | 9.04 | 77.38 | 6.77 | 6.81 | 46.93 | 6.33 | 45.46 | 0.52 | 0.76 |
| 5 | RS2 | 9.21 | 69.79 | 9.13 | 11.87 | 46.08 | 6.29 | 46.28 | 0.79 | 0.56 |
| 6 | RC | 9.38 | 63.98 | 16.15 | 10.49 | 55.19 | 6.93 | 37.08 | 0.35 | 0.46 |
2.2. Preparation and characterization of adsorbent
A square crucible of 120 × 60 × 20 mm containing 2 g sample was placed in a tube furnace, and torrefied in a N2 atmosphere at 200 °C for 30 minutes. Before the reaction, N2 gas was supplied into the tube furnace in advance to ensure an inert gas atmosphere. After torrefaction, the sample was cooled in a N2 container, weighed, packed in a sealed bag and stored in a dry container. All of the biochars are denoted with the suffix “B”, for example the CM biochar is denoted as CMB. The different torrefaction temperatures are indicated in subscript after the suffix, for example the CM biochar prepared at 200 °C is denoted as CMB200. In addition to the biochar prepared at 200 °C, samples of biochar were also prepared by pyrolysis at 800 °C for comparison with the high-temperature biochars reported in the literature. Other than increasing the temperature to 800 °C, the pyrolysis process was similar to that of torrefaction. In order to analyze the characteristics of CMB after adsorption, samples were prepared after adsorption for 80 min and 180 min, which were denoted as CMB200-80 and CMB200-180 respectively. Meanwhile, in order to study the effect of washing on the surface adsorption properties, a sample of char was washed after 180 min adsorption, and labeled as CMB200-180-w.An Accelerated Surface Area and Porosimetry System (ASAP 2020) was used for analysing the specific surface area and pore structure. The N2 adsorption method was used in the experiment, in which the specific surface area was calculated with the Brunauer–Emmett–Teller (BET) method based on adsorption isotherms. A VERTEX 70 Fourier transform infrared (FTIR) spectrometer from Bruker (Germany) was used to analyze the functional groups on the surface. Char samples were mixed with KBr at a ratio of 1![[thin space (1/6-em)]](https://www.rsc.org/images/entities/char_2009.gif) :
:![[thin space (1/6-em)]](https://www.rsc.org/images/entities/char_2009.gif) 180 and the wavenumber range of infrared scanning was 400–4000 cm−1. The zeta potential was analyzed by the methods described in previous references.27 The contents of oxygen-containing functional groups of the samples were determined using Boehm titration by a standard method.24 The extent of cation exchange was determined after the reaction, by the method described in previous references.14
180 and the wavenumber range of infrared scanning was 400–4000 cm−1. The zeta potential was analyzed by the methods described in previous references.27 The contents of oxygen-containing functional groups of the samples were determined using Boehm titration by a standard method.24 The extent of cation exchange was determined after the reaction, by the method described in previous references.14
The method of deashing by HCl–HF washing has been described elsewhere.28 The carboxyl groups on the surface of CM were removed by esterification, and the adsorption ability of the modified CM was experimentally determined to deduce the effect of the surface carboxyl groups during adsorption. The esterification of the dried biomass was carried out according to a method described elsewhere.29
2.3. Adsorption procedure
Adsorption experiments were performed in a laboratory water bath shaker. The adsorbent and the solution were placed in a 50 mL centrifuge tube, the volume of the reaction solution was maintained at 20 mL, and the amount of the adsorbent was 0.025 g. The mixture was subjected to constant-temperature shaking adsorption at 300 rpm for 80 minutes. Before each measurement, the measuring instruments were calibrated. After the end of adsorption, the solution was centrifuged at 4000 rpm for 15 minutes, and the supernatant was diluted and measured at the range of 0 mg L−1 to 10 mg L−1. The MB concentration in solution was analyzed using a UV spectrophotometer (UH5300, HITACHI) by monitoring the absorbance changes at the wavelength of 670 nm.30Adsorption isotherm experiments were performed by placing 20 mL MB into a 50 mL centrifuge tube, then adding 0.025 g of biochar to the solution and shaking for 24 hours in a laboratory water bath shaker until equilibrium. The experiment was repeated three times. The equilibrium adsorption capacity qe (mg g−1) was calculated by the following formula:31
 | (1) |
The removal rate formula is:
 | (2) |
C0 and Ce (mg L−1) are the liquid phase concentrations of MB at the initial time and equilibrium, respectively. V is the volume of the solution (L) and W is the mass of the dry adsorbent (g).
The kinetics were studied by a similar procedure to the equilibrium experiments. The solution was extracted and analyzed at different times (30 min, 90 min, 240 min, 1200 min and 1440 min). The amount of adsorption qt (mg g−1) at t min was calculated by the following formula:3
 | (3) |
C0 and Ct (mg L−1) are the initial liquid phase concentration and the concentration at time t. V is the volume of solution (L) and W is the mass of dry adsorbent (g).
3. Results and discussion
3.1. Characterization of CM and CMB
| Sample | Carboxyl (mmol g−1) | Lactonic (mmol g−1) | Phenolic (mmol g−1) | Basic functional groups (mmol g−1) | pHIEP | Zeta potential (mV) |
|---|---|---|---|---|---|---|
| CMB200 | 0.375 | 0.1875 | 0.4375 | 0.875 | 2.6 | −39 |
| CMB800 | 0.125 | 0.125 | 0.25 | 1 | 4.4 | −19 |
The protonation and deprotonation of functional groups create a net charge on surface carbons, forming an electrical double layer in solution near the surface.22 The pHIEP, i.e. the pH at which the charge on the surface carbons is zero, reflects the combined influence of all the functional groups. With the increase of pyrolysis temperature, the pHIEP of biochar increased, but remained very low compared with activated carbon. Combined with the results of Boehm titration, it can be inferred that the low pHIEP of biochar is due to the surface functional groups.32
The zeta potential of CMB is negative, indicating that the surface of CMB is negatively charged. The zeta potential of the biochar decreased with increased pyrolysis temperature, i.e. the biochars produced at lower temperatures carried more negative surface charges than those produced at higher temperatures,33 which provides another explanation for the good adsorption effectiveness of CMB200.
![[double bond, length as m-dash]](https://www.rsc.org/images/entities/char_e001.gif) C symmetrical stretching of pyrone groups and C
C symmetrical stretching of pyrone groups and C![[double bond, length as m-dash]](https://www.rsc.org/images/entities/char_e001.gif) O stretching of carboxylic groups.35 The bands between 1320 cm−1 and 1210 cm−1 were the axial deformation vibrations of the C–O bond in phenols.35 The bands between 1000 cm−1 and 1300 cm−1 correspond to the angular deformation in the plane of C–H bonds of the aromatic rings.35 The peak intensity from 779 cm−1 to 795 cm−1 was assigned to O–H stretching.36 The peak at 465 cm−1 was attributed to the Si–O–Si bending vibration.37 The shift, attenuation and disappearance of the peaks under certain conditions can be seen in Fig. 1 and Table 3.
O stretching of carboxylic groups.35 The bands between 1320 cm−1 and 1210 cm−1 were the axial deformation vibrations of the C–O bond in phenols.35 The bands between 1000 cm−1 and 1300 cm−1 correspond to the angular deformation in the plane of C–H bonds of the aromatic rings.35 The peak intensity from 779 cm−1 to 795 cm−1 was assigned to O–H stretching.36 The peak at 465 cm−1 was attributed to the Si–O–Si bending vibration.37 The shift, attenuation and disappearance of the peaks under certain conditions can be seen in Fig. 1 and Table 3.
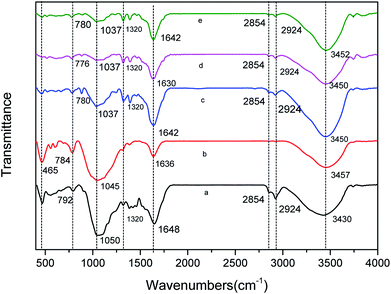 | ||
| Fig. 1 FTIR of various CMB prepared under different conditions. (a) CMB200; (b) CMB800; (c) CMB200-80; (d) CMB200-180; (e) CMB200-180-w. | ||
| CMB200 | CMB800 | CMB200-80 | CMB200-180 | CMB200-180-w | Functional groups |
|---|---|---|---|---|---|
| 3430 | 3457 | 3450 | 3450 | 3450 | Free phenols –OH34 |
| 2924 | — | 2924 | 2924 | 2924 | –CH2 groups4,13 |
| 2854 | — | 2854 | 2854 | 2854 | –CH3 groups4,13 |
| 1648 | 1636 | 1642 | 1630 | 1642 | C![[double bond, length as m-dash]](https://www.rsc.org/images/entities/char_e001.gif) C, C C, C![[double bond, length as m-dash]](https://www.rsc.org/images/entities/char_e001.gif) O of carboxylic groups34 O of carboxylic groups34 |
| 1320 | 1312 | 1320 | 1320 | 1320 | C–O bond in phenols34 |
| 1050 | 1050 | 1037 | 1037 | 1037 | C–H bonds of the aromatic rings34 |
| 792 | 784 | 780 | 776 | 780 | O–H35 |
| 465 | 465 | 465 | — | 465 | Si–O–Si36 |
Comparing the FTIR curves of CMB200 before and after adsorption, it can be seen that fatty hydrocarbons and acid functional groups play a major role in adsorption. After adsorption, the peaks at 465 cm−1 and 2800–2931 cm−1 disappeared, and those at 1000–1160 cm−1 decreased. From the above results of Boehm titration, the adsorption ability of the biochar was closely related to the surface functional groups. Comparing the FTIR curves of CMB200 after contact times of 180 min and 80 min, no significant changes were found in the positions and intensity of the various peaks, and the curves did not change after washing. This implies that the adsorptive role played by the functional groups of CMB200 became less important after 80 min, and the adsorption after this time was dominated by surface physical adsorption.
3.2. Adsorption experiments
| Sample | qt (mg g−1) | Sample | qt (mg g−1) |
|---|---|---|---|
| CMB200 | 129.95 ± 5.44 | SDB200 | 33.20 ± 2.89 |
| CMB400 | 55.10 ± 2.66 | CSB200 | 69.37 ± 3.03 |
| CMB600 | 55.99 ± 1.52 | RS1B200 | 102.21 ± 2.44 |
| CMB800 | 40.99 ± 0.85 | RS2B200 | 50.03 ± 0.91 |
| RCB200 | 23.08 ± 1.91 |
3.3. Adsorption isotherm
To model the adsorption process of MB solution onto biochar, the adsorption data were fitted using the Langmuir, Freundlich and Temkin isotherm models. The Langmuir, Freundlich, and Temkin isothermal equations are as follows.48,49
 | (4) |
 | (5) |
 | (6) |
In eqn (4)–(6), Ce is the equilibrium concentration (mg L−1); qe is the adsorption capacity at equilibrium time (mg g−1); Q0 is the maximum adsorption capacity (mg g−1); b is the Langmuir constant related to adsorption capacity (mg g−1); KF is the Freundlich constant (L mg−1); n is the adsorption “intensity”; KT is the equilibrium binding constant (L mg−1); bT is the Temkin isotherm constant.
The adsorption isotherm curves of CMB at different temperatures and different MB concentrations are given in Fig. 8. The fitting parameters of the adsorption isothermal models and the correlation coefficients of the experimental data are given in Table 5.
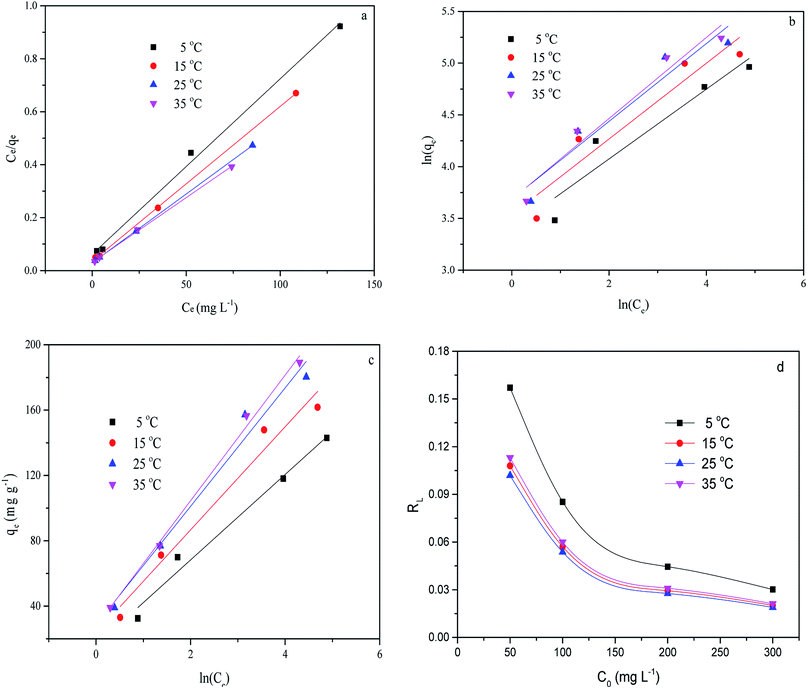 | ||
| Fig. 8 Linear fits of the adsorption of MB on CMB predicted by various isotherm models. (a) Langmuir; (b) Freundlich; (c) Temkin; (d) RL. | ||
| T (°C) | Langmuir model | Freundlich model | Temkin | ||||||
|---|---|---|---|---|---|---|---|---|---|
| Q0 (mg g−1) | b (mg g−1) | R2 | kF (L mg−1) | 1/n | R2 | KT (L mg−1) | bT | R2 | |
| 5 | 150.83 | 0.1073 | 0.9945 | 29.99 | 0.3369 | 0.8565 | 1.84 | 88.45 | 0.9744 |
| 15 | 170.94 | 0.1653 | 0.9997 | 34.33 | 0.3657 | 0.8593 | 2.11 | 74.63 | 0.9601 |
| 25 | 192.31 | 0.1763 | 0.9999 | 39.91 | 0.3756 | 0.8887 | 2.20 | 68.38 | 0.9646 |
| 35 | 204.08 | 0.1184 | 0.9989 | 39.77 | 0.3911 | 0.9352 | 2.05 | 66.63 | 0.9933 |
First of all, the correlation coefficients indicate that the Langmuir model is better than the Freundlich model, which means the adsorption process is a single layer adsorption process.50 The factor 1/n in the Freundlich isotherm model reflects the heterogeneity factor and the adsorption intensity; the smaller the 1/n, the greater the expected heterogeneity.51 The Temkin isotherm model, which describes adsorption as a chemical process, assumes that the heat of adsorption of all the molecules on a layer decreases linearly rather than logarithmically with coverage.48 In the present study, the Temkin isotherm fitted the results well (R2 > 0.96). Therefore, electrostatic interaction is an important mechanism for the adsorption of MB on CMB.
A separation or equilibrium factor (RL) can be defined based on the Langmuir isotherm such that RL = 1/(1 + C0b), where C0 is the initial MB concentration. When 0 < RL < 1 this indicates favorable adsorption, and RL > 1 means unfavorable adsorption; RL = 0 indicates irreversible adsorption, and RL = 1 means linear adsorption.46 In the present study, as shown in Fig. 8, RL was less than 1, which indicated that the adsorption of MB on CMB200 was favorable. Furthermore, increasing the initial MB concentration enhanced the adsorption process. With the increase of temperature, the decreased RL implied the favorable adsorption of MB onto CMB.
3.4. Adsorption kinetics
The adsorption kinetics contain information about the physical or chemical interaction between adsorbent and adsorbate, and are important for evaluating the mechanism and efficiency of the sorption process.46 In order to study the mechanism of MB adsorption on CMB, pseudo-first order, pseudo-second order, and intra-particle diffusion models were separately used to describe the kinetic process.51,52
 | (7) |
 | (8) |
 | (9) |
In eqn (7)–(9), qe is the adsorption capacity at equilibrium time (mg g−1); qt is the adsorption capacity at time t (mg g−1); k1 is the pseudo-first order rate constant (min−1); k2 is the pseudo-second order rate constant (g mg−1 min−1); kd is the intra-particle diffusion rate constant (g mg−1 min−1/2); C is a constant.
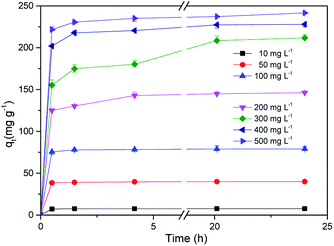
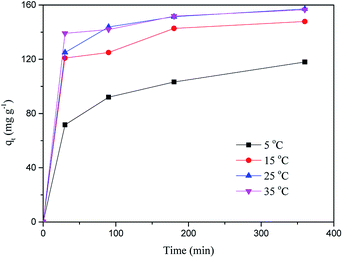
Fig. 9 shows the adsorption kinetic curve of MB in solution onto CMB at 25 °C. Table 6 gives the fitting parameters of the three kinetic models of the adsorption process under different temperature and MB concentration conditions.
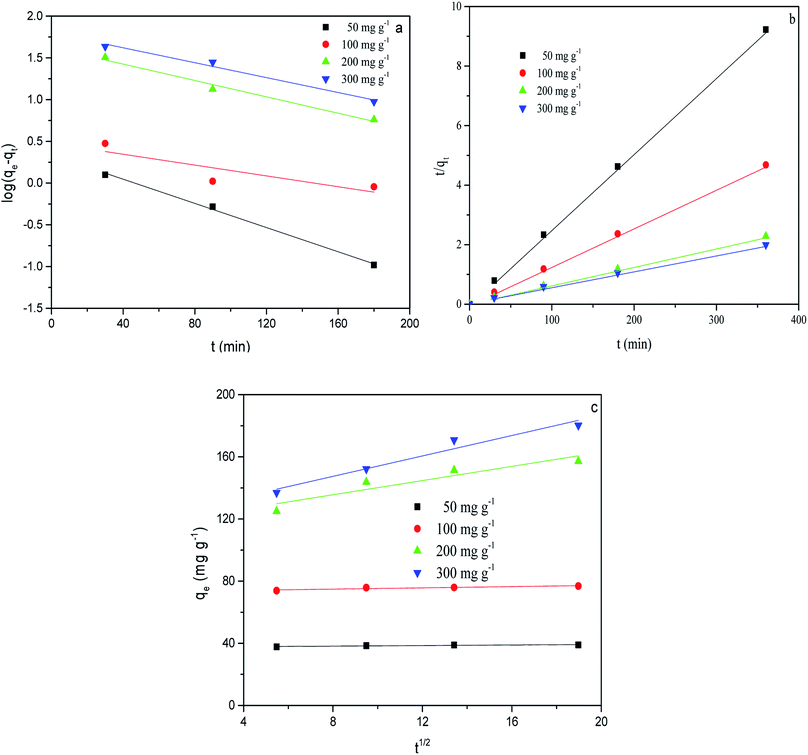 | ||
| Fig. 9 Kinetic fits for MB adsorption on CMB (25 °C) using different kinetic models. (a) Pseudo-first order; (b) pseudo-second order; (c) intra-particle diffusion. | ||
| T (°C) | Pseudo-first model | Pseudo-second model | Intra-particle diffusion model | ||||||||
|---|---|---|---|---|---|---|---|---|---|---|---|
| C0 (mg L−1) | qe,exp (mg g−1) | qe,cal (mg g−1) | k1 (min−1) | R2 | qe,cal (mg g−1) | k2 (g mg−1 min−1) | R2 | Kd (g mg−1 min−1/2) | C | R2 | |
| 5 | 50 | 32.49 | 4.01 | 0.0126 | 0.9589 | 32.82 | 0.008 | 0.9999 | 0.21 | 28.83 | 0.7638 |
| 100 | 69.94 | 13.96 | 0.017 | 0.8123 | 70.97 | 0.0027 | 0.9997 | 0.52 | 60.86 | 0.8203 | |
| 200 | 118.02 | 55.45 | 0.0076 | 0.9707 | 126.42 | 0.00026 | 0.9955 | 3.35 | 56.59 | 0.9580 | |
| 300 | 142.98 | 47.61 | 0.0085 | 0.9915 | 148.81 | 0.00039 | 0.9985 | 2.77 | 92.75 | 0.9471 | |
| 15 | 50 | 33.09 | 2.57 | 0.006 | 0.9993 | 33.38 | 0.007 | 0.9998 | 0.16 | 30.11 | 0.9985 |
| 100 | 71.28 | 8.15 | 0.01 | 0.7829 | 71.99 | 0.033 | 0.9999 | 0.49 | 62.69 | 0.7370 | |
| 200 | 147.87 | 46.56 | 0.012 | 0.8031 | 152.91 | 0.00049 | 0.9982 | 2.19 | 108.26 | 0.8648 | |
| 300 | 161.74 | 44.28 | 0.0075 | 0.849 | 167.50 | 0.00038 | 0.9973 | 2.49 | 114.77 | 0.9404 | |
| 25 | 50 | 39.01 | 2.17 | 0.017 | 0.9944 | 39.15 | 0.026 | 1 | 0.09 | 37.46 | 0.77 |
| 100 | 76.88 | 2.99 | 0.0075 | 0.5025 | 77.16 | 0.0074 | 0.9999 | 0.20 | 73.26 | 0.78 | |
| 200 | 157.19 | 41.86 | 0.011 | 0.96735 | 161.29 | 0.00061 | 0.9997 | 2.28 | 117.33 | 0.82 | |
| 300 | 180.24 | 63.10 | 0.01 | 0.9679 | 187.27 | 0.00034 | 0.9987 | 3.28 | 121.18 | 0.94 | |
| 35 | 50 | 39.11 | 1.19 | 0.007 | 0.7553 | 39.23 | 0.026 | 0.9999 | 0.08 | 37.81 | 0.8873 |
| 100 | 76.93 | 2.40 | 0.01 | 0.6372 | 77.10 | 0.012 | 1 | 0.15 | 74.34 | 0.6382 | |
| 200 | 156.56 | 25.99 | 0.0089 | 0.8433 | 159.49 | 0.00081 | 0.9994 | 1.38 | 130.98 | 0.9219 | |
| 300 | 189.14 | 37.71 | 0.0061 | 0.9813 | 193.79 | 0.00044 | 0.9983 | 2.36 | 144.73 | 0.9927 | |
At 25 °C, the pseudo-second order model (R2 > 0.99) better describes the adsorption kinetics than the pseudo-first order model. The pseudo-second order model is valid in the case of diffusion of the external liquid membrane, surface adsorption and intra-particle diffusion; this implies that the adsorption process is controlled by chemical adsorption, involving exchange or sharing of electrons between the MB cations and functional groups of the biomass surface.29
The intra-particle diffusion model was used to study the mechanisms of adsorption and rate control.49 Because C ≠ 0, the adsorption process may involve various adsorption mechanisms.49 The first linear part of the curve represents the surface adsorption, whereas the second linear portion is the slow diffusion of the adsorbate from the surface to the inner holes.47 It can be seen that the surface adsorption is fast and is the main step in low concentrations of MB solution. As the concentration of solution increases, the surface adsorption and intra-particle diffusion become more important in the mechanism of CMB200 adsorption.
3.5. Adsorption thermodynamics
The thermodynamic parameters of free energy change (ΔG0, kJ mol−1), enthalpy change (ΔH0, kJ mol−1) and entropy change (ΔS0, kJ mol−1 K−1) were used to describe the thermodynamic behavior of the adsorption of MB on CMB200. These parameters were estimated using the following equations:52
ΔG = −RT![[thin space (1/6-em)]](https://www.rsc.org/images/entities/char_2009.gif) ln(K) ln(K)
| (10) |
 | (11) |
The thermodynamic parameters of the adsorption of MB are shown in Table 7. The negative ΔH and the positive ΔG show that the adsorption process is spontaneous and exothermic.52 Hence, as the adsorption temperature increases, the adsorption capacity increases. The ΔG values of MB adsorption onto biochar were measured at 278 K, 288 K, 298 K and 308 K. ΔG decreases with the increase of temperature, indicating that adsorption is more favorable at higher temperature.14 The high value of ΔH indicated a strong interaction between the adsorbate and adsorbent.53 Meanwhile, the positive values of ΔS suggest increased randomness at the solid/solution interface during the adsorption process.52
| Temperature (K) | ΔG (kJ mol−1) | ΔH (kJ mol−1) | ΔS (J mol−1 K−1) |
|---|---|---|---|
| 278 | −6.439 | −16.169 | 82.493 |
| 288 | −8.004 | ||
| 298 | −8.734 | ||
| 308 | −8.881 |
3.6. Possible mechanisms
As the temperature of pyrolysis increases, the pores become larger, but the adsorption capacity decreases. This phenomenon indicates that in the process of adsorption by CMB, the pores do not play a major role. The same conclusion was reached in a study of the adsorption of Cr by coconut shells.25 As the temperature of pyrolysis increases, the trend of adsorption capacity is the same as that of the amount of functional groups, indicating that adsorption is related to oxygen-containing functional groups.14From the FTIR, as the pyrolysis temperature increased, the carboxylic peak weakened and shifted, and the adsorption capacity fell from 129.95 mg g−1 (CMB200) to 40.99 mg g−1 (CMB800). Combined with the results of Boehm titration, this implies that carboxyl plays an important role in the process of adsorption. In order to further determine the effect of carboxyl groups, methanol was used to treat CM, and the adsorption results using the modified CM are given in Table 8. The adsorption efficiency decreased from 93.61% to 54.80%, confirming the important influence of carboxyl groups on the adsorption ability of CMB200.
| Adsorbent | Removal rate (%) |
|---|---|
| CMB200 | 93.61 ± 2.25 |
| CMB200 + wash ash | 20.35 ± 1.82 |
| CMB200 + esterification | 54.80 ± 0.32 |
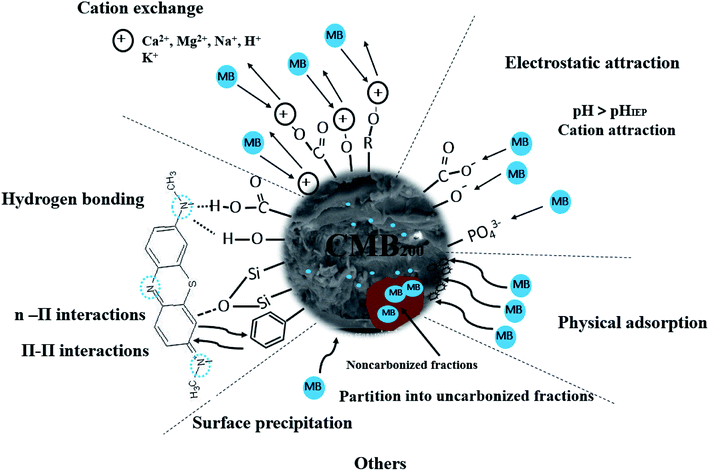
A possible mechanism of action of carboxyl is as follows. In neutral and alkaline conditions, carboxyl groups release protons, becoming negatively charged, leading to strong electrostatic attraction between carboxyl and MB cations.47 The oxygen-containing functional groups (–OH) of CMB200 are also electrostatically attracted to MB, leading to its removal.54
In addition, the oxygen containing functional groups (–COOH, –OH) of CMB take part in hydrogen bonding with MB. This is one of the reasons for the decreasing adsorption of MB with increasing pyrolysis temperature: the CMB surface becomes more hydrophobic, and the adsorption capacity of polar molecules like MB is greatly diminished.35,37
The Si–O–Si peak at 465 cm−1 is weakened during the adsorption of MB on CMB200, which suggests that Si–O–Si plays a role in the process of adsorption. Studies in the literature report that n–π interaction occurs between Si–O–Si and MB.48 Moreover, in alkaline solution, the presence of Si–O–Si is beneficial to the adsorption of cationic MB.37
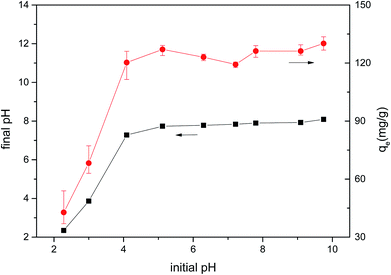
The pH change of the solution after the adsorption of CM was observed, and the pH of the solution decreased under alkaline conditions after adsorption. Considering the results of Boehm titration and FTIR, this may be because of the ion-exchange interaction between MB and CMB (H+ ions are liberated, causing the pH to decrease).23,55
In order to determine whether other cationic exchange processes in addition to that of H+ ions play a role in MB adsorption, the net content of cationic exchange was measured, as shown in Table 9. After adsorption, the cationic content in the solution increased, indicating that cationic exchange plays an important role in the process of MB adsorption. Cation exchange has been shown previously to play an important role in the adsorption process.29 The total amount of cationic release was not equal to the amount of MB adsorbed. This result indicates that cation exchange is not the only mechanism for the adsorption of MB, and other mechanisms affect the adsorption process.
| Sample | The net of released cations (mol kg−1) | MB (mol kg−1) | ||||
|---|---|---|---|---|---|---|
| Ca2+ | Mg2+ | Na+ | K+ | Total | ||
| CMB200 | 0.088 | 0.206 | 0.0008 | 0.00181 | 0.20861 | 0.38544 |
In order to determine the effect of ash on adsorption, CMB was used to adsorb MB after deashing. The adsorption efficiency of CMB decreased from 93.61% to 20.35%, indicating that the ash content plays a very important role in the adsorption process. The ash content mostly contributes to adsorption by the following two mechanisms: (1) the existence of ash means that the CMB surface carries a more negative charge (PO43− and negatively charged silane groups) in alkaline solution,33 leading to a strong electrostatic attraction to MB;22 (2) cation exchange is closely related to the soluble alkali salts in ash.23 The CMB adsorption efficiency decreases as the pyrolysis temperature increases, and is minimized at 300 °C (within the range 200–300 °C). This is because as the temperature rises, the inorganic salts in ash form P–Ca–Mg crystals,21 resulting in reduced ash content in the solution, and reduced electrostatic interaction and ion exchange. The possible mechanisms of the MB adsorption process are summarized in Fig. 10.
4. Conclusion
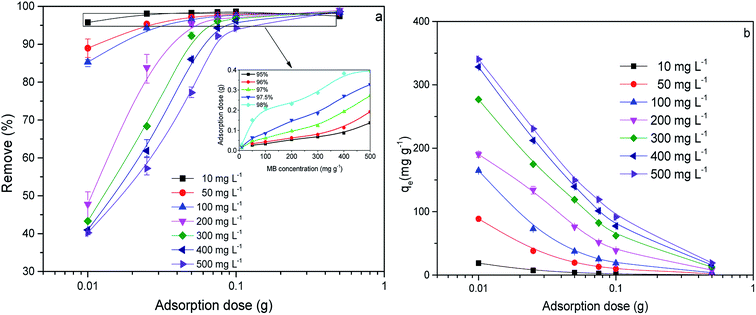
The removal of MB from aqueous solution by CMB was studied in this paper. The biochar prepared by low temperature pyrolysis (CMB200) has a good ability to adsorb MB, and its removal rate is more than three times that of CMB800. When the initial MB concentration C0 is 200 mg L−1 and the CMB200 mass is 0.05 g, the removal rate reaches 95.36%. It is not economically feasible to achieve a removal rate of MB above 95% using CMB. However, this is an acceptable removal rate of MB from aqueous solution. The Langmuir and pseudo second order equations can accurately describe the adsorption process. CMB behaves as an adsorbent by single layer adsorption, and increasing the temperature and increasing the initial concentration are conducive to the adsorption process. Thermodynamically the adsorption process is spontaneous and exothermic. The interaction between CMB200 and MB involves ion exchange, electrostatic attraction, hydrogen bonding and physical adsorption. The high contents of ash and surface functional groups in CM are responsible for its good adsorption performance.Conflicts of interest
There are no conflicts to declare.Acknowledgements
This research was financially supported by the Natural Science Foundation of Hubei Provincial (2017CFB231), the Special Fund for Agro-scientific Research in the Public Interest of China (201303091) and the Fundamental Research Funds for the Central Universities (2662015QD048, 2015PY077, 201810504073 and 2018230). The authors would like to thank Dr Ruili Gao from HZAU and Dr Honghong Lv from NKU for the experiments help and valuable inputs. The authors also acknowledge the extended help from the Analytical and Testing Center of Huazhong Agricultural University (HZAU).References
- M. Rafatullah, O. Sulaiman, R. Hashim and A. Ahmad, J. Hazard. Mater., 2010, 177, 70–80 CrossRef PubMed.
- O. S. Bello, K. A. Adegoke, A. A. Olaniyan and H. Abdulazeez, Desalin. Water Treat., 2015, 53, 1292–1315 Search PubMed.
- B. H. Hameed, A. T. M. Din and A. L. Ahmad, J. Hazard. Mater., 2007, 141, 819–825 CrossRef PubMed.
- Y. Bulut and H. Aydın, Desalination, 2006, 194, 259–267 CrossRef.
- K. Mahmoudi, K. Hosni, N. Hamdi and E. Srasra, Korean J. Chem. Eng., 2015, 32, 274–283 CrossRef.
- D. Pathania, S. Sharma and P. Singh, Arabian J. Chem., 2013, 10, S1445–S1451 CrossRef.
- S. Altenor, B. Carene, E. Emmanuel, J. Lambert, J. Ehrhardt and S. Gaspard, J. Hazard. Mater., 2009, 165, 1029–1039 CrossRef PubMed.
- M. Ghaedi, A. G. Nasab, S. Khodadoust, M. Rajabi and S. Azizian, J. Ind. Eng. Chem., 2014, 20, 2317–2324 CrossRef.
- L. Lonappan, T. Rouissi, R. K. Das, S. K. Brar, A. A. Ramirez, M. Verma, R. Y. Surampalli and J. R. Valero, Waste Manag., 2016, 49, 537–544 CrossRef PubMed.
- Q. Qian, M. Machida, M. Aikawa and H. Tatsumoto, J. Mater. Cycles Waste Manage., 2008, 10, 53 CrossRef.
- Q. Qian, S. Sunohara, Y. Kato, M. A. A. Zaini, M. Machida and H. Tatsumoto, Appl. Surf. Sci., 2008, 254, 4868–4874 CrossRef.
- S. e. Fang, D. C. W. Tsang, F. Zhou, W. Zhang and R. Qiu, Chemosphere, 2016, 149, 263–271 CrossRef PubMed.
- Q. Miao, Y. Tang, J. Xu, X. Liu, L. Xiao and Q. Chen, J. Taiwan Inst. Chem. Eng., 2013, 44, 458–465 CrossRef.
- L. Leng, X. Yuan, H. Huang, J. Shao, H. Wang, X. Chen and G. Zeng, Appl. Surf. Sci., 2015, 346, 223–231 CrossRef.
- H. Cao, Y. Xin, D. Wang and Q. Yuan, Bioresour. Technol., 2014, 172, 219–225 CrossRef PubMed.
- X. Cao and W. Harris, Bioresour. Technol., 2010, 101, 5222–5228 CrossRef PubMed.
- K. B. Cantrell, P. G. Hunt, M. Uchimiya, J. M. Novak and K. S. Ro, Bioresour. Technol., 2012, 107, 419 CrossRef PubMed.
- N. A. Qambrani, M. M. Rahman, S. Won, S. Shim and C. Ra, Renewable Sustainable Energy Rev., 2017, 79, 255–273 CrossRef.
- X. Xu, X. Cao and L. Zhao, Chemosphere, 2013, 92, 955–961 CrossRef PubMed.
- Y. Amano, Desalin. Water Treat., 2014, 52, 6420–6429 CrossRef.
- X. Xu, X. Cao, L. Zhao, H. Wang, H. Yu and B. Gao, Environ. Sci. Pollut. Res., 2013, 20, 358–368 CrossRef PubMed.
- R. K. Xu, S. C. Xiao, J. H. Yuan and A. Z. Zhao, Bioresour. Technol., 2011, 102, 10293–10298 CrossRef PubMed.
- P. Janos, S. Coskun, V. Pilarova and J. Rejnek, Bioresour. Technol., 2009, 100, 1450–1453 CrossRef PubMed.
- W. Ding, X. Dong, I. M. Ime, B. Gao and L. Q. Ma, Chemosphere, 2014, 105, 68–74 CrossRef PubMed.
- Y.-S. Shen, S.-L. Wang, Y.-M. Tzou, Y.-Y. Yan and W.-H. Kuan, Bioresour. Technol., 2012, 104, 165–172 CrossRef PubMed.
- X. D. Cao, L. Ma, B. Gao and W. Harris, Environ. Sci. Technol., 2009, 43, 3285–3291 CrossRef PubMed.
- H. Lu, W. Zhang, S. Wang, L. Zhuang, Y. Yang and R. Qiu, J. Anal. Appl. Pyrolysis, 2013, 102, 137–143 CrossRef.
- B. Yi, Q. Yuan, H. Cao, W. Niu, M. Wang, Y. Zhu and S. Yan, RSC Adv., 2018, 8, 11705–11713 RSC.
- D. Mitrogiannis, G. Markou, A. Çelekli and H. Bozkurt, J. Environ. Chem. Eng., 2015, 3, 670–680 CrossRef.
- Z. Yuan, W. Wang, J. Zhang, L. Peng and A. Wang, Chem. Eng. J., 2015, 262, 390–398 CrossRef.
- J. Fu, Z. Chen, M. Wang, S. Liu, J. Zhang, J. Zhang, R. Han and Q. Xu, Chem. Eng. J., 2015, 259, 53–61 CrossRef.
- Y. Qiu, H. Cheng, C. Xu and G. D. Sheng, Water Res., 2008, 42, 567–574 CrossRef PubMed.
- J.-H. Yuan, R.-K. Xu and H. Zhang, Bioresour. Technol., 2011, 102, 3488–3497 CrossRef PubMed.
- G. L. Dotto, J. M. N. Santos, I. L. Rodrigues, R. Rosa, F. A. Pavan and E. C. Lima, J. Colloid Interface Sci., 2015, 446, 133–140 CrossRef PubMed.
- A. M. M. Vargas, A. L. Cazetta, M. H. Kunita, T. L. Silva and V. C. Almeida, Chem. Eng. J., 2011, 168, 722–730 CrossRef.
- S. Mandal, E. Donner, S. Vasileiadis, W. Skinner, E. Smith and E. Lombi, Sci. Total Environ., 2018, 627, 942–950 CrossRef PubMed.
- M. A. M. Khraisheh, M. A. Al-Ghouti, S. J. Allen and M. N. Ahmad, Water Res., 2005, 39, 922–932 CrossRef PubMed.
- X. Tan, Y. Liu, G. Zeng, X. Wang, X. Hu, Y. Gu and Z. Yang, Chemosphere, 2015, 125, 70–85 CrossRef PubMed.
- D. Mohan, S. Rajput, V. K. Singh, P. H. Steele and C. U. Pittman, J. Hazard. Mater., 2011, 188, 319–333 CrossRef PubMed.
- S. Rangabhashiyam, N. Anu and N. Selvaraju, J. Environ. Chem. Eng., 2013, 1, 629–641 CrossRef.
- J. M. Novak, I. Lima, B. S. Xing, J. W. Gaskin, C. Steiner, K. C. Das, M. Ahmedna, D. Rehrah, D. W. Watts and W. J. Busscher, Ann. Environ. Sci., 2009, 3, 195–206 Search PubMed.
- K. Rida, S. Bouraoui and S. Hadnine, Appl. Surf. Sci., 2013, 83–84, 99–105 Search PubMed.
- H. Zhu, T. Chen, J. Liu and D. Li, RSC Adv., 2018, 8, 2616–2621 RSC.
- X. Han, W. Wang and X. Ma, Chem. Eng. J., 2011, 171, 1–8 CrossRef.
- M. Shirmardi, N. Alavi, E. C. Lima, A. Takdastan, A. H. Mahvi and A. A. Babaei, Process Saf. Environ. Prot., 2016, 103, 23–35 CrossRef.
- M. M. Hamed, I. M. Ahmed and S. S. Metwally, J. Ind. Eng. Chem., 2014, 20, 2370–2377 CrossRef.
- J. Z. Guo, B. Li, L. Liu and K. Lv, Chemosphere, 2014, 111, 225–231 CrossRef PubMed.
- S. Fan, Y. Wang, Z. Wang, J. Tang, J. Tang and X. Li, J. Environ. Chem. Eng., 2017, 5, 601–611 CrossRef.
- M. El Achaby, N. Fayoud, M. C. Figueroa-Espinoza, H. Ben youcef and A. Aboulkas, RSC Adv., 2018, 8, 5212–5224 RSC.
- H. Sheng, F. Wang, C. Gu, R. Stedtfeld, Y. Bian, G. Liu, W. Wu and X. Jiang, RSC Adv., 2018, 8, 9364–9374 RSC.
- A. Suddai, P. Nuengmatcha, P. Sricharoen, N. Limchoowong and S. Chanthai, RSC Adv., 2018, 8, 4162–4171 RSC.
- S. Fan, J. Tang, Y. Wang, H. Li, H. Zhang, J. Tang, Z. Wang and X. Li, J. Mol. Liq., 2016, 220, 432–441 CrossRef.
- L. Shi, G. Zhang, D. Wei, T. Yan, X. Xue, S. Shi and Q. Wei, J. Mol. Liq., 2014, 198, 334–340 CrossRef.
- M. S. Sajab, C. H. Chia, S. Zakaria, S. M. Jani, M. K. Ayob, K. L. Chee, P. S. Khiew and W. S. Chiu, Bioresour. Technol., 2011, 102, 7237–7243 CrossRef PubMed.
- M. E. Fernandez, G. V. Nunell, P. R. Bonelli and A. L. Cukierman, Bioresour. Technol., 2010, 101, 9500 CrossRef PubMed.
| This journal is © The Royal Society of Chemistry 2018 |

