DOI:
10.1039/C5RA04498G
(Paper)
RSC Adv., 2015,
5, 46031-46049
Synthesis, DNA/protein binding, molecular docking, DNA cleavage and in vitro anticancer activity of nickel(II) bis(thiosemicarbazone) complexes†
Received
14th March 2015
, Accepted 12th May 2015
First published on 12th May 2015
Abstract
A series of N-substituted isatin thiosemicarbazone ligands (L1–L5) and their nickel(II) complexes [Ni(L)2] (1–5) were synthesized and characterized by elemental analyses and UV-Visible, FT-IR, 1H & 13C NMR, and mass spectroscopic techniques. The molecular structure of the ligands (L1 and L2) and complex 1 was confirmed by single crystal X-ray crystallography. The single crystal X-ray structure of 1 showed distorted octahedral geometry. The interaction of calf thymus (CT) DNA and bovine serum albumin (BSA) with the nickel(II) complexes was explored using absorption and emission spectral methods. A DNA cleavage study showed that the complexes cleaved DNA without any external agents. The alterations in the secondary structure of the protein by the nickel(II) complexes (1–5) were confirmed by synchronous and three dimensional fluorescence spectroscopic studies. The interaction of the complexes with DNA/protein also has been supported by molecular docking studies. An in vitro cytotoxicity study of the complexes found significant activity against human breast (MCF7) and lung (A549) cancer cell lines, with the best results for complexes 4 and 2 respectively, where the IC50 value is less than 0.1 μM concentration.
1. Introduction
Transition metal complexes have been extensively studied as anticancer drugs because of their diverse spectral, chemical, and electrochemical properties.1–9 It is well known that DNA is an important cellular receptor. The interaction of metal complexes with DNA has recently gained much attention because it indicates that the complexes may have potential biological activity and their activity depends on the mode and affinity of the binding with DNA.10 Platinum based drugs have been in clinical use for cancer treatment for more than 30 years.11 The landmark discovery of the antitumoral properties of cisplatin by Rosenberg in 1965 heralded a new area of anticancer research based on metallopharmaceuticals.12 Although the mechanism by which cisplatin selectively kills cells is not entirely understood, it is generally believed that the therapeutic effects arise from covalent binding of the drug to DNA.13 The efficacy of cisplatin, however, is reduced by increasing tumor resistance and high toxicity. These limitations have aroused interest toward the design and evaluation of transition metal complexes other than platinum based derivatives for therapeutic use.14 Similarly, protein was also established as one of the main molecular targets in the action of anticancer agents.15 The interaction between protein and drugs provides useful information on the structural features that determine the therapeutic effectiveness of drugs and also to study the pharmacological response of drugs.16,17 Therefore interaction of the proteins with the metal complexes become important in the search of new drug molecules.
Thiosemicarbazones are a class of Schiff base compounds that contain a thiourea moiety. Thiosemicarbazones (TSCs) are versatile ligands and efficient metal chelators and due to which their coordination chemistry has been developed especially for the first row transition metals. A number of reasons have been offered as responsible for their versatility in coordination, such as intramolecular hydrogen bonding, bulkier coligand, steric crowding on the azomethine carbon atom, and π–π stacking interactions. Thiosemicarbazones usually bind to a metal ion, either in the neutral thione form (a) or in the anionic thiolate form (b), as bidentate N, S donor ligands forming five-membered chelate rings.18,19 However, incorporation of a third donor site (D) into these thiosemicarbazone ligands, linked to the carbonylic carbon via one or two intervening atoms, normally results in D, N, S tricoordination (c) (Fig. 1).18,20,21
 |
| | Fig. 1 Different coordination modes of thiosemicarbazone. | |
Thiosemicarbazones have attracted considerable attention by chemists and biologists because of their wide range of pharmacological effects such as antibacterial, antiviral, antifungal and particularly, antitumor22 and antileukemic activities. Thiosemicarbone (Triapine) has already evaluated in several clinical phase I and II trials as anticancer drug. Unfortunately it has ended with severe side effects. Therefore the search for new TSC metal complexes with pharmaceutical importance is being dealt with. In recent years, several nickel based complexes have been investigated for potential antitumor activity. Nickel is present in the active sites of several important classes of metalloproteinase, such as 2-mercaptoethanol-inhibited urease and Ni/Fe hydrogenases.23,24 Complementing its natural biochemical functions, complexes of nickel also display pharmacological potential. Nickel(II) complexes with pyrazolate ligands display cytotoxicity towards HL-60, NALM-6 (leukemia cells) and WM-115 (melanoma cells).25 Nickel complexes containing 2-phenylquinoline-4-carboxylic acid hydrazide ligand showed significant cytotoxicity against MFC cell lines and also bind DNA via a groove binding mode; further, these complexes can cleave pBR322 DNA.26 In the present work, we report the synthesis and characterization of nickel(II) complexes containing isatin based thiosemicarbazones. The interaction of the nickel(II) complexes with CT-DNA and BSA was studied using spectrophotometric methods. We have also tested the cytotoxicity of the nickel(II) complexes against MCF7 and A549 cancer cell lines. Interestingly, it was found that N-alkylation of the ligand affects the DNA/protein binding ability and cytotoxicity of the complexes.
2. Results and discussion
2.1. Synthesis and characterization
Isatin thiosemicarbazone ligands (L1–L5), were prepared by condensation of substituted isatin with 4-methyl thiosemicarbazide in the presence of glacial acetic acid (Scheme 1). The corresponding nickel(II) complexes were synthesized using [NiCl2(PPh3)2] as the metal precursor (Scheme 2). All the ligands and their nickel(II) complexes were characterized by elemental analyses and various spectroscopic techniques. The molecular structure of L1, L2 and 1 was confirmed by single crystal X-ray diffraction study.
 |
| | Scheme 1 Synthetic scheme of isatin thiosemicarbazone ligands. | |
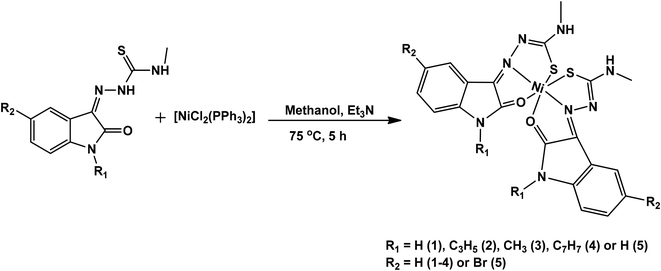 |
| | Scheme 2 Synthetic scheme of nickel(II) complexes. | |
2.2. Spectroscopy
The electronic spectra of the ligands showed two bands around 264–265 and 364–365 nm, which correspond to π–π* and n–π* transitions respectively. The spectra of the complexes exhibited three bands. Two bands appeared around 265–293 and 364–388 nm correspond to intraligand transitions. The band in the region 440–453 nm is attributed to d–d transition.27 In the FT-IR spectra of the ligands, two bands were observed for N–H groups in the range of 3469–3231 cm−1. The C![[double bond, length as m-dash]](https://www.rsc.org/images/entities/char_e001.gif) N stretching frequency of the ligands was observed at 1561–1552 cm−1. The C
N stretching frequency of the ligands was observed at 1561–1552 cm−1. The C![[double bond, length as m-dash]](https://www.rsc.org/images/entities/char_e001.gif) O and C
O and C![[double bond, length as m-dash]](https://www.rsc.org/images/entities/char_e001.gif) S stretching frequencies appeared around 1689–1682 cm−1 and 1285–1271 cm−1 respectively. On complexation there is a decrease in carbonyl, thiocarbonyl and azomethine stretching frequencies, which suggested that thiosemicarbazones coordinate to nickel(II) through sulfur, carbonyl oxygen and the azomethine nitrogen atoms.28 The observed magnetic moment lies within 1.95–2.17 BM, which is attributable to the octahedral nickel(II) center (d8, S = 1).29 On examination of the 1H NMR spectra of the ligands (L1–L5), H–N–C
S stretching frequencies appeared around 1689–1682 cm−1 and 1285–1271 cm−1 respectively. On complexation there is a decrease in carbonyl, thiocarbonyl and azomethine stretching frequencies, which suggested that thiosemicarbazones coordinate to nickel(II) through sulfur, carbonyl oxygen and the azomethine nitrogen atoms.28 The observed magnetic moment lies within 1.95–2.17 BM, which is attributable to the octahedral nickel(II) center (d8, S = 1).29 On examination of the 1H NMR spectra of the ligands (L1–L5), H–N–C![[double bond, length as m-dash]](https://www.rsc.org/images/entities/char_e001.gif) S protons resonate in the regions 12.39–12.78 and 7.57–9.26 ppm. The signal of amide N–H (L1 and L5) proton appeared at 11.29–11.10 ppm. 13C NMR spectra of the ligands showed resonances due to thiolato carbon (C
S protons resonate in the regions 12.39–12.78 and 7.57–9.26 ppm. The signal of amide N–H (L1 and L5) proton appeared at 11.29–11.10 ppm. 13C NMR spectra of the ligands showed resonances due to thiolato carbon (C![[double bond, length as m-dash]](https://www.rsc.org/images/entities/char_e001.gif) S), carbonyl carbon (C
S), carbonyl carbon (C![[double bond, length as m-dash]](https://www.rsc.org/images/entities/char_e001.gif) O) and imine carbon (C
O) and imine carbon (C![[double bond, length as m-dash]](https://www.rsc.org/images/entities/char_e001.gif) N) in the regions 178.0–179.1, 161.1–163 and 141.6–143.9 ppm respectively. Chemical shift of all other aromatic and aliphatic protons/carbons was observed in the expected regions.27
N) in the regions 178.0–179.1, 161.1–163 and 141.6–143.9 ppm respectively. Chemical shift of all other aromatic and aliphatic protons/carbons was observed in the expected regions.27
2.3. Single crystal X-ray crystallography
Thermal ellipsoid plots of ligands (L1 and L2) and complex 1 with the atomic labelling schemes are shown in the Fig. 2–4. Crystal data and selected inter atomic bond lengths and angles are given in the Tables 1–4. Yellow crystals of ligands suitable for X-ray diffraction study were obtained by slow evaporation of its ethanol solution. The five- and six-membered rings of the isatin in L1 and L2 are virtually planar. An intra-molecular hydrogen bond between the N3 proton and O1 is present in ligands L1 [N(3)–H(3)⋯O(1) = 2.721 Å] and L2 [N3–H(3)⋯O(1) = 2.738 Å], creating a six-membered ring and favoring the Z-isomer with respect to the imine C![[double bond, length as m-dash]](https://www.rsc.org/images/entities/char_e001.gif) N bond. This hydrogen bond renders the isatin and TSC (N2–N3–C9–S1–N4) moieties essentially coplanar.30 The crystal structure of L1 showed the existence of an intra-molecular hydrogen bond between sulfur and water molecule [O(1W)–H(1WA)⋯S(1) = 3.337 Å].
N bond. This hydrogen bond renders the isatin and TSC (N2–N3–C9–S1–N4) moieties essentially coplanar.30 The crystal structure of L1 showed the existence of an intra-molecular hydrogen bond between sulfur and water molecule [O(1W)–H(1WA)⋯S(1) = 3.337 Å].
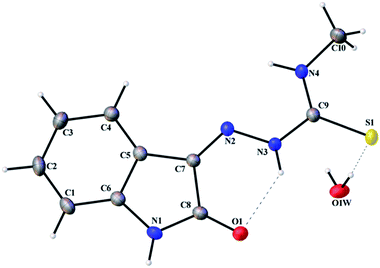 |
| | Fig. 2 Thermal ellipsoid plot of L1. | |
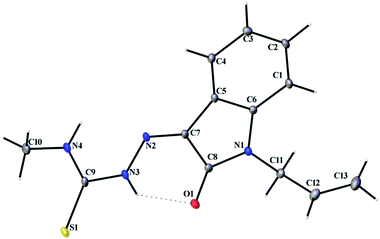 |
| | Fig. 3 Thermal ellipsoid plot of L2. | |
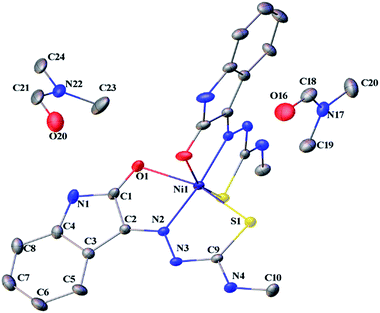 |
| | Fig. 4 Thermal ellipsoid plot of 1 (symmetry related atoms are not labelled for clarity). | |
Table 1 Crystal data and structure refinement for L1 and L2
| |
L1 |
L2 |
| Empirical formula |
C10H12N4O2S |
C13H14N4OS |
| Formula weight |
252.30 |
274.34 |
| Temperature (K) |
110(2) |
150.15 |
| Wavelength (Å) |
0.71073 |
0.71073 |
| Crystal system |
Monoclinic |
Orthorhombic |
| Space group |
Pbca |
Pbca |
![[thin space (1/6-em)]](https://www.rsc.org/images/entities/char_2009.gif) |
| Unit cell dimensions |
| a (Å) |
8.830(2) |
6.845(4) |
| b (Å) |
12.980(3) |
15.614(11) |
| c (Å) |
10.115(3) |
24.566(15) |
| α (°) |
90 |
90 |
| β (°) |
93.870(3) |
90 |
| γ (°) |
90 |
90 |
| Volume (Å3) |
1156.7(5) |
2626(3) |
| Z |
4 |
8 |
| Density (calculated) Mg m−3 |
1.449 |
1.388 |
| Absorption coefficient (mm−1) |
0.276 |
0.244 |
| F(000) |
528 |
1152 |
| Crystal size (mm3) |
0.38 × 0.32 × 0.25 |
0.15 × 0.12 × 0.08 |
| Theta range for data collection (°) |
2.312 to 27.522 |
1.658 to 27.687 |
| Index ranges |
−11 ≤ h ≤ 11 |
−8 ≤ h ≤ 8 |
| −16 ≤ k ≤ 16 |
−18 ≤ k ≤ 20 |
| −13 ≤ l ≤ 13 |
−31 ≤ l ≤ 31 |
| Reflections collected |
13![[thin space (1/6-em)]](https://www.rsc.org/images/entities/char_2009.gif) 112 112 |
19![[thin space (1/6-em)]](https://www.rsc.org/images/entities/char_2009.gif) 472 472 |
| Independent reflections [R(int)] |
2656 (0.0240) |
3019 (0.0899) |
| Completeness to theta = 25.242° |
100.0% |
99.9% |
| Absorption correction |
Semi-empirical from equivalents |
Semi-empirical from equivalents |
| Max. and min. transmission |
0.7456 and 0.6995 |
0.7456 and 0.4734 |
| Refinement method |
Full-matrix least-squares on F2 |
Full-matrix least-squares on F2 |
| Data/restraints/parameters |
2656/0/155 |
3019/0/173 |
| Goodness-of-fit on F2 |
1.046 |
1.048 |
| Final R indices [I > 2sigma(I)] |
R1 = 0.0314 |
R1 = 0.0659 |
| wR2 = 0.0789 |
wR2 = 0.1853 |
| R indices (all data) |
R1 = 0.0342 |
R1 = 0.0777 |
| wR2 = 0.0808 |
wR2 = 0.1983 |
| Largest diff. peak and hole (e Å−3) |
0.322 and −0.322 |
0.882 and −0.607 |
Table 2 Crystal data and structure refinement for 1
| |
1 |
| Empirical formula |
C29H39N11NiO5S2 |
| Formula weight |
744.54 |
| Temperature (K) |
110(2) |
| Wavelength (Å) |
0.71073 |
| Crystal system |
Monoclinic |
| Space group |
C12/c1 |
![[thin space (1/6-em)]](https://www.rsc.org/images/entities/char_2009.gif) |
| Unit cell dimensions |
| a (Å) |
19.2985(14) |
| b (Å) |
11.9741(14) |
| c (Å) |
15.3857(13) |
| α (°) |
90 |
| β (°) |
106.181(4) |
| γ (°) |
90 |
| Volume (Å3) |
3414.5(6) |
| Z |
4 |
| Density (calculated) Mg m−3 |
1.448 |
| Absorption coefficient (mm−1) |
0.746 |
| F(000) |
1560 |
| Crystal size (mm3) |
0.56 × 0.54 × 0.46 |
| Theta range for data collection (°) |
2.025 to 38.714 |
| Index ranges |
−32 ≤ h ≤ 33 |
| −20 ≤ k ≤ 20 |
| −26 ≤ l ≤ 26 |
| Reflections collected |
94![[thin space (1/6-em)]](https://www.rsc.org/images/entities/char_2009.gif) 121 121 |
| Independent reflections [R(int)] |
9435 (0.0687) |
| Completeness to theta = 25.242° |
99.9% |
| Absorption correction |
Semi-empirical from equivalents |
| Max. and min. transmission |
0.6356 and 0.5450 |
| Refinement method |
Full-matrix least-squares on F2 |
| Data/restraints/parameters |
9435/17/257 |
| Goodness-of-fit on F2 |
1.030 |
| Final R indices [I > 2sigma(I)] |
R1 = 0.0346 |
| wR2 = 0.0904 |
| R indices (all data) |
R1 = 0.0406 |
| wR2 = 0.0965 |
| Largest diff. peak and hole (e Å−3) |
0.591 and −0.797 |
Table 3 Selected bond lengths (A°) and angles (°) of ligands
| L1 |
L2 |
| S(1)–C(9) |
1.6900(13) |
S(1)–C(10) |
1.671(3) |
| O(1)–C(8) |
1.2370(16) |
O(1)–C(8) |
1.230(3) |
| N(1)–H(1) |
0.8800 |
N(1)–C(1) |
1.402(3) |
| N(1)–C(6) |
1.4094(17) |
N(1)–C(8) |
1.358(3) |
| N(1)–C(8) |
1.3457(17) |
N(1)–C(9) |
1.448(3) |
| N(2)–N(3) |
1.3562(15) |
N(2)–N(3) |
1.348(3) |
| N(2)–C(7) |
1.2886(17) |
N(2)–C(7) |
1.294(3) |
| N(3)–H(3) |
0.8800 |
N(3)–H(3) |
0.8800 |
| N(3)–C(9) |
1.3689(16) |
N(3)–C(10) |
1.369(3) |
| N(4)–H(4) |
0.8800 |
N(4)–H(4) |
0.8800 |
| N(4)–C(9) |
1.3146(17) |
N(4)–C(10) |
1.311(3) |
| N(4)–C(10) |
1.4549(17) |
N(4)–C(11) |
1.450(3) |
| O(1W)–H(1WA) |
0.8499 |
C(6)–N(1)–C(11) |
125.59(18) |
| O(1W)–H(1WB) |
0.8500 |
C(8)–N(1)–C(6) |
110.44(17) |
| C(6)–N(1)–H(1) |
124.5 |
C(8)–N(1)–C(11) |
123.97(17) |
| C(8)–N(1)–H(1) |
124.5 |
C(7)–N(2)–N(3) |
116.5(2) |
| C(8)–N(1)–C(6) |
111.02(11) |
N(2)–N(3)–H(3) |
119.7 |
| C(7)–N(2)–N(3) |
116.31(11) |
N(2)–N(3)–C(9) |
120.7(2) |
| N(2)–N(3)–H(3) |
120.0 |
C(9)–N(3)–H(3) |
119.7 |
| N(2)–N(3)–C(9) |
120.03(10) |
C(9)–N(4)–H(4) |
118.0 |
| C(9)–N(3)–H(3) |
120.0 |
C(9)–N(4)–C(10) |
124.0(2) |
| C(9)–N(4)–H(4) |
118.4 |
C(10)–N(4)–H(4) |
118.0 |
| C(9)–N(4)–C(10) |
123.12(11) |
C(1)–C(6)–N(1) |
128.1(2) |
| C(10)–N(4)–H(4) |
118.4 |
(5)–C(6)–N(1) |
109.9(2) |
| C(1)–C(6)–N(1) |
128.21(12) |
N(2)–C(7)–C(5) |
126.5(2) |
| C(5)–C(6)–N(1) |
109.71(11) |
N(2)–C(7)–C(8) |
127.2(2) |
| N(2)–C(7)–C(5) |
126.28(12) |
O(1)–C(8)–N(1) |
126.1(2) |
| N(2)–C(7)–C(8) |
127.42(12) |
O(1)–C(8)–C(7) |
127.0(2) |
| O(1)–C(8)–N(1) |
127.23(12) |
N(1)–C(8)–C(7) |
106.87(17) |
| O(1)–C(8)–C(7) |
126.14(12) |
N(3)–C(9)–S(1) |
117.70(18) |
| N(1)–C(8)–C(7) |
106.62(11) |
N(4)–C(9)–S(1) |
127.08(18) |
| N(3)–C(9)–S(1) |
117.69(9) |
N(4)–C(9)–N(3) |
115.2(2) |
| N(4)–C(9)–S(1) |
125.23(10) |
N(1)–C(11)–C(12) |
113.26(19) |
| N(4)–C(9)–N(3) |
117.08(11) |
C(13)–C(12)–C(11) |
123.3(3) |
Table 4 Selected bond lengths (A°) and angles (°) for 1a
| |
1 |
|
1 |
| Symmetry transformations used to generate equivalent atoms: #1 x, y, −z + 3/2. |
| Ni(1)–S(1) |
2.3671(3) |
N(2)–Ni(1)–S(1)#1 |
103.466(18) |
| Ni(1)–S(1)#1 |
2.3671(3) |
N(2)#1–Ni(1)–S(1)#1 |
81.231(19) |
| Ni(1)–O(1)#1 |
2.2121(7) |
N(2)–Ni(1)–S(1) |
81.231(19) |
| Ni(1)–O(1) |
2.2121(7) |
N(2)#1–Ni(1)–S(1) |
103.467(18) |
| Ni(1)–N(2) |
2.0161(7) |
N(2)–Ni(1)–O(1) |
80.77(2) |
| Ni(1)–N(2)#1 |
2.0162(6) |
N(2)#1–Ni(1)–O(1) |
94.22(2) |
| S(1)–Ni(1)–S(1)#1 |
97.074(13) |
N(2)–Ni(1)–O(1)#1 |
94.22(2) |
| O(1)#1–Ni(1)–S(1) |
89.82(2) |
N(2)#1–Ni(1)–O(1)#1 |
80.77(2) |
| O(1)–Ni(1)–S(1) |
161.785(17) |
N(2)–Ni(1)–N(2)#1 |
173.04(4) |
| O(1)–Ni(1)–S(1)#1 |
89.82(2) |
C(9)–S(1)–Ni(1) |
94.87(3) |
| O(1)#1–Ni(1)–S(1)#1 |
161.785(17) |
C(1)–O(1)–Ni(1) |
104.81(5) |
| O(1)–Ni(1)–O(1)#1 |
88.74(4) |
N(3)–N(2)–Ni(1) |
126.14(5) |
| C(2)–N(2)–Ni(1) |
113.81(5) |
|
|
Complex 1 crystallized in monoclinic C12/c1 space group with two molecules of the ligand per nickel. The nickel(II) complex adopts a distorted octahedral geometry with binding of the ligands as monobasic tridentate (ONS) donors. Two molecules of dimethyl formamide were found in the asymmetric unit. The S–Ni1 bond is longer than the O1–Ni1, and N2–Ni1 bond lengths (2.367 > 2.212 > 2.016 Å), which are in the expected range for thiosemicarbazone complexes.27 The S1–C9 bond length (1.709 Å) in 1 is higher than that of L1 (1.690 Å). There is an increase in the C–O and C–N bond lengths (involved in coordination) in 1 compared to L1. The torsional angles in 1 are 3.66 (Ni–S1–C9–N3), −176.70 (Ni–S1–C9–N4), 0.68 (Ni–N2–N3–C9), 176.68 (Ni–N2–C2–C1), 177.22 (Ni–O1–C1–N1) and 3.49° (Ni–O1–C1–C2).
2.4. DNA binding studies
2.4.1. Electronic absorption titration. The DNA binding experiments were carried out in Tris–HCl buffer (pH 7.2). The nickel(II) complexes (1, 3–5) showed absorption bands at 273–285 and 356–369 nm, which were assigned to intraligand transitions. But in complex 2 there are three absorption bands at 284, 365 and 458 nm. Upon the incremental addition of CT DNA to the complexes, the intensity of absorption decreases resulting in hypochromism (Δε, 18–37%) with a small red shift. Intercalative mode of binding due to the strong stacking interaction between an aromatic chromophore and the base pairs of DNA usually results in hypochromism along with or without a small red or blue shift.31 The extent of shift and hypochromism are normally found to correlate with the intercalative binding strength. The magnitude of hypochromism is in the order of 4 > 2 > 3 > 1 > 5, which reflects the DNA binding affinities of the complexes. The absorption spectra of the complexes (1–5) in the presence and absence of CT DNA are shown in Fig. 5 and S1.† The binding constant of the complexes with CT DNA (Kb) was obtained from the ratio of slope to intercept by plotting [DNA]/(εa − εf) versus [DNA] according to the equation32 [DNA]/(εa − εf) = [DNA]/(εb − εf) + 1/Kb(εb − εf) where [DNA] is the concentration of DNA in base pairs, εa is the apparent extinction coefficient value found by calculating A(observed)/[complex], εf is the extinction coefficient for the free compound, and εb is the extinction coefficient for the compound in the fully bound form. Each set of data, when fitted into the above equation, gave a straight line with a slope of 1/(εb − εf) and an y-intercept of 1/Kb(εb − εf) (Fig. 7). The magnitudes of intrinsic binding constants (Kb) are given in Table 5. The observed values of Kb(1.40–2.90 × 10⁴ M−1) revealed that the nickel(II) complexes bind to DNA via intercalative mode.33 Complexes 4 and 2 showed better DNA binding affinity compared to the other complexes. The enhanced binding of 4 and 2 may be due the presence of benzyl and allyl groups respectively.
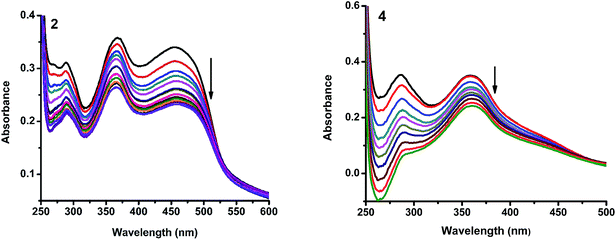 |
| | Fig. 5 Absorption spectra of complexes (2 and 4) in Tris–HCl buffer upon addition of CT DNA. [Complex] = 1.5 × 10⁻⁵ M, [DNA] = 0–50 μM. Arrow shows that the absorption intensities decrease upon increasing DNA concentration. | |
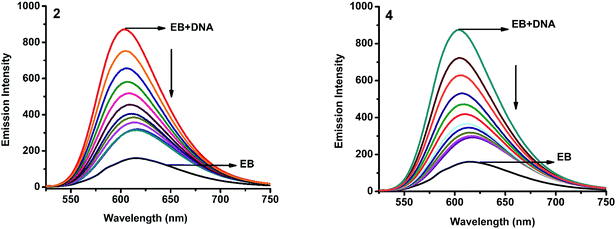 |
| | Fig. 6 Fluorescence quenching curves of EB bound to DNA in the presence of 2 and 4. [DNA] = 5 μM, [EB] = 5 μM and [complex] = 0–50 μM. | |
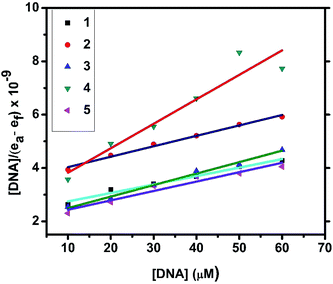 |
| | Fig. 7 Plots of [DNA]/(εa − εf) versus [DNA] for the titration of the complexes with CT DNA. | |
Table 5 DNA binding constant (Kb), Stern–Volmer constant (Kq) and the apparent binding constant (Kapp) for complexes 1–5
| Complex |
Kb (M−1) |
Kq (M−1) |
Kapp (M−1) |
| 1 |
1.60 × 10⁴ |
1.47 × 10⁵ |
4.70 × 10⁶ |
| 2 |
2.10 × 10⁴ |
1.80 × 10⁵ |
5.52 × 10⁶ |
| 3 |
1.63 × 10⁴ |
1.65 × 10⁵ |
4.97 × 10⁶ |
| 4 |
2.91 × 10⁴ |
1.99 × 10⁵ |
7.39 × 10⁶ |
| 5 |
1.40 × 10⁴ |
1.27 × 10⁵ |
4.31 × 10⁶ |
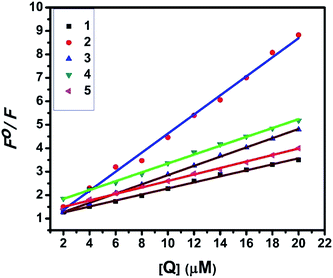
2.4.2. Fluorescence spectroscopic studies. Fluorescence property has not been observed for the complexes at room temperature in solution or in the presence of CT DNA. So the binding of the complexes with DNA could not be directly predicted through the emission spectroscopy. Hence, competitive binding study was done to understand the mode of DNA interaction with the complexes.34–36 Ethidium bromide (EB) emits intense fluorescence in the presence of CT DNA because of strong intercalation of the planar EB phenanthridine ring between adjacent base pairs in the double helix; therefore, EB has been considered as a typical indicator of intercalation.37 If another molecule which can bind to DNA more strongly than EB was added, the molecule will replace the bound EB and there was a quenching in the DNA induced EB emission. The extent of quenching of CT DNA-EB reflects the extent of interaction with the added molecule. On adding nickel(II) complexes (0–50 μM) to CT DNA-EB, the quenching in the emission of DNA bound EB takes place (Fig. 6 and S2†). Fluorescence quenching is explained by the Stern–Volmer equation38 Fo/F = 1 + Kq[Q] where Fo and F are the fluorescence intensities in the absence and presence of complex respectively, Kq is a linear Stern–Volmer quenching constant, and [Q] is the concentration of complex. The slope of the plot of Fo/F versus [Q] gave Kq (Fig. 8). The apparent DNA binding constant (Kapp) values were calculated by using the equation KEB[EB] = Kapp[complex] where [complex] is the complex concentration at 50% reduction in the fluorescence intensity of EB, KEB = 1.0 × 10⁷ M−1 and [EB] = 5 μM. The quenching constant (Kq and Kapp) values are listed in Table 5.
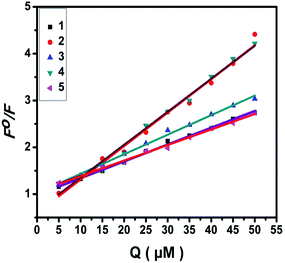 |
| | Fig. 8 Stern–Volmer plots of fluorescence titrations of the complexes with CT DNA. | |
2.4.3. CD spectral studies. Circular dichroic spectral technique gave us useful information on how the conformation of DNA was influenced by the binding of the metal complex to DNA. The observed CD spectrum of CT DNA consists of a positive band at 277 nm due to base stacking and a negative band at 245 nm due to helicity, which is characteristic of DNA in the right-handed B form. While groove binding and electrostatic interaction of small molecules with DNA show little or no perturbation on the base stacking and helicity bands, intercalation changes the intensity of both the bands. In the present case, the intensity of both the negative and positive bands changes significantly (shifting to zero levels) (Fig. 9 and S3†). This suggests that the binding of DNA with the complexes (1–5) induces certain conformational changes, such as the conversion from a more B-like to a more C-like structure within the DNA molecule.39 These changes are indicative of a non-groove mode of binding of the complexes and offer support to its intercalation mode.40
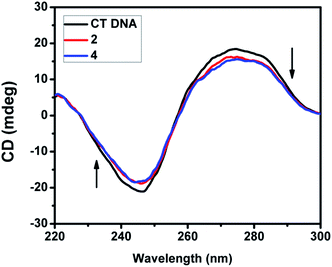 |
| | Fig. 9 CD spectra of CT DNA (200 μM) in the absence and presence of 40 μM of complex 2 and 4. | |
2.5. DNA cleavage
To explore the DNA cleavage ability of complexes (1–5), supercoiled (SC) pUC19 DNA (40 μM in base pairs) was incubated at 37 °C with the complexes (150 μM) in a 5% DMF/5 mM Tris–HCl/50 mM NaCl buffer at pH 7.2 for 3 h. Complexes (1–5) cleave SC (Form I) DNA into nicked circular (NC) (Form II) DNA without any external agents (Fig. 10), and the DNA cleavage efficiency follows the order 2 (99.8%) > 1 (99.2%) > 5 (96.5%) > 4 (14.1%) > 3 (6.6%). The study reveals that 2 cleaves DNA more efficiently than the other complexes, because of the strong partial intercalation of the allyl group.
 |
| | Fig. 10 Cleavage of supercoiled pUC19 DNA (40 μM) by complexes 1–5 in a buffer containing 5% DMF/5 mM Tris–HCl/50 mM NaCl at pH = 7.2 and 37 °C with an incubation time of 3 h. Lane 1, DNA control; lane 2, DNA + 1 (150 μM); lane 3, DNA + 2 (150 μM); lane 4, DNA + 3 (150 μM); lane 5, DNA + 4 (150 μM); lane 6, DNA + 5 (150 μM). Forms SC and NC are supercoiled and nicked circular DNA, respectively. | |
2.6. BSA interaction studies
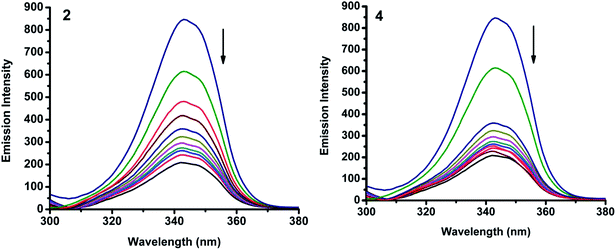
2.6.1. Absorbance and fluorescence studies. Fig. 11 and S4† show the fluorescence emission spectra of BSA after the addition of the complexes (1–5). When increasing amount of complex solution was added to a fixed quantity of BSA, there observed a decrease in the fluorescence intensity of BSA at 345 nm, upto 78.1, 89.0, 87.7, 88.3 and 79.4% with bathochromic shift of 15, 13, 12, 15 and 14 nm for complexes 1–5 respectively. The observed hypochromicity has revealed that the complexes interact hydrophobically with the BSA protein.41
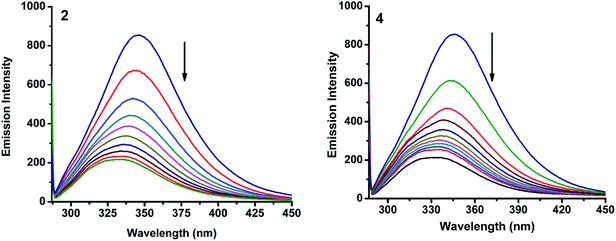 |
| | Fig. 11 Fluorescence quenching curves of BSA in the absence and presence of 2 and 4. [BSA] = 1 μM and [complex] = 0–50 μM. | |
UV-Visible absorption titration of BSA with the complexes (1–5) was done to predict the type of quenching process. Addition of the complex to BSA lead to an increase in BSA absorption intensity without affecting the position of absorption band. This indicates that the type of interaction between nickel(II) complexes and BSA was mainly a static quenching process.42 The representative absorption titration spectrum is shown in Fig. 12. The fluorescence quenching is described by the Stern–Volmer relation Fo/F = 1 + Kq[Q] where Fo and F demonstrate the fluorescence intensities in the absence and presence of quencher, respectively. Kq is a linear Stern–Volmer quenching constant, and [Q] is the quencher concentration. The quenching constant (Kq) can be calculated using the plot of log(Fo/F) versus log[Q] (Fig. 13). When small molecules bind independently to a set of equivalent site, on a macromolecule, the equilibrium between free and bound molecules is represented by the Scatchard equation43,44 log[(Fo − F)/F] = log![[thin space (1/6-em)]](https://www.rsc.org/images/entities/char_2009.gif) Kb + n
Kb + n![[thin space (1/6-em)]](https://www.rsc.org/images/entities/char_2009.gif) log[Q] where Kb is the binding constant of the complex with BSA and n is the number of binding sites. From the plot of log[(Fo − F)/F] versus log[Q] (Fig. 14), the number of binding sites (n) and the binding constant (Kb) values have been obtained. The quenching constant (Kq), binding constant (Kb) and number of binding sites (n) for the interaction of the nickel(II) complexes with BSA are shown in Table 6. In all the complexes, only one binding site is available to interact with BSA. Results showed that complexes 2, 4 and 1 interact strongly with BSA compared to 3 and 5.
log[Q] where Kb is the binding constant of the complex with BSA and n is the number of binding sites. From the plot of log[(Fo − F)/F] versus log[Q] (Fig. 14), the number of binding sites (n) and the binding constant (Kb) values have been obtained. The quenching constant (Kq), binding constant (Kb) and number of binding sites (n) for the interaction of the nickel(II) complexes with BSA are shown in Table 6. In all the complexes, only one binding site is available to interact with BSA. Results showed that complexes 2, 4 and 1 interact strongly with BSA compared to 3 and 5.
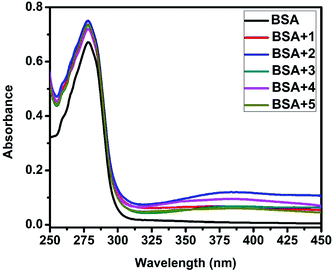 |
| | Fig. 12 The absorption spectra of BSA (10 μM) and BSA with 1–5 (4 μM). | |
 |
| | Fig. 13 Stern–Volmer plots of the fluorescence titrations of the complexes with BSA. | |
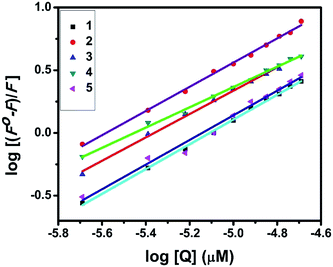 |
| | Fig. 14 Scatchard plots of the fluorescence titrations of the complexes with BSA. | |
Table 6 Protein binding constant (Kb), quenching constant (Kq) and number of binding sites (n) for complexes 1–5
| Complex |
Kb (M−1) |
Kq (M−1) |
N |
| 1 |
2.40 × 10⁶ |
1.43 × 10⁵ |
0.91 |
| 2 |
2.67 × 10⁷ |
2.38 × 10⁵ |
1.31 |
| 3 |
4.97 × 10⁶ |
1.90 × 10⁵ |
1.06 |
| 4 |
2.14 × 10⁷ |
1.97 × 10⁵ |
1.13 |
| 5 |
4.04 × 10⁶ |
1.60 × 10⁵ |
0.96 |
2.6.2. Characteristics of synchronous fluorescence spectra. To obtain reasonable information on the molecular microenvironment, particularly in the vicinity of the fluorophore functional groups, the structural changes occurring to BSA upon the addition of the new complexes were studied through synchronous fluorescence spectra.45 It is well known that the fluorescence of BSA is normally due to the presence of tyrosine, tryptophan and phenylalanine residues and hence spectroscopic methods are usually applied to study the conformation of serum protein. The difference between the excitation and emission wavelength (Δλ) reflects the nature of the chromophore.46 The large Δλ value, such as 60 nm, is characteristic of tryptophan residue and a small Δλ value, such as 15 nm, is characteristic of tyrosine. The synchronous fluorescence spectra of BSA with various concentrations of nickel(II) complexes (1–5) were recorded at Δλ = 15 nm and Δλ = 60 nm. On addition of the complexes, the fluorescence intensity of tryptophan residue at 340 nm decreased in the magnitude of 73.5, 86.2, 81.7, 84.0 and 73.9% for complexes 1–5 respectively (Fig. 15 and S5†). Similarly, there was also decrease in the intensity of tyrosine residue at 300 nm. The magnitude of decrease was 75.4, 89.4, 83.4, 88.1 and 77.7% for complexes 1–5 respectively (Fig. 16 and S6†). The synchronous fluorescence spectral studies clearly suggested that the fluorescence intensities of both the tryptophan and tyrosine were affected with increasing concentration of the complexes. The results indicate that the interaction of the complexes with BSA affects the conformation of both tryptophan and tyrosine micro-regions.47
 |
| | Fig. 15 Synchronous spectra of BSA (1 μM) as a function of concentration of 2 and 4 (0–50 μM) with Δλ = 60 nm. | |
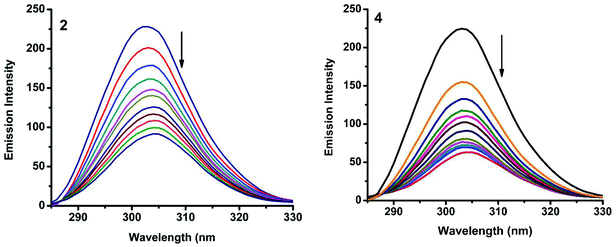 |
| | Fig. 16 Synchronous spectra of BSA (1 μM) as a function of concentration of 2 and 4 (0–50 μM) with Δλ = 15 nm. | |
2.6.3. 3D fluorescence spectra. Application of three-dimensional fluorescence technique is seen in recent years for the investigation of conformational changes of proteins interacting with drugs.48 The excitation wavelength, emission wavelength and fluorescence intensity can be used as axes in the fluorescence emission spectra. The maximum emission wavelength and fluorescence intensity of the residues showed a close relation to the polarity of their microenvironment. The three dimensional fluorescence spectra and the corresponding contour diagrams for BSA, BSA-2, and BSA-4 are shown in Fig. 23 and for BSA-1, BSA-3 and BSA-5 are shown in Fig. S9.† Two typical fluorescence peaks 1 and 2 were observed. Among these two, peak 2 mainly revealed the spectral characteristics of tryptophan and tyrosine residues. The reason is that, when protein is excited at 280 nm, it mainly reveals the intrinsic fluorescence of tryptophan and tyrosine residues. The excitation wavelength of peak 1 was noticed at 240 nm which was mainly attributed to the n–π* transition of protein's characteristic polypeptide backbone structure, C![[double bond, length as m-dash]](https://www.rsc.org/images/entities/char_e001.gif) O.49 The results showed that the three-dimensional fluorescence contour map of protein and protein-(1–5) was clearly different. From Fig. 17 and S7,† it is clear that the fluorescence intensities of peak 2 decreased significantly in the presence of complexes (1–5) indicating the quenching of fluorescence of BSA by the complexes. The results shown in Table 7 indicated the conformational changes of BSA upon interaction with the complexes.50
O.49 The results showed that the three-dimensional fluorescence contour map of protein and protein-(1–5) was clearly different. From Fig. 17 and S7,† it is clear that the fluorescence intensities of peak 2 decreased significantly in the presence of complexes (1–5) indicating the quenching of fluorescence of BSA by the complexes. The results shown in Table 7 indicated the conformational changes of BSA upon interaction with the complexes.50
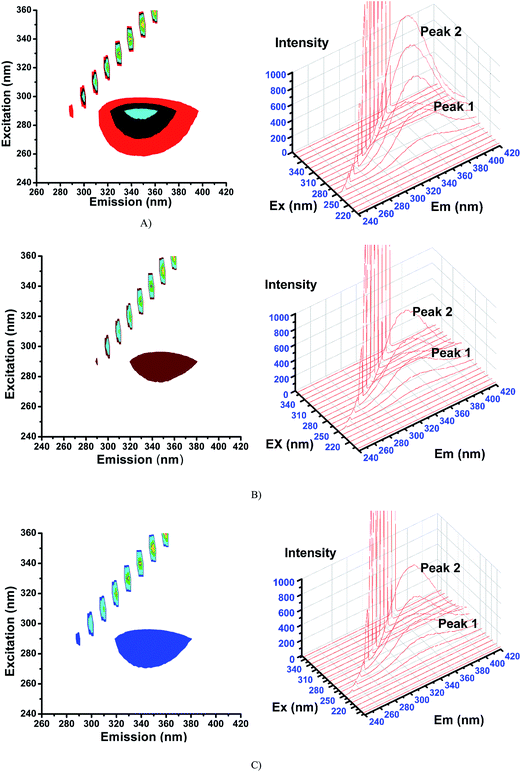 |
| | Fig. 17 3D fluorescence spectra for (A) BSA, (B) BSA-2 and (C) BSA-4. | |
Table 7 3D fluorescence spectral characteristics of BSA and BSA with complexes (1–5)
| System |
Peak 2 λex/λem |
Δλ |
Intensity |
| BSA |
280/340 |
60 |
1000 |
| BSA-1 |
280/330 |
50 |
521 |
| BSA-2 |
280/337 |
57 |
389 |
| BSA-3 |
280/333 |
53 |
503 |
| BSA-4 |
280/335 |
55 |
400 |
| BSA-5 |
280/330 |
50 |
516 |
2.7. Molecular docking
2.7.1. Molecular docking studies with DNA. Computational docking is extremely useful tool to gain an understanding of synthesized compounds and biological drug target interactions which is very important in drug discovery. In our study, the synthesized nickel(II) complexes were subjected to molecular docking studies using the AutoDock Tools (ADT) version 1.5.6 and AutoDock version 4.2.5.1 docking programs, which are interactive molecular graphics programs, to understand the drug–DNA interactions to investigate the potential binding mode and energy.Docked ligand conformation was analyzed in terms of energy, hydrogen bonding, and hydrophobic interaction between synthesized nickel complexes and B-DNA (PDB ID: 1BNA). Detailed analyses of the complex–DNA interactions were carried out, and final coordinates of the complex and receptor were saved. From the docking scores, the free energy of binding (FEB) of the compound was calculated and details were shown in Table 8.
Table 8 The calculated free energy of binding of the nickel(II) complexes with B-DNA (1BNA)
| Complex |
Free energy of bindinga (kcal mol−1) |
| B-DNA (PDB ID: 1BNA) |
| Calculated by Autodock. |
| 1 |
−8.71 |
| 2 |
−7.26 |
| 3 |
−7.34 |
| 4 |
−7.77 |
| 5 |
−9.05 |
In silico molecular docking experiment reveals that the docked complexes fit into the DNA comfortably involving van der Waals interaction, hydrophobic and hydrogen bonding contacts with DNA functional groups, resulted in the binding energy between −7.26 and −9.05 kcal mol−1. Binding interactions of all the nickel(II) complexes with the B-DNA receptor are shown in the Fig. 18 and S8.†
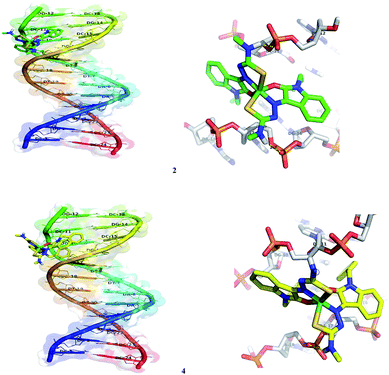 |
| | Fig. 18 Docking pose of nickel(II) complexes 2 and 4 with B-DNA (1BNA). | |
Nickel(II) complexes (1–5) show the binding energy value of −8.71, −7.26, −7.34, −7.77 and −9.05 kcal mol−1 with four, two, two, one and six hydrogen bonds respectively, with the docked DNA receptor. Among all the complexes docked, 5 shows the highest binding energy value of −9.05 kcal mol−1 with six hydrogen bonds with the docked DNA receptor. In complex 5, one of the methyl attached N–H interacts with the two oxygens of phosphate of DC-21 and forms two hydrogen bonds with the bond length of 2.2 and 2.4 Å. Also, another methyl attached N–H interacts with the phosphate of DA-6 and forms a hydrogen bond with the bond length of 1.9 Å. Furthermore, one of the oxindole N–H interacts with the oxygen of sugar moiety of DT-7 and nitrogen of base moiety of DA-6 and forms two hydrogen bonds with the bond length of 2.4 and 2.4 Å respectively. Another oxindole N–H interacts with the C![[double bond, length as m-dash]](https://www.rsc.org/images/entities/char_e001.gif) O of base moiety of DT-21 and forms a hydrogen bond with the bond length of 2.0 Å.
O of base moiety of DT-21 and forms a hydrogen bond with the bond length of 2.0 Å.
2.7.2. Molecular docking studies with human DNA topoisomerase I. All the nickel(II) complexes were also subjected to molecular docking studies with human DNA topoisomerase I using the AutoDock Tools (ADT) version 1.5.6 and AutoDock version 4.2.5.1. The X-ray crystallographic structure of the human-DNA–topoisomerase I complex (PDB ID: 1SC7) was retrieved from Protein Data Bank in which Topo-I is bound to the oligonucleotide sequence 50-AAAAAGACTTsX-GAAAATTTTT-30 where ‘s’ is 50-bridging phosphorothiolate of the cleaved strand and ‘X’ represents any of the four bases A, G, C or T. The SH of G11 on the scissile strand was changed to OH and phosphoester bond of G12 in 1SC7 was rebuilt.51 The calculated free energy of binding (FEB) of the nickel(II) complexes with DNA–topoisomerase I complex is shown in Table 9.
Table 9 The calculated free energy of binding of the complexes with DNA–topoisomerase I (1SC7)
| Complex |
Free energy of bindinga (kcal mol−1) |
| DNA–topoisomerase-I complex (PDB ID: 1SC7) |
| Calculated by Autodock. |
| 1 |
−8.22 |
| 2 |
−9.12 |
| 3 |
−8.93 |
| 4 |
−9.86 |
| 5 |
−6.93 |
The molecular docking result revealed that all the complexes approach towards the DNA cleavage site in the DNA–topoisomerase I and forming a stable complex through non-covalent interactions like hydrogen bonding, hydrophobic and van der Waals interactions, results in the binding energy between −6.93 and −9.86 kcal mol−1, subsequently leading to inhibitory effect on DNA–topoisomerase I. Binding interactions of the complexes with the DNA–topoisomerase I receptor are shown in Fig. 19 and S9.†
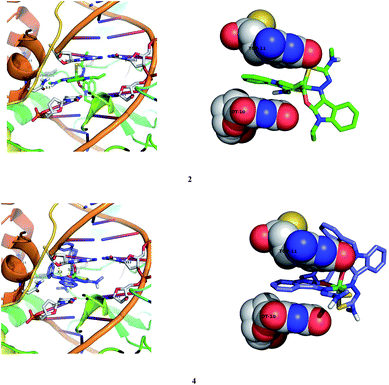 |
| | Fig. 19 Docking pose of nickel(II) complexes 2 and 4 with DNA–topoisomerase I (1SC7). | |
2.7.3. Molecular docking studies with human protein. Molecular docking technique is an attractive scaffold to understand the ligand–protein interactions which can substantiate our experimental results. The GOLD scores of the individual complexes corresponding to different poses have been tabulated and the highest score for each of the complexes is shown in Table 10. Complex 4 has the highest score followed by 2 predicting the formation of stable complex between protein (3V03) and the complexes. Complex 1 could be considered as favourable based on their scores and number of poses generated. However 1 and 5 could generate only three possible poses unlike the others generating 10 poses each. Binding interaction of the complexes with the RCSB protein is shown in Fig. 20 and S10.†
Table 10 Docking GOLD fitness docking scores of the nickel(II) complexes with protein
| Pose |
GOLD scores |
| 1 |
2 |
3 |
4 |
5 |
| 1 |
54.1480 |
54.7552 |
51.8185 |
50.9762 |
53.3721 |
| 2 |
56.3824 |
49.4782 |
49.3571 |
53.7028 |
51.5028 |
| 3 |
55.3612 |
51.9732 |
43.8251 |
54.1686 |
52.8971 |
| 4 |
|
55.7041 |
53.4269 |
49.6122 |
|
| 5 |
|
48.0644 |
52.7515 |
52.3080 |
|
| 6 |
|
57.4235 |
48.1266 |
59.0145 |
|
| 7 |
|
53.0804 |
49.7636 |
53.0551 |
|
| 8 |
|
53.3063 |
49.4089 |
56.0072 |
|
| 9 |
|
56.2912 |
50.2272 |
64.3944 |
|
| 10 |
|
40.5887 |
46.8547 |
61.7232 |
|
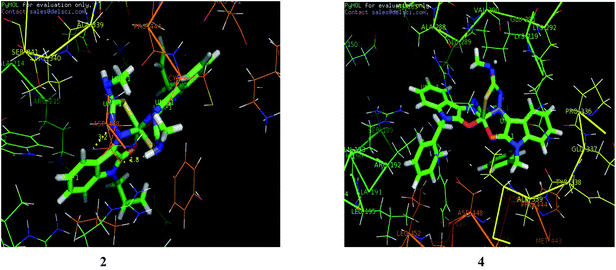 |
| | Fig. 20 Docking pose of nickel(II) complexes 2 and 4 with protein (3V03). | |
After docking, the docked complexes corresponding to the highest scores for each complex were imported as.pdb files into PyMOL software for evaluating the hydrogen bonds formed. It is found that many N–H⋯O bonds are formed between the complexes and the protein (Table 11). The main residues involved in the interactions are Arg 215, Val 290 and Asp 448. It is found that complex 1 formed the maximum number of hydrogen bonds. The complexes 2, 3 and 5 also involved in hydrogen bond interaction with Asp 448 and Arg 215. But complex 4 with highest GOLD score shows no hydrogen bond formation.
Table 11 Hydrogen bond interactions for complexes (1–5)
| Complex |
Bonds formed |
Bond distance (A°) |
| 1 |
N–H⋯O (Val 290) |
2.6 |
| N–H⋯O (Asp 448) |
2.3 |
| N–H⋯O (Arg 215) |
2.1 |
| 2 & 3 |
N–H⋯O (Asp 448) |
1.8 |
| 5 |
N–H⋯O (Arg 215) |
2.2 |
| 4 |
No bonds formed |
|
2.8. Cytotoxicity
All the nickel(II) complexes have been tested for their in vitro cytotoxicity against human breast (MCF7) and human lung (A549) cancer cell lines using sulforhodamine B (SRB) assay. Results were expressed as IC50 values and were compared with adriamycin (positive control) [IC50 < 0.1 μM for MCF7 and A549 under identical conditions] (Table 12). Fig. 21–24 show the cytotoxicity of the complexes (1–5) after 24 h incubation on MCF7 and A549 cancer cell lines. Complexes 4 and 2 showed excellent cytotoxicity (<0.1 μM) against MCF7 and A549 cancer cell lines respectively. All the other complexes showed significant activity. The calculated IC50 values were in the range of 14.9–48.9 μM for the other complexes (1–3, 5) against MCF7 cell lines. The complexes (1, 3–5) showed the IC50 value in the range of 5.7 to 29.3 μM against A549 cell lines. Higher cytotoxicity of 4 and 2 is in line with their DNA and protein binding abilities.
Table 12 In vitro cytotoxic studies of Ni(II) complexes against MCF7 and A549 cancer cell lines
| Complex |
IC50 |
| MCF7 (μM) |
A549 (μM) |
| 1 |
20.8 |
18.4 |
| 2 |
14.9 |
<0.1 |
| 3 |
29.3 |
5.7 |
| 4 |
<0.1 |
11.5 |
| 5 |
48.9 |
29.3 |
| Adriamycin |
<0.1 |
<0.1 |
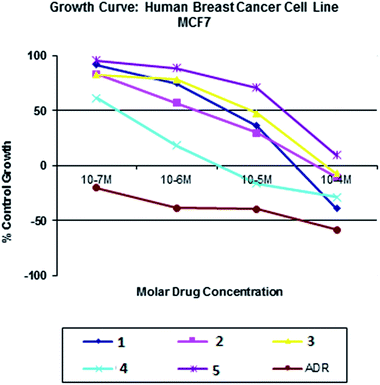 |
| | Fig. 21 Cytotoxicity of complexes 1–5 after 24 h incubation on MCF7 cell lines. | |
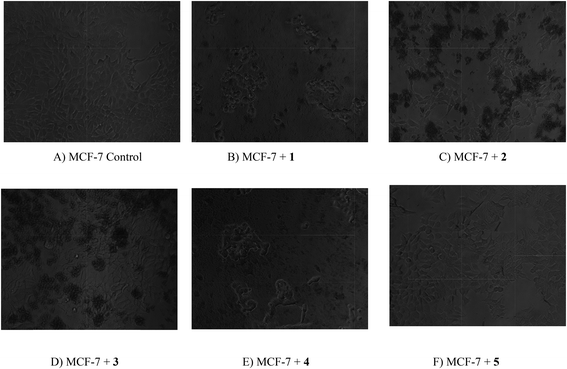 |
| | Fig. 22 Digital images of MCF-7 cell line and drug treated cells. The cancer cell lines were treated with complexes (1–5). (A) MCF-7 cancer cells (control) (B) MCF-7 cancer cells treated with 1 (C) MCF-7 cancer cells treated with 2 (D) MCF-7 cancer cells treated with 3 (E) MCF-7 cancer cells treated with 4 (F) MCF-7 cancer cells treated with 5. | |
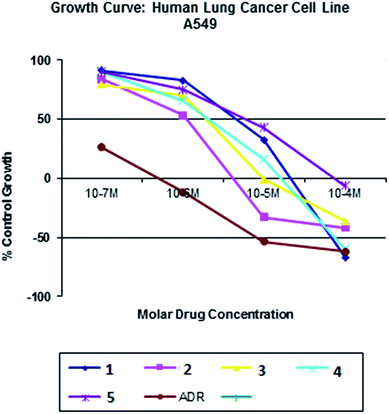 |
| | Fig. 23 Cytotoxicity of complexes 1–5 after 24 h incubation on A549 cancer cell lines. | |
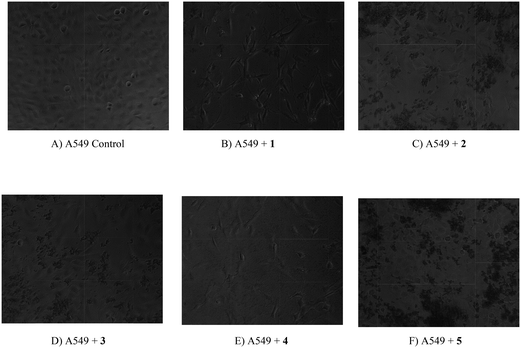 |
| | Fig. 24 Digital images of A549 cell line and drug treated cells. The cancer cell lines were treated with complexes (1–5). (A) A549 cancer cells (control) (B) A549 cancer cells treated with 1 (C) A549 cancer cells treated with 2 (D) A549 cancer cells treated with 3 (E) A549 cancer cells treated with 4 (F) A549 cancer cells treated with 5. | |
3. Conclusion
Five nickel(II) complexes with N-alkylated isatin based thiosemicarbazone ligands have been synthesized and characterized. The coordination geometry around nickel(II) is described as distorted octahedral. The DNA binding affinity of the complexes was revealed using spectrophotometric methods. The results supported the interaction of the complexes with CT DNA through intercalation. Complexes 2 and 1 have better DNA cleaving ability compared to the other complexes. According to the results of the fluorescence quenching experiments of BSA, we conclude that the complexes have binding affinity in static mode. In addition, the synchronous and 3D fluorescence spectral investigations revealed that the complexes induced a small change in the secondary structure of the protein at the studied conditions. The molecular docking studies also confirmed the interaction of the complexes with DNA and protein. In vitro cytotoxicity results showed that the complexes 4 and 2 exhibit remarkable cytotoxicity against MCF7 and A549 cancer cell lines respectively. All the other complexes showed significant activity which is comparable with the adriamycin drug.
4. Experimental
4.1. Materials and methods
All the chemicals were purchased from Sigma Aldrich/Merck and used as received. Solvents were purified according to the standard procedures. The melting points were determined on Lab India instrument and are uncorrected. The elemental analyses were performed using a Vario EL-III CHNS analyzer. Magnetic susceptibilities were measured using Sherwood scientific auto magnetic susceptibility balance. FT-IR spectra were obtained as KBr pellets using a Nicolet-iS5 spectrophotometer. UV-Visible spectra were recorded using a Shimadzu-2600 spectrophotometer. Emission spectra were measured on a Jasco V-630 spectrophotometer using 5% DMF in buffer as the solvent. NMR spectra were recorded in DMSO-d6 or CDCl3 by using TMS as an internal standard on a Bruker 400 MHz spectrometer.
4.2. Synthesis of isatin thiosemicarbazones (L1–L5)
The isatin based thiosemicarbazone ligands were synthesized using the standard procedure.52 4-Methyl thiosemicarbazide (1 mmol) and substituted isatin (1 mmol) were suspended in ethanol (20 mL) containing a few drops of glacial acetic acid. The mixture was refluxed for 3 h and cooled to room temperature. The yellow product formed was filtered off, washed with cold ethanol and ether, and dried in vacuo. It was recrystallized from ethanol to get crystals of the title compounds.
4.2.1. (Z)-N-Methyl-2-(2-oxoindolin-3-ylidene)hydrazinecarbothioamide (L1). 4-Methyl thiosemicarbazide (0.105 g, 0.001 mol) and isatin (0.147 g, 0.001 mol) were used. Yield: 91%. Yellow. m.p.: 151 °C. Anal. calc. for C10H10N4OS (%): C, 51.27; H, 4.30; N, 23.91; S, 13.69. Found: C, 51.35; H, 4.25; N, 23.67; S, 13.61. UV-Vis (CH3OH): λmax, nm (ε, dm3 mol−1 cm−1) 265 (21![[thin space (1/6-em)]](https://www.rsc.org/images/entities/char_2009.gif) 300), 364 (16
300), 364 (16![[thin space (1/6-em)]](https://www.rsc.org/images/entities/char_2009.gif) 600). FT-IR (KBr): ν, cm−1 3469, 3420, 3236 (N–H), 1689 (C
600). FT-IR (KBr): ν, cm−1 3469, 3420, 3236 (N–H), 1689 (C![[double bond, length as m-dash]](https://www.rsc.org/images/entities/char_e001.gif) O), 1557 (C
O), 1557 (C![[double bond, length as m-dash]](https://www.rsc.org/images/entities/char_e001.gif) N), 1274 (C
N), 1274 (C![[double bond, length as m-dash]](https://www.rsc.org/images/entities/char_e001.gif) S). 1H NMR (400 MHz, DMSO-d6): δ, ppm 12.59 (s, 1H), 11.10 (s, 1H), 9.09–9.08 (d, J = 4.0 Hz, 1H), 7.62–7.60 (d, J = 8.0 Hz, 1H), 7.29–7.26 (t, J = 8.0 Hz, 1H), 7.04–7.00 (t, J = 8.0 Hz, 1H), 6.90–6.88 (d, J = 8.0 Hz, 1H), 3.09–3.08 (d, J = 4.0 Hz, 3H). 13C NMR (100 MHz, DMSO-d6): δ, ppm 178.2 (C
S). 1H NMR (400 MHz, DMSO-d6): δ, ppm 12.59 (s, 1H), 11.10 (s, 1H), 9.09–9.08 (d, J = 4.0 Hz, 1H), 7.62–7.60 (d, J = 8.0 Hz, 1H), 7.29–7.26 (t, J = 8.0 Hz, 1H), 7.04–7.00 (t, J = 8.0 Hz, 1H), 6.90–6.88 (d, J = 8.0 Hz, 1H), 3.09–3.08 (d, J = 4.0 Hz, 3H). 13C NMR (100 MHz, DMSO-d6): δ, ppm 178.2 (C![[double bond, length as m-dash]](https://www.rsc.org/images/entities/char_e001.gif) S), 163.0 (C
S), 163.0 (C![[double bond, length as m-dash]](https://www.rsc.org/images/entities/char_e001.gif) O), 142.5 (C
O), 142.5 (C![[double bond, length as m-dash]](https://www.rsc.org/images/entities/char_e001.gif) N), 131.8, 131.3, 122.6, 121.1, 111.4 (aromatic C), 31.6 (aliphatic C). ESI-MS m/z = 234.38 [M]+.
N), 131.8, 131.3, 122.6, 121.1, 111.4 (aromatic C), 31.6 (aliphatic C). ESI-MS m/z = 234.38 [M]+.
4.2.2. (Z)-2-(1-Allyl-2-oxoindolin-3-ylidene)-N-methylhydrazinecarbothioamide (L2). 4-Methyl thiosemicarbazide (0.105 g, 0.001 mol) and allyl isatin (0.187 g, 0.001 mol) were used. Yield: 89%. Yellow. m.p.: 163 °C. Anal. calc. for C13H14N4OS (%): C, 56.91; H, 5.14; N, 20.42; S, 11.69. Found: C, 56.84; H, 5.01; N, 20.33; S, 11.61. UV-Vis (CH3OH): λmax, nm (ε, dm3 mol−1 cm−1) 265 (35![[thin space (1/6-em)]](https://www.rsc.org/images/entities/char_2009.gif) 800), 365 (62
800), 365 (62![[thin space (1/6-em)]](https://www.rsc.org/images/entities/char_2009.gif) 000). FT-IR (KBr): ν, cm−1 3465, 3232 (N–H), 1682 (C
000). FT-IR (KBr): ν, cm−1 3465, 3232 (N–H), 1682 (C![[double bond, length as m-dash]](https://www.rsc.org/images/entities/char_e001.gif) O), 1555 (C
O), 1555 (C![[double bond, length as m-dash]](https://www.rsc.org/images/entities/char_e001.gif) N), 1285 (C
N), 1285 (C![[double bond, length as m-dash]](https://www.rsc.org/images/entities/char_e001.gif) S). 1H NMR (400 MHz, CDCl3): δ, ppm 12.78 (s, 1H), 7.82 (s, 1H), 7.59–7.57 (d, J = 8.0 Hz, 1H), 7.37–7.33 (m, 1H), 7.12–7.08 (t, J = 8.0 Hz, 1H), 6.89–6.87 (d, J = 8.0 Hz, 1H), 5.89–5.80 (m, 1H), 5.28–5.27 (d, J = 4.0 Hz, 1H), 5.248–5240 (t, J = 1.6 Hz, 1H), 4.39–4.37 (d, J = 8.0 Hz, 1H), 3.30–3.29 (d, J = 4.0 Hz, 3H). 13C NMR (100 MHz, CDCl3): δ, ppm 179.1 (C
S). 1H NMR (400 MHz, CDCl3): δ, ppm 12.78 (s, 1H), 7.82 (s, 1H), 7.59–7.57 (d, J = 8.0 Hz, 1H), 7.37–7.33 (m, 1H), 7.12–7.08 (t, J = 8.0 Hz, 1H), 6.89–6.87 (d, J = 8.0 Hz, 1H), 5.89–5.80 (m, 1H), 5.28–5.27 (d, J = 4.0 Hz, 1H), 5.248–5240 (t, J = 1.6 Hz, 1H), 4.39–4.37 (d, J = 8.0 Hz, 1H), 3.30–3.29 (d, J = 4.0 Hz, 3H). 13C NMR (100 MHz, CDCl3): δ, ppm 179.1 (C![[double bond, length as m-dash]](https://www.rsc.org/images/entities/char_e001.gif) S), 161.1 (C
S), 161.1 (C![[double bond, length as m-dash]](https://www.rsc.org/images/entities/char_e001.gif) O), 143.2 (C
O), 143.2 (C![[double bond, length as m-dash]](https://www.rsc.org/images/entities/char_e001.gif) N), 132.1, 131.1, 123.2, 120.6, 118.8, 117.4, 110.0 (aromatic C), 42.1, 31.4 (aliphatic C). ESI-MS m/z = 297.11 [M + Na]+.
N), 132.1, 131.1, 123.2, 120.6, 118.8, 117.4, 110.0 (aromatic C), 42.1, 31.4 (aliphatic C). ESI-MS m/z = 297.11 [M + Na]+.
4.2.3. (Z)-N-Methyl-2-(1-methyl-2-oxoindolin-3-ylidene)hydrazinecarbothioamide (L3). 4-Methyl thiosemicarbazide (0.105 g, 0.001 mol) and methyl isatin (0.161 g, 0.001 mol) were used. Yield: 90%. Yellow. m.p.: 157 °C. Anal. calc. C11H12N4OS (%): C, 53.21; H, 4.87; N, 22.56; S, 12.91. Found: C, 53.11; H, 4.76; N, 22.65; S, 12.82. UV-Vis (CH3OH): λmax, nm (ε, dm3 mol−1 cm−1) 265 (6200), 364 (35![[thin space (1/6-em)]](https://www.rsc.org/images/entities/char_2009.gif) 800). FT-IR (KBr): ν, cm−1 3458, 3227 (N–H), 1680 (C
800). FT-IR (KBr): ν, cm−1 3458, 3227 (N–H), 1680 (C![[double bond, length as m-dash]](https://www.rsc.org/images/entities/char_e001.gif) O), 1552 (C
O), 1552 (C![[double bond, length as m-dash]](https://www.rsc.org/images/entities/char_e001.gif) N), 1285 (C
N), 1285 (C![[double bond, length as m-dash]](https://www.rsc.org/images/entities/char_e001.gif) S). 1H NMR (400 MHz, DMSO-d6): δ, ppm 12.51 (s, 1H), 9.27–9.26 (d, J = 4.0 Hz, 1H), 7.66–7.64 (d, J = 8.0 Hz, 1H), 7.45–7.41 (t, J = 8.0 Hz, 1H), 7.17–7.10 (m, 2H), 3.20 (s, 3H), 3.09–3.08 (d, J = 4.0 Hz, 3H). 13C NMR (100 MHz, DMSO-d6): δ, ppm 178.0 (C
S). 1H NMR (400 MHz, DMSO-d6): δ, ppm 12.51 (s, 1H), 9.27–9.26 (d, J = 4.0 Hz, 1H), 7.66–7.64 (d, J = 8.0 Hz, 1H), 7.45–7.41 (t, J = 8.0 Hz, 1H), 7.17–7.10 (m, 2H), 3.20 (s, 3H), 3.09–3.08 (d, J = 4.0 Hz, 3H). 13C NMR (100 MHz, DMSO-d6): δ, ppm 178.0 (C![[double bond, length as m-dash]](https://www.rsc.org/images/entities/char_e001.gif) S), 161.2 (C
S), 161.2 (C![[double bond, length as m-dash]](https://www.rsc.org/images/entities/char_e001.gif) O), 143.9 (C
O), 143.9 (C![[double bond, length as m-dash]](https://www.rsc.org/images/entities/char_e001.gif) N), 131.5, 131.2, 123.3, 120.8, 119.6, 110.2 (aromatic C), 31.8, 26.1 (aliphatic C). ESI-MS m/z = 249.25 [M + H]+.
N), 131.5, 131.2, 123.3, 120.8, 119.6, 110.2 (aromatic C), 31.8, 26.1 (aliphatic C). ESI-MS m/z = 249.25 [M + H]+.
4.2.4. (Z)-2-(1-Benzyl-2-oxoindolin-3-ylidene)-N-methylhydrazinecarbothioamide (L4). 4-Methyl thiosemicarbazide (0.105 g, 0.001 mol) and benzyl isatin (0.237 g, 0.001 mol) were used. Yield: 87%. Yellow. m.p.: 177 °C. Anal. calc. C17H16N4OS (%): C, 62.94; H, 4.97; N, 17.27; S, 9.88. Found: C, 62.84; H, 4.90; N, 17.40; S, 9.81. UV-Vis (CH3OH): λmax, nm (ε, dm3 mol−1 cm−1) 264 (17![[thin space (1/6-em)]](https://www.rsc.org/images/entities/char_2009.gif) 300), 364 (24
300), 364 (24![[thin space (1/6-em)]](https://www.rsc.org/images/entities/char_2009.gif) 800). FT-IR (KBr): ν, cm−1 3463, 3231 (N–H), 1689 (C
800). FT-IR (KBr): ν, cm−1 3463, 3231 (N–H), 1689 (C![[double bond, length as m-dash]](https://www.rsc.org/images/entities/char_e001.gif) O), 1561 (C
O), 1561 (C![[double bond, length as m-dash]](https://www.rsc.org/images/entities/char_e001.gif) N), 1271 (C
N), 1271 (C![[double bond, length as m-dash]](https://www.rsc.org/images/entities/char_e001.gif) S). 1H NMR (400 MHz, DMSO-d6): δ, ppm 12.54 (s, 1H), 9.34–9.33 (d, J = 4.0 Hz, 1H), 7.71–7.69 (d, J = 8.0 Hz, 1H), 7.37–7.26 (m, 6H), 7.17–7.13 (t, J = 8.0 Hz, 1H), 7.04–7.02 (d, J = 8.0 Hz, 1H), 4.90 (s. 2H), 3.11–3.10 (d, J = 4.0 Hz, 3H). 13C NMR (100 MHz, DMSO-d6): δ, ppm 178.1 (C
S). 1H NMR (400 MHz, DMSO-d6): δ, ppm 12.54 (s, 1H), 9.34–9.33 (d, J = 4.0 Hz, 1H), 7.71–7.69 (d, J = 8.0 Hz, 1H), 7.37–7.26 (m, 6H), 7.17–7.13 (t, J = 8.0 Hz, 1H), 7.04–7.02 (d, J = 8.0 Hz, 1H), 4.90 (s. 2H), 3.11–3.10 (d, J = 4.0 Hz, 3H). 13C NMR (100 MHz, DMSO-d6): δ, ppm 178.1 (C![[double bond, length as m-dash]](https://www.rsc.org/images/entities/char_e001.gif) S), 161.2 (C
S), 161.2 (C![[double bond, length as m-dash]](https://www.rsc.org/images/entities/char_e001.gif) O), 142.8 (C
O), 142.8 (C![[double bond, length as m-dash]](https://www.rsc.org/images/entities/char_e001.gif) N), 136.1, 131.4, 130.9, 129.1, 128.1, 127.9, 123.4, 121.0, 119.9, 110.8 (aromatic C), 43.0, 31.8 (aliphatic C). ESI-MS m/z = 347.21 [M + Na]+.
N), 136.1, 131.4, 130.9, 129.1, 128.1, 127.9, 123.4, 121.0, 119.9, 110.8 (aromatic C), 43.0, 31.8 (aliphatic C). ESI-MS m/z = 347.21 [M + Na]+.
4.2.5. (Z)-2-(5-Bromo-1-methyl-2-oxoindolin-3-ylidene)-N-methylhydrazinecarbothioamide (L5). 4-Methyl thiosemicarbazide (0.105 g, 0.001 mol) and 5-bromo isatin (0.226 g, 0.001 mol) were used. Yield: 93%. Yellow. m.p.: 159 °C. Anal. calc. C10H9BrN4OS (%): C, 38.35; H, 2.90; N, 17.89; S, 10.24. Found: C, 38.29; H, 2.81; N, 17.83; S, 10.12. UV-Vis (CH3OH): λmax, nm (ε, dm3 mol−1 cm−1) 265 (22![[thin space (1/6-em)]](https://www.rsc.org/images/entities/char_2009.gif) 100), 364 (26
100), 364 (26![[thin space (1/6-em)]](https://www.rsc.org/images/entities/char_2009.gif) 600). FT-IR (KBr): ν, cm−1 3468, 3427, 3233 (N–H), 1683 (C
600). FT-IR (KBr): ν, cm−1 3468, 3427, 3233 (N–H), 1683 (C![[double bond, length as m-dash]](https://www.rsc.org/images/entities/char_e001.gif) O), 1559 (C
O), 1559 (C![[double bond, length as m-dash]](https://www.rsc.org/images/entities/char_e001.gif) N), 1281 (C
N), 1281 (C![[double bond, length as m-dash]](https://www.rsc.org/images/entities/char_e001.gif) S). 1H NMR (400 MHz, DMSO-d6): δ, ppm 12.39 (s, 1H), 11.29 (s, 1H), 9.35–9.26 (d, J = 4.0 Hz, 1H), 7.80 (s, 1H), 7.48–7.47 (d, J = 4.0 Hz, 1H), 6.88–6.86 (d, J = 8.0 Hz), 3.10–3.09 (d, J = 4.0 Hz, 3H). 13C NMR (100 MHz, DMSO-d6): δ, ppm 178.0 (C
S). 1H NMR (400 MHz, DMSO-d6): δ, ppm 12.39 (s, 1H), 11.29 (s, 1H), 9.35–9.26 (d, J = 4.0 Hz, 1H), 7.80 (s, 1H), 7.48–7.47 (d, J = 4.0 Hz, 1H), 6.88–6.86 (d, J = 8.0 Hz), 3.10–3.09 (d, J = 4.0 Hz, 3H). 13C NMR (100 MHz, DMSO-d6): δ, ppm 178.0 (C![[double bond, length as m-dash]](https://www.rsc.org/images/entities/char_e001.gif) S), 162.6 (C
S), 162.6 (C![[double bond, length as m-dash]](https://www.rsc.org/images/entities/char_e001.gif) O), 141.6 (C
O), 141.6 (C![[double bond, length as m-dash]](https://www.rsc.org/images/entities/char_e001.gif) N), 133.5, 130.6, 123.5, 122.7, 114.6, 113.4 (aromatic C), 31.7 (aliphatic C). ESI-MS m/z = 313.64 [M]+.
N), 133.5, 130.6, 123.5, 122.7, 114.6, 113.4 (aromatic C), 31.7 (aliphatic C). ESI-MS m/z = 313.64 [M]+.
4.3. Synthesis of nickel(II) complexes (1–5)
The methanolic solution of [NiCl2(PPh3)2] (1 mmol) was added into an appropriate substituted isatin thiosemicarbazone ligand (1 mmol) in methanol and a few drops of triethyl amine was added. The reaction mixture was stirred for 5 h under reflux, and then the precipitate formed was filtered and washed with methanol.27 The suitable crystals for X-ray diffraction were grown from CHCl3–DMF mixture (1![[thin space (1/6-em)]](https://www.rsc.org/images/entities/char_2009.gif) :
:![[thin space (1/6-em)]](https://www.rsc.org/images/entities/char_2009.gif) 1).
1).
4.3.1. Bis((Z)-N-methyl-2-(2-oxoindolin-3-ylidene)thiosemicarbazonato)nickel(II) (1). [NiCl2(PPh3)2] (0.654 g, 0.001 mol) and L1 (0.234 g, 0.001 mol) were used. Yield: 89%. Light brown solid. m.p.: 254 °C. Anal. calcd for C20H18N8NiO2S2: C, 45.73; H, 3.45; N, 21.33; S, 12.21. Found: C, 45.99; H, 3.23; N, 21.02; S, 12.00. UV-Vis (DMF): λmax, nm (ε, dm3 mol−1 cm−1) 268 (24![[thin space (1/6-em)]](https://www.rsc.org/images/entities/char_2009.gif) 100), 376 (20
100), 376 (20![[thin space (1/6-em)]](https://www.rsc.org/images/entities/char_2009.gif) 800), 446 (6900). FT-IR (KBr): ν, cm−1 3464, 3426 (N–H), 1640 (C
800), 446 (6900). FT-IR (KBr): ν, cm−1 3464, 3426 (N–H), 1640 (C![[double bond, length as m-dash]](https://www.rsc.org/images/entities/char_e001.gif) O), 1519 (C
O), 1519 (C![[double bond, length as m-dash]](https://www.rsc.org/images/entities/char_e001.gif) N), 1237 (C
N), 1237 (C![[double bond, length as m-dash]](https://www.rsc.org/images/entities/char_e001.gif) S). ESI-MS m/z = 525.04 [M]+. μ = 2.09 BM.
S). ESI-MS m/z = 525.04 [M]+. μ = 2.09 BM.
4.3.2. Bis((Z)-2-(1-allyl-2-oxoindolin-3-ylidene)thiosemicarbazonato)nickel(II) (2). [NiCl2(PPh3)2] (0.654 g, 0.001 mol) and L2 (0.274 g, 0.001 mol) were used. Yield: 85%. Light brown solid. m.p.: 270 °C. Anal. calcd for C26H26N8NiO2S2: C, 51.59; H, 4.33; N, 18.51; S, 10.59. Found: C, 51.21; H, 4.02; N, 18.11; S, 10.06. UV-Vis (DMF): λmax, nm (ε, dm3 mol−1 cm−1) 269 (14![[thin space (1/6-em)]](https://www.rsc.org/images/entities/char_2009.gif) 600), 376 (10
600), 376 (10![[thin space (1/6-em)]](https://www.rsc.org/images/entities/char_2009.gif) 400), 447 (6600). FT-IR (KBR): ν, cm−1 3461 (N–H), 1647 (C
400), 447 (6600). FT-IR (KBR): ν, cm−1 3461 (N–H), 1647 (C![[double bond, length as m-dash]](https://www.rsc.org/images/entities/char_e001.gif) O), 1522 (C
O), 1522 (C![[double bond, length as m-dash]](https://www.rsc.org/images/entities/char_e001.gif) N), 1251 (C
N), 1251 (C![[double bond, length as m-dash]](https://www.rsc.org/images/entities/char_e001.gif) S). ESI-MS m/z = 605.10 [M]+. μ = 1.98 BM.
S). ESI-MS m/z = 605.10 [M]+. μ = 1.98 BM.
4.3.3. Bis((Z)-N-methyl-2-(1-methyl-2-oxoindolin-3-ylidene)thiosemicarbazonato)nickel(II) (3). [NiCl2(PPh3)2] (0.654 g, 0.001 mol) and L3 (0.248 g, 0.001 mol) were used. Yield: 83%. Brown. m.p.: 261 °C; Anal. calcd for C22H22N8NiO2S2: C, 47.76; H, 4.01; N, 20.25; S, 11.59 Found: C, 46.91; H, 4.18; N, 20.00; S, 11.37. UV-Vis (DMF): λmax, nm (ε, dm3 mol−1 cm−1) 267 (26![[thin space (1/6-em)]](https://www.rsc.org/images/entities/char_2009.gif) 100), 382 (8800), 448 (6500). FT-IR (KBr): ν, cm−1 3453 (N–H), 1636 (C
100), 382 (8800), 448 (6500). FT-IR (KBr): ν, cm−1 3453 (N–H), 1636 (C![[double bond, length as m-dash]](https://www.rsc.org/images/entities/char_e001.gif) O), 1525 (C
O), 1525 (C![[double bond, length as m-dash]](https://www.rsc.org/images/entities/char_e001.gif) N), 1220 (C
N), 1220 (C![[double bond, length as m-dash]](https://www.rsc.org/images/entities/char_e001.gif) S). ESI-MS m/z = 553.07 [M]+. μ = 1.95 B.M.
S). ESI-MS m/z = 553.07 [M]+. μ = 1.95 B.M.
4.3.4. Bis((Z)-2-(1-benzyl-2-oxoindolin-3-ylidene)thiosemicarbazonato)nickel(II) (4). [NiCl2(PPh3)2] (0.654 g, 0.001 mol) and L4 (0.324 g, 0.001 mol) were used. Yield: 87%. Light brown solid. m.p.: 293 °C. Anal. calcd for C34H30N8NiO2S2: C, 57.88; H, 4.29; N, 15.88; S, 9.09. Found: C, 57.01; H, 4.51; N, 15.32; S, 8.71. UV-Vis (DMF): λmax, nm (ε, dm3 mol−1 cm−1) 267 (22![[thin space (1/6-em)]](https://www.rsc.org/images/entities/char_2009.gif) 500), 388 (15
500), 388 (15![[thin space (1/6-em)]](https://www.rsc.org/images/entities/char_2009.gif) 900), 440 (5900). FT-IR (KBr): ν, cm−1 3463 (N–H), 1644 (C
900), 440 (5900). FT-IR (KBr): ν, cm−1 3463 (N–H), 1644 (C![[double bond, length as m-dash]](https://www.rsc.org/images/entities/char_e001.gif) O), 1524 (C
O), 1524 (C![[double bond, length as m-dash]](https://www.rsc.org/images/entities/char_e001.gif) N), 1227 (C
N), 1227 (C![[double bond, length as m-dash]](https://www.rsc.org/images/entities/char_e001.gif) S). ESI-MS m/z = 705.13 [M]+. μ = 2.13 BM.
S). ESI-MS m/z = 705.13 [M]+. μ = 2.13 BM.
4.3.5. Bis((Z)-2-(5-bromo-1-methyl-2-oxoindolin-3-ylidene)thiosemicarbazonato)nickel(II) (5). [NiCl2(PPh3)2] (0.654 g, 0.001 mol) and L5 (0.403 g, 0.001 mol) were used. Yield: 79%; Light brown solid. m.p.: 272 °C. Anal. calcd for C20H16Br2N8NiO2S2: C, 35.17; H, 2.36; N, 16.41; S, 9.39 found: C, 34.83; H, 2.59; N, 16.12; S, 9.54. UV-Vis (DMF): λmax, nm (ε, dm3 mol−1 cm−1) 293 (26![[thin space (1/6-em)]](https://www.rsc.org/images/entities/char_2009.gif) 500), 380 (10
500), 380 (10![[thin space (1/6-em)]](https://www.rsc.org/images/entities/char_2009.gif) 500), 453 (6600). FT-IR (KBr): ν, cm−1 3470, 3423 (N–H), 1642 (C
500), 453 (6600). FT-IR (KBr): ν, cm−1 3470, 3423 (N–H), 1642 (C![[double bond, length as m-dash]](https://www.rsc.org/images/entities/char_e001.gif) O), 1533 (C
O), 1533 (C![[double bond, length as m-dash]](https://www.rsc.org/images/entities/char_e001.gif) N), 1223 (C
N), 1223 (C![[double bond, length as m-dash]](https://www.rsc.org/images/entities/char_e001.gif) S). ESI-MS m/z = 683.09 [M]+. μ = 2.17 BM.
S). ESI-MS m/z = 683.09 [M]+. μ = 2.17 BM.
4.4. Single crystal X-ray diffraction studies
A Bruker APEX2 X-ray (three-circle) diffractometer was employed for crystal screening, unit cell determination, and data collection. The X-ray radiation employed was generated from a Mo sealed X-ray tube (Kα = 0.70173 Å with a potential of 40 kV, 40 mA) fitted with a graphite monochromator in the parallel mode (175 mm collimator with 0.5 mm pinholes). Sixty data frames were taken at widths of 0.5°. These reflections were used in the auto-indexing procedure to determine the unit cell. A suitable cell was found and refined by nonlinear least squares and Bravais lattice procedures. The unit cell was verified by examination of the hkl overlays on several frames of data by comparing with both the orientation matrices. No super-cell or erroneous reflections were observed. After careful examination of the unit cell, a standard data collection procedure was initiated using omega scans. Integrated intensity information for each reflection was obtained by reduction of the data frames with the program APEX2.53 The integration method employed a three dimensional profiling algorithm and all data were corrected for Lorentz and polarization factors, as well as for crystal decay effects. Finally, the data were merged and scaled to produce a suitable data set. The absorption correction program SADABS54 was employed to correct the data for absorption effects. Systematic reflection conditions and statistical tests of the data suggested the space group. Solution was obtained readily using SHELXTL (XS).55 Hydrogen atoms were placed in idealized positions and were set riding on the respective parent atoms. All non-hydrogen atoms were refined with anisotropic thermal parameters. The structure was refined (weighted least squares refinement on F2) to convergence.56 Olex2 was employed for the final data presentation and structure plots.55
4.5. DNA binding studies
The interaction of metal complexes with CT DNA was carried out in Tris -HCl/NaCl buffer (pH 7.2). The bulk solution of CT DNA was prepared by diluting the CT DNA using Tris–HCl/NaCl buffer followed by stirring at 4 °C for three days, and kept at 4 °C for not more than a week. The stock solution of CT DNA gave a ratio of UV absorbance at 260 and 280 nm (A260/A280) of 1.89, indicating that the DNA was sufficiently free of proteins. The bulk DNA solution was further diluted to 10 folds to show maximum absorbance at 260 nm. The absorption coefficient of CT DNA was 6600 cm−1 M−1 per nucleotide.57 Ni(II) complexes of required concentration were prepared by dissolving the calculated amount of the complexes in 5% DMF/Tris–HCl/NaCl. Complex solution of concentration 15 μM was taken in cuvette and CT DNA of equivalent concentration (5–50 μM) was added each time and the significant absorbance change was noted.
The competitive binding of each complex with EB has been investigated by fluorescence spectroscopic technique in order to examine whether the complex can displace EB from its CT DNA-EB complex. Ethidium bromide solution was prepared using Tris–HCl/NaCl buffer (pH 7.2). The test solution was added in aliquots of 5 μM concentration to DNA-EB and the change in fluorescence intensities at 596 nm (450 nm excitation) was noted down.
Circular dichroic spectra were recorded with a J-715 spectropolarimeter (Jasco) at 25 °C with a 0.1 cm path length cuvette. The spectra were recorded for 200 μM of DNA in the absence and presence of 40 μM of the nickel(II) complexes (1–5) in the region 220–300 nm.58
4.6. DNA cleavage studies
A mixture of Tris buffer (5 mM Tris–HCl/50 mM NaCl buffer, pH 7.2), pUC19 plasmid DNA (150 μg mL−1) and the complexes (1–5) was incubated for 3 h at 37 °C. A dye solution (0.05% bromophenol blue and 5% glycerol) was added to the mixture prior to electrophoresis. The samples were then analyzed by 1.5% agarose gel electrophoresis [Tris–HCl/boric acid/EDTA (TBE) buffer, pH 8.0] for 2 h at 60 mV. The gel was stained with 0.5 μg mL−1 ethidium bromide, visualized by UV light and photographed. The extent of cleavage of pUC19 was determined by measuring the intensity of the bands using AlphaImager HP instrument.
4.7. Protein binding studies
The binding of nickel(II) complexes (1–5) with BSA was studied using fluorescence spectra recorded at a fixed excitation wavelength corresponding to BSA at 280 nm and monitoring the emission at 335 nm. The excitation and emission slit widths and scan rates were constantly maintained for all the experiments. Stock solution of BSA was prepared in 50 mM phosphate buffer (pH = 7.2) and stored in the dark at 4 °C for further use. Concentrated stock solutions of each test compound were prepared by dissolving them in DMF–phosphate buffer (5![[thin space (1/6-em)]](https://www.rsc.org/images/entities/char_2009.gif) :
:![[thin space (1/6-em)]](https://www.rsc.org/images/entities/char_2009.gif) 95) and diluted with phosphate buffer to get required concentrations. 2.5 mL of BSA solution was titrated by successive additions of a 10−6 M stock solution of the complexes using a micropipette. For synchronous fluorescence spectra measurements, the same concentration of BSA and the complexes were used and the spectra were measured at two different Δλ (difference between the excitation and emission wavelengths of BSA) values of 15 and 60 nm.
95) and diluted with phosphate buffer to get required concentrations. 2.5 mL of BSA solution was titrated by successive additions of a 10−6 M stock solution of the complexes using a micropipette. For synchronous fluorescence spectra measurements, the same concentration of BSA and the complexes were used and the spectra were measured at two different Δλ (difference between the excitation and emission wavelengths of BSA) values of 15 and 60 nm.
In three dimensional fluorescence studies, the emission wavelength was recorded between 240 and 440 nm, and the excitation wavelength was recorded from 200 to 360 nm at 10 nm increments. The other scanning parameters were just the same as the fluorescence quenching experiments.59
4.8. Molecular docking studies of DNA
The X-ray crystal structure of B-DNA (PDB ID: 1BNA) dodecamer d(CGCGAATTCGCG)2 and human DNA Topo-I complex (PDB ID: 1SC7) was obtained from the Protein Data Bank.60 2D structure of nickel(II) complexes was drawn using ChemDraw Ultra 12.0 (ChemOffice 2010). Chem3D Ultra 12.0 was used to convert 2D structure into 3D and the energy was minimized using semi-empirical AM1 method. Molecular docking studies have been done using the AutoDock Tools (ADT) version 1.5.6 and AutoDock version 4.2.5.1 docking programs. The energy calculations were made using genetic algorithms. The outputs were exported to PyMol for visual inspection of the binding modes and for possible polar and hydrophobic interactions of the complexes with DNA.
4.9. Molecular docking studies of protein
GOLD (Genetic Optimization for Ligand Docking) is a genetic algorithm for docking flexible ligands into protein binding sites. GOLD enables to make confident binding mode predictions and achieve high database enrichments. GOLD reliably identifies the correct binding mode for a large range of test set cases and has been shown to perform favorably against other docking tools in numerous independent studies.
The structure of the protein was obtained from RCSB Protein Data Bank,61 (with PDB ID:3V03) and the structure of the protein was minimized by running 1000 steps of steepest descent algorithm using the UCSF Chimera software. All water molecules were deleted while minimizing. The minimized protein was then imported into the Hermes Visualizer, the graphical interface of GOLD. The structure of the ligands was drawn and 3D optimized using chemsketch software. The target protein was kept rigid and the ligands being docked were kept flexible.
4.10. Cytotoxic studies using SRB assay
The sulforhodamine B (SRB) assay represents an appropriate and sensitive assay to measure the drug induced cytotoxicity and cell proliferation for large scale drug screening applications.60 The cell lines were grown in RPMI 1640 medium containing 10% fetal bovine serum and 2 mM L-glutamine. For screening experiments, cells were inoculated into 96 well microtiter plates in 90 μL at plating densities depending on the doubling time of individual cell lines. After cell inoculation, the microtiter plates were incubated at 37 °C, 5% CO2, 95% air and 100% relative humidity for 24 h prior to addition of experimental drugs.
After 24 h, one plate of each cell line was fixed in situ with trichloroacetic acid (TCA), to represent a measurement of the cell population for each cell line at the time of drug addition (Tz). Experimental drugs were solubilized in appropriate solvent at 400-fold the desired final maximum test concentration and stored frozen prior to use. At the time of drug addition, an aliquot of frozen concentrate was thawed and diluted to 10 times the desired final maximum test concentration with complete medium containing test article at a concentration of 10−3. Additional three, 10-fold serial dilutions were made to provide a total of four drug concentrations. Aliquots of 10 μL of these different drug dilutions were added to the appropriate microtiter wells already containing 90 μL of medium, resulting in the required final drug concentrations.
After compound addition, plates were incubated at standard conditions for 24 h and assay was terminated by the addition of cold TCA. Cells were fixed in situ by the gentle addition of 50 μL of cold 30% (w/v) TCA (final concentration, 10% TCA) and incubated for 60 minutes at 4 °C. The supernatant was discarded and the plates were washed five times with tap water and air dried. Sulforhodamine B (SRB) solution (50 μL) at 0.4% (w/v) in 1% acetic acid was added to each of the wells, and plates were incubated for 20 minutes at room temperature. After staining, unbound dye was recovered and the residual dye was removed by washing five times with 1% acetic acid. The plates were air dried. Bound stain was subsequently eluted with 10 mM trizma base, and the absorbance was read on an Elisa plate reader at a wavelength of 540 nm with 690 nm reference wavelength. Percentage growth inhibition was calculated as:
| [(Ti − Tz)/(C − Tz)] × 100 for concentrations for which Ti ≥ Tz (Ti − Tz) positive or zero |
| [(Ti − Tz)/Tz] × 100 for concentrations for which Ti < Tz. (Ti − Tz) negative |
where Tz = growth at the time of drug addition,
C = control growth, and Ti = test growth in the presence of drug at the four concentration levels. IC50 values can be derived from curve fitting methods with statistical analysis software.
Acknowledgements
J. H. thanks the University Grants Commission for the fellowship (F1-17.1/2012-13/RGNF-2012-13-ST-AND-18716). We thank anti cancer drug screening facility (ACDSF) at ACTREC, Tata Memorial Centre, Navi Mumbai for cytotoxicity studies and CLRI, Chennai for providing CD facility.
References
- Z. Guo and P. J. Sadler, Angew. Chem., Int. Ed., 1999, 38, 1512–1531 CrossRef CAS.
- P. J. Dyson and G. Sava, Dalton Trans., 2006, 1929–1933 RSC.
- C. Orvig and M. J. Abrams, Chem. Rev., 1999, 99, 2201–2204 CrossRef CAS PubMed.
- Y. P. Ho, S. C. F. Au-Yeung and K. K. W. To, Med. Res. Rev., 2003, 23, 633–655 CrossRef CAS PubMed.
- E. S. Sherman and S. J. Lippard, Chem. Rev., 1987, 87, 1153–1181 CrossRef.
- D. R. Williams, Chem. Rev., 1972, 72, 1153–1181 Search PubMed.
- K. E. Erkkila, D. T. Odom and J. K Barton, Chem. Rev., 1999, 99, 2777–2795 CrossRef CAS PubMed.
- N. I. Romero-Canelo and P. J. Sadler, Inorg. Chem., 2013, 52, 12276–12291 CrossRef PubMed.
- P. C. A. Bruijnincx and P. J. Sadler, Curr. Opin. Chem. Biol., 2008, 12, 197–206 CrossRef CAS PubMed.
- Y. B. Zeng, N. Yang, W. S. Liu and N. Tang, J. Inorg. Biochem., 2003, 97, 258–264 CrossRef CAS.
- I. Bratsos, S. Jedner, T. Gianferrara and E. Alessio, Chimia, 2007, 61, 692–697 CrossRef CAS.
- B. Rosenberg, L. Vancamp, J. E. Trosko and V. H. Mansour, Nature, 1969, 222, 385–386 CrossRef CAS PubMed.
- S. J. Brown, C. S. Chow, S. J. Lippard and R. B. King, in Encyclopedia of Inorganic Chemistry, 1994, vol. 6, p. 3305 Search PubMed.
- A. Silvestri, G. Barone, G. Ruisi, M. Giudice and S. Tumminello, J. Inorg. Biochem., 2004, 98, 589–594 CrossRef CAS PubMed.
- P. K. M. Siu, D. L. Ma and C. M. Che, Chem. Commun., 2005, 1025–1027 Search PubMed.
- J. N. Tian, J. Q. Liu, X. Tian, Z. D. Hu and X. G. Chen, J. Mol. Struct., 2004, 691, 197–202 CrossRef CAS PubMed.
- J. Seetharamappa and B. P. Kamat, Chem. Pharm. Bull., 2004, 52, 1053–1057 CrossRef CAS.
-
(a) S. B. Padhye and G. B. Kauffman, Coord. Chem. Rev., 1985, 63, 127–160 CrossRef CAS;
(b) I. Haiduc and C. Silvestru, Coord. Chem. Rev., 1990, 99, 253–296 CrossRef CAS;
(c) D. X. West, S. B. Padhye and P. B. Sonawane, Struct. Bonding, 1991, 76, 1–50 CAS;
(d) D. X. West, A. E. Liberta, S. B. Padhye, R. C. Chikate, P. B. Sonawane, A. S. Kumbhar and R. G. Yerande, Coord. Chem. Rev., 1993, 123, 49–71 CrossRef CAS.
- Y. P. Tion, C. Y. Duan, Z. L. Lu, X. Z. You, H. K. Fun and S. Kandasamy, Polyhedron, 1996, 15, 2263–2271 CrossRef.
-
(a) P. Souza, I. A. Matesanz and V. J. Fernandez, Dalton Trans., 1996, 6, 3011–3013 RSC;
(b) D. Kovala-Demertzi, A. Domopoulou, M. A. Demertzis, J. Valdes-Martinez, S. Hernandez-Ortega, G. Espinosa- Perez, D. X. West, M. M. Salberg, G. A. Bain and P. D. Bloom, Polyhedron, 1996, 15, 2587–2596 CrossRef CAS;
(c) M. A. Ali, K. K. Dey, M. Nazimuddin, F. E. Smith, R. J. Butcher, J. P. Jasinski and J. M. Jasinski, Polyhedron, 1996, 15, 3331–3339 CrossRef CAS.
-
(a) A. De Bolfo, T. D. Smith, J. F. Boas and J. R. Pilbrow, Aust. J. Chem., 1976, 29, 2583–2591 CrossRef;
(b) Z. Lu, C. White, A. L. Rheingold and R. H. Crabtree, Inorg. Chem., 1993, 32, 3991–3994 CrossRef CAS;
(c) D. X. West, Y. H. Yang, T. L. Klein, K. I. Goldberg, A. E. Liberta, J. Valdes-Martinez and R. A. Toscano, Polyhedron, 1995, 14, 1681–1693 CrossRef CAS;
(d) D. X. West, Y. H. Yang, T. L. Klein, K. I. Goldberg, A. E. Liberta, J. Valdes-Martinez and R. A. Toscano, Polyhedron, 1995, 14, 3051–3060 CrossRef CAS.
-
(a) H. Beraldo and D. Gambino, Mini-Rev. Med. Chem., 2004, 4, 31–39 CrossRef CAS;
(b) Y. Yu, D. S. Kalinowski, Z. Kovacevic, A. R. Siafakas, P. J. Jansson, C. Stefani, D. B. Lovejoy, P. C. Sharpe, P. V. Bernhardt and D. R. Richardson, J. Med. Chem., 2009, 52, 5271–5294 CrossRef CAS PubMed;
(c) D. S. Kalinowski, P. Quach and D. R. Richardson, Future Med. Chem., 2009, 1, 1143–1151 CrossRef CAS PubMed.
- A. Volbeda, M. H. Charon, E. C. Piras, M. Frey and J. C. Fontecilla Camps, Nature, 1995, 373, 580–587 CrossRef CAS PubMed.
- S. Wang, M. H. Lee, R. P. Hausinger, P. A. Clark, D. E. Wilcox and R. A. Scott, Inorg. Chem., 1994, 33, 1589–1593 CrossRef CAS.
- M. Sobiesiak, I. P. Lorenz, P. Mayer, M. Wozniczka, A. Kufelnicki, U. Krajewska, M. Rozalski and E. Budzisz, Eur. J. Med. Chem., 2011, 46, 5917–5926 CrossRef CAS PubMed.
- P. X. Xi, Z. H. Xu, F. J. Chen, Z. Zeng and X. W. Zhang, J. Inorg. Biochem., 2009, 103, 210–218 CrossRef CAS PubMed.
- R. Prabhakaran, R. Sivasamy, J. Angayarkanni, R. Huang, P. Kalaivani, R. Karvembu, F. Dallemer and K. Natarajan, Inorg. Chim. Acta, 2011, 374, 647–653 CrossRef CAS PubMed.
- R. Prabhakaran, R. Karvembu, T. Hashimoto, K. Shimizu and K. Natarajan, Inorg. Chim. Acta, 2005, 358, 6093–7000 CrossRef PubMed.
- A. Zahra, S. Ekk, L. Weisheeng, M. Yinfa, C. Charles and P. Subhash, J. Inorg. Biochem., 2005, 199, 1526–1531 Search PubMed.
- D. H. Matthew, R. B. Kyle, S. V. Matthew, M. P. Kristen, K. M. Julie, L. Jiayang, J. W. Martin, B. B. Matthew, H. W. Timothy, M. F. Henry and M. G. Michael, J. Med. Chem., 2011, 54, 5878–5889 CrossRef PubMed.
- J. S. Guerrero, P. C. Sanchez, E. R. Perez, F. V. Garcia, M. E. B. Gomez and L. R. Azuara, Toxicol. in Vitro, 2011, 25, 1376–1384 CrossRef PubMed.
- A. M. Pyle, J. P. Rehmann, R. Meshoyrer, C. V. Kumar, N. J. Turro and J. K. Barton, J. Am. Chem. Soc., 1989, 111, 3051–3058 CrossRef CAS.
- A. Wolf, G. H. Shimer and T. Meehan, Biochemistry, 1987, 26, 6392–6396 CrossRef.
- N. Chitrapriya, T. Sathiya Kamatchi, M. Zeller, H. Lee and K. Natarajan, Spectrochim. Acta, Part A, 2011, 81, 128–134 CrossRef CAS PubMed.
- J. R. Lakowicz and G. Webber, Biochemistry, 1973, 12, 4161–4170 CrossRef CAS.
- B. C. Baguley and M. Lebret, Biochemistry, 1984, 23, 937–943 CrossRef CAS.
- W. D. Wilson, L. Ratmeyer, M. Zhao, L. Strekowski and D. Boykin, Biochemistry, 1993, 32, 4098–4104 CrossRef CAS.
- K. S. Ghosh, B. K. Sahoo, D. Jana and S. Dasgupta, J. Inorg. Biochem., 2008, 102, 1711–1718 CrossRef CAS PubMed.
- S. Mahadevan and M. Palaniandavar, Inorg. Chem., 1998, 37, 693–700 CrossRef CAS.
- P. Uma Maheswari and M. Palaniandavar, J. Inorg. Biochem., 2004, 98, 219–230 CrossRef CAS PubMed.
- D. Senthil Raja, N. S. P. Bhuvanesh and K. Natarajan, Eur. J. Med. Chem., 2011, 46, 4584–4594 CrossRef PubMed.
- D. Senthil Raja, G. Paramaguru, N. S. P. Bhuvanesh, J. H. Reibenspies, R. Renganathan and K. Natarajan, Dalton Trans., 2011, 4548–4559 RSC.
- J. R. Lakowicz, Fluorescence Quenching: Theory and Applications. Principles of Fluorescence Spectroscopy, Kluwer Academic/Plenum Publishers, New York, 1999, pp. 53–127 Search PubMed.
- X. Z. Feng, Z. Yang, L. J. Wang and C. Bai, Talanta, 1998, 47, 1223–1229 CrossRef CAS.
- G. Z. Chen, X. Z. Huang, Z. Z. Zheng, J. G. Xu and Z. B. Wang, Analysis Method of Fluorescence, Science Press, Beijing, 3rd edn, 1990 Search PubMed.
- J. N. Miller, Proc. Anal. Div. Chem. Soc., 1979, 16, 203–208 CAS.
- P. Krishnamoorthy, P. Sathyadevi, A. H. Cowley, R. R. Butorac and N. Dharmaraj, Eur. J. Med. Chem., 2011, 46, 3376–3387 CrossRef CAS PubMed.
- G. W. Zhang, Q. M. Que, J. H. Pan and J. B. Guo, J. Mol. Struct., 2008, 881, 132–138 CrossRef CAS PubMed.
- A. N. Glazer and E. L. Smith, J. Biol. Chem., 1961, 236, 2942–2947 CAS.
- D. Li, M. Zhu, C. Xu and B. Ji, Eur. J. Med. Chem., 2011, 46, 588–599 CrossRef CAS PubMed.
- X. S. Xiao, S. Antony, Y. Pommier and M. Cushman, J. Med. Chem., 2005, 48, 3231–3238 CrossRef CAS PubMed.
- J. Zhou, D. Wu and D. Guo, J. Chem. Technol. Biotechnol., 2010, 85, 1402–1406 CrossRef CAS PubMed.
- APEX2, Program for Data Collection on Area Detectors, BRUKER AXS Inc., 5465 East Cheryl Parkway, Madison, WI 53711–5373, USA Search PubMed.
- SADABS and G. M. Sheldrick, Program for Absorption Correction of Area Detector Frames, BRUKER AXS Inc., 5465 East Cheryl Parkway, Madison, WI 53711–5373, USA Search PubMed.
- G. M. Sheldrick, Acta Crystallogr., Sect. A: Found. Crystallogr., 2008, 64, 112–122 CrossRef CAS PubMed.
- O. V. Dolomanov, L. J. Bourhis, R. J. Gildea, J. A. K. Howard and H. Puschmann, J. Appl. Crystallogr., 2009, 42, 339–341 CrossRef CAS.
- M. E. Reichmann, S. A. Rice and P. Thomas, J. Am. Chem. Soc., 1954, 76, 3047–3053 CrossRef CAS.
- V. Uma, M. Elango and B. Unni Nair, Eur. J. Inorg. Chem., 2007, 22, 3484–3490 CrossRef PubMed.
- P. Kalaivani, R. Prabhakaran, E. Vaishnavi, T. Rueffer, H. Lang, P. Poornima, R. Renganathan, V. V. Padma and K. Natarajan, Inorg. Chem. Front., 2014, 1, 311–324 RSC.
- V. Vanicha and K. Kanyawim, Nat. Protoc., 2006, 1, 1112–1116 CrossRef PubMed.
- Protein Data Bank, http://www.rcsb.org/pdb.
|
| This journal is © The Royal Society of Chemistry 2015 |
Click here to see how this site uses Cookies. View our privacy policy here. ![[double bond, length as m-dash]](https://www.rsc.org/images/entities/char_e001.gif) N stretching frequency of the ligands was observed at 1561–1552 cm−1. The C
N stretching frequency of the ligands was observed at 1561–1552 cm−1. The C![[double bond, length as m-dash]](https://www.rsc.org/images/entities/char_e001.gif) O and C
O and C![[double bond, length as m-dash]](https://www.rsc.org/images/entities/char_e001.gif) S stretching frequencies appeared around 1689–1682 cm−1 and 1285–1271 cm−1 respectively. On complexation there is a decrease in carbonyl, thiocarbonyl and azomethine stretching frequencies, which suggested that thiosemicarbazones coordinate to nickel(II) through sulfur, carbonyl oxygen and the azomethine nitrogen atoms.28 The observed magnetic moment lies within 1.95–2.17 BM, which is attributable to the octahedral nickel(II) center (d8, S = 1).29 On examination of the 1H NMR spectra of the ligands (L1–L5), H–N–C
S stretching frequencies appeared around 1689–1682 cm−1 and 1285–1271 cm−1 respectively. On complexation there is a decrease in carbonyl, thiocarbonyl and azomethine stretching frequencies, which suggested that thiosemicarbazones coordinate to nickel(II) through sulfur, carbonyl oxygen and the azomethine nitrogen atoms.28 The observed magnetic moment lies within 1.95–2.17 BM, which is attributable to the octahedral nickel(II) center (d8, S = 1).29 On examination of the 1H NMR spectra of the ligands (L1–L5), H–N–C![[double bond, length as m-dash]](https://www.rsc.org/images/entities/char_e001.gif) S protons resonate in the regions 12.39–12.78 and 7.57–9.26 ppm. The signal of amide N–H (L1 and L5) proton appeared at 11.29–11.10 ppm. 13C NMR spectra of the ligands showed resonances due to thiolato carbon (C
S protons resonate in the regions 12.39–12.78 and 7.57–9.26 ppm. The signal of amide N–H (L1 and L5) proton appeared at 11.29–11.10 ppm. 13C NMR spectra of the ligands showed resonances due to thiolato carbon (C![[double bond, length as m-dash]](https://www.rsc.org/images/entities/char_e001.gif) S), carbonyl carbon (C
S), carbonyl carbon (C![[double bond, length as m-dash]](https://www.rsc.org/images/entities/char_e001.gif) O) and imine carbon (C
O) and imine carbon (C![[double bond, length as m-dash]](https://www.rsc.org/images/entities/char_e001.gif) N) in the regions 178.0–179.1, 161.1–163 and 141.6–143.9 ppm respectively. Chemical shift of all other aromatic and aliphatic protons/carbons was observed in the expected regions.27
N) in the regions 178.0–179.1, 161.1–163 and 141.6–143.9 ppm respectively. Chemical shift of all other aromatic and aliphatic protons/carbons was observed in the expected regions.27
![[double bond, length as m-dash]](https://www.rsc.org/images/entities/char_e001.gif) N bond. This hydrogen bond renders the isatin and TSC (N2–N3–C9–S1–N4) moieties essentially coplanar.30 The crystal structure of L1 showed the existence of an intra-molecular hydrogen bond between sulfur and water molecule [O(1W)–H(1WA)⋯S(1) = 3.337 Å].
N bond. This hydrogen bond renders the isatin and TSC (N2–N3–C9–S1–N4) moieties essentially coplanar.30 The crystal structure of L1 showed the existence of an intra-molecular hydrogen bond between sulfur and water molecule [O(1W)–H(1WA)⋯S(1) = 3.337 Å].
![[thin space (1/6-em)]](https://www.rsc.org/images/entities/char_2009.gif)
![[thin space (1/6-em)]](https://www.rsc.org/images/entities/char_2009.gif) 112
112![[thin space (1/6-em)]](https://www.rsc.org/images/entities/char_2009.gif) 472
472![[thin space (1/6-em)]](https://www.rsc.org/images/entities/char_2009.gif)
![[thin space (1/6-em)]](https://www.rsc.org/images/entities/char_2009.gif) 121
121

![[thin space (1/6-em)]](https://www.rsc.org/images/entities/char_2009.gif) Kb + n
Kb + n![[thin space (1/6-em)]](https://www.rsc.org/images/entities/char_2009.gif) log[Q] where Kb is the binding constant of the complex with BSA and n is the number of binding sites. From the plot of log[(Fo − F)/F] versus log[Q] (Fig. 14), the number of binding sites (n) and the binding constant (Kb) values have been obtained. The quenching constant (Kq), binding constant (Kb) and number of binding sites (n) for the interaction of the nickel(II) complexes with BSA are shown in Table 6. In all the complexes, only one binding site is available to interact with BSA. Results showed that complexes 2, 4 and 1 interact strongly with BSA compared to 3 and 5.
log[Q] where Kb is the binding constant of the complex with BSA and n is the number of binding sites. From the plot of log[(Fo − F)/F] versus log[Q] (Fig. 14), the number of binding sites (n) and the binding constant (Kb) values have been obtained. The quenching constant (Kq), binding constant (Kb) and number of binding sites (n) for the interaction of the nickel(II) complexes with BSA are shown in Table 6. In all the complexes, only one binding site is available to interact with BSA. Results showed that complexes 2, 4 and 1 interact strongly with BSA compared to 3 and 5.
![[double bond, length as m-dash]](https://www.rsc.org/images/entities/char_e001.gif) O.49 The results showed that the three-dimensional fluorescence contour map of protein and protein-(1–5) was clearly different. From Fig. 17 and S7,† it is clear that the fluorescence intensities of peak 2 decreased significantly in the presence of complexes (1–5) indicating the quenching of fluorescence of BSA by the complexes. The results shown in Table 7 indicated the conformational changes of BSA upon interaction with the complexes.50
O.49 The results showed that the three-dimensional fluorescence contour map of protein and protein-(1–5) was clearly different. From Fig. 17 and S7,† it is clear that the fluorescence intensities of peak 2 decreased significantly in the presence of complexes (1–5) indicating the quenching of fluorescence of BSA by the complexes. The results shown in Table 7 indicated the conformational changes of BSA upon interaction with the complexes.50

![[double bond, length as m-dash]](https://www.rsc.org/images/entities/char_e001.gif) O of base moiety of DT-21 and forms a hydrogen bond with the bond length of 2.0 Å.
O of base moiety of DT-21 and forms a hydrogen bond with the bond length of 2.0 Å.

![[thin space (1/6-em)]](https://www.rsc.org/images/entities/char_2009.gif) 300), 364 (16
300), 364 (16![[thin space (1/6-em)]](https://www.rsc.org/images/entities/char_2009.gif) 600). FT-IR (KBr): ν, cm−1 3469, 3420, 3236 (N–H), 1689 (C
600). FT-IR (KBr): ν, cm−1 3469, 3420, 3236 (N–H), 1689 (C![[double bond, length as m-dash]](https://www.rsc.org/images/entities/char_e001.gif) O), 1557 (C
O), 1557 (C![[double bond, length as m-dash]](https://www.rsc.org/images/entities/char_e001.gif) N), 1274 (C
N), 1274 (C![[double bond, length as m-dash]](https://www.rsc.org/images/entities/char_e001.gif) S). 1H NMR (400 MHz, DMSO-d6): δ, ppm 12.59 (s, 1H), 11.10 (s, 1H), 9.09–9.08 (d, J = 4.0 Hz, 1H), 7.62–7.60 (d, J = 8.0 Hz, 1H), 7.29–7.26 (t, J = 8.0 Hz, 1H), 7.04–7.00 (t, J = 8.0 Hz, 1H), 6.90–6.88 (d, J = 8.0 Hz, 1H), 3.09–3.08 (d, J = 4.0 Hz, 3H). 13C NMR (100 MHz, DMSO-d6): δ, ppm 178.2 (C
S). 1H NMR (400 MHz, DMSO-d6): δ, ppm 12.59 (s, 1H), 11.10 (s, 1H), 9.09–9.08 (d, J = 4.0 Hz, 1H), 7.62–7.60 (d, J = 8.0 Hz, 1H), 7.29–7.26 (t, J = 8.0 Hz, 1H), 7.04–7.00 (t, J = 8.0 Hz, 1H), 6.90–6.88 (d, J = 8.0 Hz, 1H), 3.09–3.08 (d, J = 4.0 Hz, 3H). 13C NMR (100 MHz, DMSO-d6): δ, ppm 178.2 (C![[double bond, length as m-dash]](https://www.rsc.org/images/entities/char_e001.gif) S), 163.0 (C
S), 163.0 (C![[double bond, length as m-dash]](https://www.rsc.org/images/entities/char_e001.gif) O), 142.5 (C
O), 142.5 (C![[double bond, length as m-dash]](https://www.rsc.org/images/entities/char_e001.gif) N), 131.8, 131.3, 122.6, 121.1, 111.4 (aromatic C), 31.6 (aliphatic C). ESI-MS m/z = 234.38 [M]+.
N), 131.8, 131.3, 122.6, 121.1, 111.4 (aromatic C), 31.6 (aliphatic C). ESI-MS m/z = 234.38 [M]+.![[thin space (1/6-em)]](https://www.rsc.org/images/entities/char_2009.gif) 800), 365 (62
800), 365 (62![[thin space (1/6-em)]](https://www.rsc.org/images/entities/char_2009.gif) 000). FT-IR (KBr): ν, cm−1 3465, 3232 (N–H), 1682 (C
000). FT-IR (KBr): ν, cm−1 3465, 3232 (N–H), 1682 (C![[double bond, length as m-dash]](https://www.rsc.org/images/entities/char_e001.gif) O), 1555 (C
O), 1555 (C![[double bond, length as m-dash]](https://www.rsc.org/images/entities/char_e001.gif) N), 1285 (C
N), 1285 (C![[double bond, length as m-dash]](https://www.rsc.org/images/entities/char_e001.gif) S). 1H NMR (400 MHz, CDCl3): δ, ppm 12.78 (s, 1H), 7.82 (s, 1H), 7.59–7.57 (d, J = 8.0 Hz, 1H), 7.37–7.33 (m, 1H), 7.12–7.08 (t, J = 8.0 Hz, 1H), 6.89–6.87 (d, J = 8.0 Hz, 1H), 5.89–5.80 (m, 1H), 5.28–5.27 (d, J = 4.0 Hz, 1H), 5.248–5240 (t, J = 1.6 Hz, 1H), 4.39–4.37 (d, J = 8.0 Hz, 1H), 3.30–3.29 (d, J = 4.0 Hz, 3H). 13C NMR (100 MHz, CDCl3): δ, ppm 179.1 (C
S). 1H NMR (400 MHz, CDCl3): δ, ppm 12.78 (s, 1H), 7.82 (s, 1H), 7.59–7.57 (d, J = 8.0 Hz, 1H), 7.37–7.33 (m, 1H), 7.12–7.08 (t, J = 8.0 Hz, 1H), 6.89–6.87 (d, J = 8.0 Hz, 1H), 5.89–5.80 (m, 1H), 5.28–5.27 (d, J = 4.0 Hz, 1H), 5.248–5240 (t, J = 1.6 Hz, 1H), 4.39–4.37 (d, J = 8.0 Hz, 1H), 3.30–3.29 (d, J = 4.0 Hz, 3H). 13C NMR (100 MHz, CDCl3): δ, ppm 179.1 (C![[double bond, length as m-dash]](https://www.rsc.org/images/entities/char_e001.gif) S), 161.1 (C
S), 161.1 (C![[double bond, length as m-dash]](https://www.rsc.org/images/entities/char_e001.gif) O), 143.2 (C
O), 143.2 (C![[double bond, length as m-dash]](https://www.rsc.org/images/entities/char_e001.gif) N), 132.1, 131.1, 123.2, 120.6, 118.8, 117.4, 110.0 (aromatic C), 42.1, 31.4 (aliphatic C). ESI-MS m/z = 297.11 [M + Na]+.
N), 132.1, 131.1, 123.2, 120.6, 118.8, 117.4, 110.0 (aromatic C), 42.1, 31.4 (aliphatic C). ESI-MS m/z = 297.11 [M + Na]+.![[thin space (1/6-em)]](https://www.rsc.org/images/entities/char_2009.gif) 800). FT-IR (KBr): ν, cm−1 3458, 3227 (N–H), 1680 (C
800). FT-IR (KBr): ν, cm−1 3458, 3227 (N–H), 1680 (C![[double bond, length as m-dash]](https://www.rsc.org/images/entities/char_e001.gif) O), 1552 (C
O), 1552 (C![[double bond, length as m-dash]](https://www.rsc.org/images/entities/char_e001.gif) N), 1285 (C
N), 1285 (C![[double bond, length as m-dash]](https://www.rsc.org/images/entities/char_e001.gif) S). 1H NMR (400 MHz, DMSO-d6): δ, ppm 12.51 (s, 1H), 9.27–9.26 (d, J = 4.0 Hz, 1H), 7.66–7.64 (d, J = 8.0 Hz, 1H), 7.45–7.41 (t, J = 8.0 Hz, 1H), 7.17–7.10 (m, 2H), 3.20 (s, 3H), 3.09–3.08 (d, J = 4.0 Hz, 3H). 13C NMR (100 MHz, DMSO-d6): δ, ppm 178.0 (C
S). 1H NMR (400 MHz, DMSO-d6): δ, ppm 12.51 (s, 1H), 9.27–9.26 (d, J = 4.0 Hz, 1H), 7.66–7.64 (d, J = 8.0 Hz, 1H), 7.45–7.41 (t, J = 8.0 Hz, 1H), 7.17–7.10 (m, 2H), 3.20 (s, 3H), 3.09–3.08 (d, J = 4.0 Hz, 3H). 13C NMR (100 MHz, DMSO-d6): δ, ppm 178.0 (C![[double bond, length as m-dash]](https://www.rsc.org/images/entities/char_e001.gif) S), 161.2 (C
S), 161.2 (C![[double bond, length as m-dash]](https://www.rsc.org/images/entities/char_e001.gif) O), 143.9 (C
O), 143.9 (C![[double bond, length as m-dash]](https://www.rsc.org/images/entities/char_e001.gif) N), 131.5, 131.2, 123.3, 120.8, 119.6, 110.2 (aromatic C), 31.8, 26.1 (aliphatic C). ESI-MS m/z = 249.25 [M + H]+.
N), 131.5, 131.2, 123.3, 120.8, 119.6, 110.2 (aromatic C), 31.8, 26.1 (aliphatic C). ESI-MS m/z = 249.25 [M + H]+.![[thin space (1/6-em)]](https://www.rsc.org/images/entities/char_2009.gif) 300), 364 (24
300), 364 (24![[thin space (1/6-em)]](https://www.rsc.org/images/entities/char_2009.gif) 800). FT-IR (KBr): ν, cm−1 3463, 3231 (N–H), 1689 (C
800). FT-IR (KBr): ν, cm−1 3463, 3231 (N–H), 1689 (C![[double bond, length as m-dash]](https://www.rsc.org/images/entities/char_e001.gif) O), 1561 (C
O), 1561 (C![[double bond, length as m-dash]](https://www.rsc.org/images/entities/char_e001.gif) N), 1271 (C
N), 1271 (C![[double bond, length as m-dash]](https://www.rsc.org/images/entities/char_e001.gif) S). 1H NMR (400 MHz, DMSO-d6): δ, ppm 12.54 (s, 1H), 9.34–9.33 (d, J = 4.0 Hz, 1H), 7.71–7.69 (d, J = 8.0 Hz, 1H), 7.37–7.26 (m, 6H), 7.17–7.13 (t, J = 8.0 Hz, 1H), 7.04–7.02 (d, J = 8.0 Hz, 1H), 4.90 (s. 2H), 3.11–3.10 (d, J = 4.0 Hz, 3H). 13C NMR (100 MHz, DMSO-d6): δ, ppm 178.1 (C
S). 1H NMR (400 MHz, DMSO-d6): δ, ppm 12.54 (s, 1H), 9.34–9.33 (d, J = 4.0 Hz, 1H), 7.71–7.69 (d, J = 8.0 Hz, 1H), 7.37–7.26 (m, 6H), 7.17–7.13 (t, J = 8.0 Hz, 1H), 7.04–7.02 (d, J = 8.0 Hz, 1H), 4.90 (s. 2H), 3.11–3.10 (d, J = 4.0 Hz, 3H). 13C NMR (100 MHz, DMSO-d6): δ, ppm 178.1 (C![[double bond, length as m-dash]](https://www.rsc.org/images/entities/char_e001.gif) S), 161.2 (C
S), 161.2 (C![[double bond, length as m-dash]](https://www.rsc.org/images/entities/char_e001.gif) O), 142.8 (C
O), 142.8 (C![[double bond, length as m-dash]](https://www.rsc.org/images/entities/char_e001.gif) N), 136.1, 131.4, 130.9, 129.1, 128.1, 127.9, 123.4, 121.0, 119.9, 110.8 (aromatic C), 43.0, 31.8 (aliphatic C). ESI-MS m/z = 347.21 [M + Na]+.
N), 136.1, 131.4, 130.9, 129.1, 128.1, 127.9, 123.4, 121.0, 119.9, 110.8 (aromatic C), 43.0, 31.8 (aliphatic C). ESI-MS m/z = 347.21 [M + Na]+.![[thin space (1/6-em)]](https://www.rsc.org/images/entities/char_2009.gif) 100), 364 (26
100), 364 (26![[thin space (1/6-em)]](https://www.rsc.org/images/entities/char_2009.gif) 600). FT-IR (KBr): ν, cm−1 3468, 3427, 3233 (N–H), 1683 (C
600). FT-IR (KBr): ν, cm−1 3468, 3427, 3233 (N–H), 1683 (C![[double bond, length as m-dash]](https://www.rsc.org/images/entities/char_e001.gif) O), 1559 (C
O), 1559 (C![[double bond, length as m-dash]](https://www.rsc.org/images/entities/char_e001.gif) N), 1281 (C
N), 1281 (C![[double bond, length as m-dash]](https://www.rsc.org/images/entities/char_e001.gif) S). 1H NMR (400 MHz, DMSO-d6): δ, ppm 12.39 (s, 1H), 11.29 (s, 1H), 9.35–9.26 (d, J = 4.0 Hz, 1H), 7.80 (s, 1H), 7.48–7.47 (d, J = 4.0 Hz, 1H), 6.88–6.86 (d, J = 8.0 Hz), 3.10–3.09 (d, J = 4.0 Hz, 3H). 13C NMR (100 MHz, DMSO-d6): δ, ppm 178.0 (C
S). 1H NMR (400 MHz, DMSO-d6): δ, ppm 12.39 (s, 1H), 11.29 (s, 1H), 9.35–9.26 (d, J = 4.0 Hz, 1H), 7.80 (s, 1H), 7.48–7.47 (d, J = 4.0 Hz, 1H), 6.88–6.86 (d, J = 8.0 Hz), 3.10–3.09 (d, J = 4.0 Hz, 3H). 13C NMR (100 MHz, DMSO-d6): δ, ppm 178.0 (C![[double bond, length as m-dash]](https://www.rsc.org/images/entities/char_e001.gif) S), 162.6 (C
S), 162.6 (C![[double bond, length as m-dash]](https://www.rsc.org/images/entities/char_e001.gif) O), 141.6 (C
O), 141.6 (C![[double bond, length as m-dash]](https://www.rsc.org/images/entities/char_e001.gif) N), 133.5, 130.6, 123.5, 122.7, 114.6, 113.4 (aromatic C), 31.7 (aliphatic C). ESI-MS m/z = 313.64 [M]+.
N), 133.5, 130.6, 123.5, 122.7, 114.6, 113.4 (aromatic C), 31.7 (aliphatic C). ESI-MS m/z = 313.64 [M]+.![[thin space (1/6-em)]](https://www.rsc.org/images/entities/char_2009.gif) :
:![[thin space (1/6-em)]](https://www.rsc.org/images/entities/char_2009.gif) 1).
1).
![[thin space (1/6-em)]](https://www.rsc.org/images/entities/char_2009.gif) 100), 376 (20
100), 376 (20![[thin space (1/6-em)]](https://www.rsc.org/images/entities/char_2009.gif) 800), 446 (6900). FT-IR (KBr): ν, cm−1 3464, 3426 (N–H), 1640 (C
800), 446 (6900). FT-IR (KBr): ν, cm−1 3464, 3426 (N–H), 1640 (C![[double bond, length as m-dash]](https://www.rsc.org/images/entities/char_e001.gif) O), 1519 (C
O), 1519 (C![[double bond, length as m-dash]](https://www.rsc.org/images/entities/char_e001.gif) N), 1237 (C
N), 1237 (C![[double bond, length as m-dash]](https://www.rsc.org/images/entities/char_e001.gif) S). ESI-MS m/z = 525.04 [M]+. μ = 2.09 BM.
S). ESI-MS m/z = 525.04 [M]+. μ = 2.09 BM.![[thin space (1/6-em)]](https://www.rsc.org/images/entities/char_2009.gif) 600), 376 (10
600), 376 (10![[thin space (1/6-em)]](https://www.rsc.org/images/entities/char_2009.gif) 400), 447 (6600). FT-IR (KBR): ν, cm−1 3461 (N–H), 1647 (C
400), 447 (6600). FT-IR (KBR): ν, cm−1 3461 (N–H), 1647 (C![[double bond, length as m-dash]](https://www.rsc.org/images/entities/char_e001.gif) O), 1522 (C
O), 1522 (C![[double bond, length as m-dash]](https://www.rsc.org/images/entities/char_e001.gif) N), 1251 (C
N), 1251 (C![[double bond, length as m-dash]](https://www.rsc.org/images/entities/char_e001.gif) S). ESI-MS m/z = 605.10 [M]+. μ = 1.98 BM.
S). ESI-MS m/z = 605.10 [M]+. μ = 1.98 BM.![[thin space (1/6-em)]](https://www.rsc.org/images/entities/char_2009.gif) 100), 382 (8800), 448 (6500). FT-IR (KBr): ν, cm−1 3453 (N–H), 1636 (C
100), 382 (8800), 448 (6500). FT-IR (KBr): ν, cm−1 3453 (N–H), 1636 (C![[double bond, length as m-dash]](https://www.rsc.org/images/entities/char_e001.gif) O), 1525 (C
O), 1525 (C![[double bond, length as m-dash]](https://www.rsc.org/images/entities/char_e001.gif) N), 1220 (C
N), 1220 (C![[double bond, length as m-dash]](https://www.rsc.org/images/entities/char_e001.gif) S). ESI-MS m/z = 553.07 [M]+. μ = 1.95 B.M.
S). ESI-MS m/z = 553.07 [M]+. μ = 1.95 B.M.![[thin space (1/6-em)]](https://www.rsc.org/images/entities/char_2009.gif) 500), 388 (15
500), 388 (15![[thin space (1/6-em)]](https://www.rsc.org/images/entities/char_2009.gif) 900), 440 (5900). FT-IR (KBr): ν, cm−1 3463 (N–H), 1644 (C
900), 440 (5900). FT-IR (KBr): ν, cm−1 3463 (N–H), 1644 (C![[double bond, length as m-dash]](https://www.rsc.org/images/entities/char_e001.gif) O), 1524 (C
O), 1524 (C![[double bond, length as m-dash]](https://www.rsc.org/images/entities/char_e001.gif) N), 1227 (C
N), 1227 (C![[double bond, length as m-dash]](https://www.rsc.org/images/entities/char_e001.gif) S). ESI-MS m/z = 705.13 [M]+. μ = 2.13 BM.
S). ESI-MS m/z = 705.13 [M]+. μ = 2.13 BM.![[thin space (1/6-em)]](https://www.rsc.org/images/entities/char_2009.gif) 500), 380 (10
500), 380 (10![[thin space (1/6-em)]](https://www.rsc.org/images/entities/char_2009.gif) 500), 453 (6600). FT-IR (KBr): ν, cm−1 3470, 3423 (N–H), 1642 (C
500), 453 (6600). FT-IR (KBr): ν, cm−1 3470, 3423 (N–H), 1642 (C![[double bond, length as m-dash]](https://www.rsc.org/images/entities/char_e001.gif) O), 1533 (C
O), 1533 (C![[double bond, length as m-dash]](https://www.rsc.org/images/entities/char_e001.gif) N), 1223 (C
N), 1223 (C![[double bond, length as m-dash]](https://www.rsc.org/images/entities/char_e001.gif) S). ESI-MS m/z = 683.09 [M]+. μ = 2.17 BM.
S). ESI-MS m/z = 683.09 [M]+. μ = 2.17 BM.![[thin space (1/6-em)]](https://www.rsc.org/images/entities/char_2009.gif) :
:![[thin space (1/6-em)]](https://www.rsc.org/images/entities/char_2009.gif) 95) and diluted with phosphate buffer to get required concentrations. 2.5 mL of BSA solution was titrated by successive additions of a 10−6 M stock solution of the complexes using a micropipette. For synchronous fluorescence spectra measurements, the same concentration of BSA and the complexes were used and the spectra were measured at two different Δλ (difference between the excitation and emission wavelengths of BSA) values of 15 and 60 nm.
95) and diluted with phosphate buffer to get required concentrations. 2.5 mL of BSA solution was titrated by successive additions of a 10−6 M stock solution of the complexes using a micropipette. For synchronous fluorescence spectra measurements, the same concentration of BSA and the complexes were used and the spectra were measured at two different Δλ (difference between the excitation and emission wavelengths of BSA) values of 15 and 60 nm.


