DOI:
10.1039/C0NR00473A
(Paper)
Nanoscale, 2010,
2, 2733-2738
Nanocomposites of size-controlled gold nanoparticles and graphene oxide: Formation and applications in SERS and catalysis†
Received
6th July 2010
, Accepted 18th August 2010
First published on
11th October 2010
Abstract
In this paper, we describe the formation of Au nanoparticle-graphene oxide (Au-GO) and -reduced GO (Au-rGO) composites by noncovalent attachment of Au nanoparticles premodified with 2-mercaptopyridine to GO and rGO sheets, respectively, via π–π stacking and other molecular interactions. Compared with in situ reduction of HAuCl4 on the surface of graphene sheets that are widely used to prepare Au-GO composites, the approach developed by us offers well controlled size, size distribution, and morphology of the metal nanoparticles in the metal-GO nanohybrids. Moreover, we investigated surface enhanced Raman scattering (SERS) and catalysis properties of the Au-graphene composites. We have demonstrated that the Au-GO composites are superior SERS substrates to the Au NPs. Similarly, a comparative study on the catalytic activities of the Au, Au-GO, and Au-rGO composites in the reduction of o-nitroaniline to 1,2-benzenediamine by NaBH4 indicates that both Au-GO and Au-rGO composites exhibit significantly higher catalytic activities than the corresponding Au nanoparticles.
1. Introduction
Graphene, a new two-dimensional nanomaterial composed of sp2-bonded carbon atoms, has attracted tremendous attention in recent years due to its unique properties and potential applications.1–3 Graphene is reported to be promising nanoscale building blocks of new functional composite materials.4 As recently demonstrated, graphene has been utilized as burgeoning support to disperse and stabilize metal and metal oxide nanoparticles (NPs), such as Pt, Au, Pd, TiO2, Co3O4, etc.5–11 It is expected that the NPs anchored on graphene sheet potentially exhibit novel catalytic, magnetic, and optoelectronic properties. Among known strategies for preparation of graphene-based materials, utilization of graphite oxide is arguably the most versatile and easily scalable method.12–14 The metal-graphene composites are usually obtained from in situ reduction of metallic salts on graphene oxide (GO) sheets.5,15,16 This synthesis route, however, provides poor control over the particle size and morphology, and thus the properties of the metal-GO composites.16,17 This, to a large extent, limits their applications in those fields that require precise control of particle size, size distribution, and composition.
To address this issue, we have developed an alternative route for preparation of metal-GO/rGO composites in which the size of the metal NPs can be controlled and fine tuned. In our approach, the gold NPs were preformed and then surface modified with aromatic molecules, followed by self-assembly on the graphene oxide sheets via physisorption in the form of π–π stacking, van der Waals forces, and other molecular interactions (the scheme showing the formation of the metal-GO and metal-rGO composites is presented in Fig. 1). The noncovalent approach was previously used by Liu et al.,18 Yang et al.,19 and us20 to load anticancer drugs on GO, and by Geng et al. in collaboration with our group21 to form QD-GO composites for optoelectronic films. Li et al.22 and Hong et al.23 also obtained Au-graphene composites through noncovalent approach. Here, we chose Au NPs as the metal NPs to decorate the GO sheet. We have demonstrated that Au NPs dispersed onto GO sheets show excellent surface enhanced Raman scattering (SERS) and catalytic activities, compared with the corresponding Au NPs. Therefore, our work may provide a general way to control and fine tune the size and morphology of the metal NPs in the metal-GO composites for various applications.
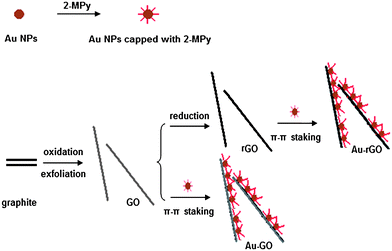 |
| | Fig. 1 Schematic illustration of the synthesis of Au-GO and Au-rGO composites. | |
2. Experimental details
2.1 Preparation of GO
Water soluble GO was prepared by oxidizing graphite according to a modified Hummer's method.24,25 We prepared the aqueous solution of the GO with a concentration of 3.86 mg/mL.
2.2 Synthesis and modification of Au NPs
Au NPs were prepared according to Frens's approach.26 In a typical process, HAuCl4 aqueous solution (100 mL, 2.43 × 10⁻⁴ M) was heated to boiling with vigorous stirring, to which a trisodium citrate solution (0.75 mL, 1%) was added. The mixture was then kept boiling for 15 min. Afterwards, the solution was allowed to cool to room temperature with continuous stirring.
Next, 2-MPy (1 mL, 4.5 × 10⁻³ M) was added to the Au NPs (20 mL) under stirring. The stirring was continued for 12 h. The resulting NPs were then separated from the solution by centrifugation at 13,000 rpm for 20 min and washed with ultrapure water twice to remove the unbound 2-MPy. Thus the Au NPs were conjugated with 2-MPy.27 The resulting product was suspended with ultrapure water (20 mL).
2.3 Synthesis of Au-GO/-rGO composites
The Au-GO and Au-rGO composites were prepared as follows: aqueous solution of GO or rGO (1 mL, 3.86 mg/mL) was added to the aqueous solution of 2-MPy-capped Au NPs (20 mL), stirring for 24 h. The resulting mixture was then separated from the solution by centrifugation at 13,000 rpm for 20 min and washed with ultrapure water twice to remove the residual GO or rGO. The metal-GO or metal-rGO composites were stable for two weeks.
2.4 Preparation of SERS substrates
The Au NPs and the Au-GO composites were adjusted to the same weight concentration in terms of the Au nanoparticles (2.43 × 10⁻⁴ M). Next, 1 μL of the Au and Au-GO composites were dropped onto a silicon substrate, respectively, and blew dry. Next, 1 μL of p-aminothiophenol (PATP) in water (1 mM) was dropped onto these SERS substrates, respectively, and blew dry for SERS measurement.
The reduction of o-nitroaniline by NaBH4 was chosen as a model reaction to probe catalytic activities of the prepared Au NPs, Au-GO, and Au-rGO composites. The NPs and the composites dispersed in water (10 mL, 0.1 mg/mL) were added to a NaBH4 aqueous solution (10 mL, 1.2 M), and the mixture was stirred for 30 min at room temperature, respectively. o-Nitroaniline aqueous solution (10 mL, 3.4 × 10⁻³ M) was added and the resulting mixture was stirred at room temperature until the yellow solution became colorless. The reaction progress was monitored by taking a small portion of the reaction mixture at certain time intervals and measuring the UV-vis spectra.
2.6 Characterization of materials
UV-vis spectra were collected on a Lambda 25 UV-vis-near infrared spectrophotometer. Morphological features of the Au nanoparticles and their GO composites were characterized by Tecnai G2 F20 S-Twin transmission electron microscopy (TEM) and Quanta 400 FEG field emission scanning electron microscope (SEM). Samples for TEM were prepared by placing a drop of water dispersion onto a carbon-coated copper grid and dried at room temperature. Raman spectra were obtained using a confocal microprobe Raman system (HR 800) equipped with a holographic notch filter and a CCD detector. A long working distance 50× objective was used to collect the Raman scattering signal. The size of the laser spot is 1.7 μm. The excitation wavelength was 632.8 nm from a He-Ne laser.
3. Results and discussion
3.1 Formation and characterization of Au-GO composites
In our approach, the Au NPs of two sizes (20 nm and 40 nm) were prepared firstly, followed by surface modification by 2-MPy. Next, a simple mixing of the 2-MPy-capped Au with GO or rGO aqueous solution and a subsequent separation yields water soluble Au-GO and Au-rGO composites. Fig. 2 depicts TEM images of Au-GO composites in which the Au NPs are 40 nm and 20 nm in size, respectively. It can be seen that almost all the Au NPs were anchored on the GO sheets, indicating the strong interaction between the NPs and the GO. This is achieved mainly through π–π stacking between the big delocalized sp2 carbon structure of graphene and the aromatic molecules (2-MPy ligand) bound to the Au NPs. To confirm this, we mixed the GO with the Au NPs without surface modification by 2-MPy, and did not observe any Au NPs anchored on the GO sheets, indicating the important role pyridine molecules play in the binding of Au to the GO sheet. Since the carbon film (7–10 nm) that was coated on the copper grid in the TEM is much thicker than GO (ca. 1 nm), it is difficult to obtain high contrast images of GO, but the GO is still visible in the TEM images of the bare GO and Au-GO samples (Fig. 2). It is clear from the TEM images in Fig. 2 that the Au NPs formed some aggregates on the GO surface. It is well known that aggregation of the metal NPs significantly affects the SERS activity, which we will discuss in the following section.
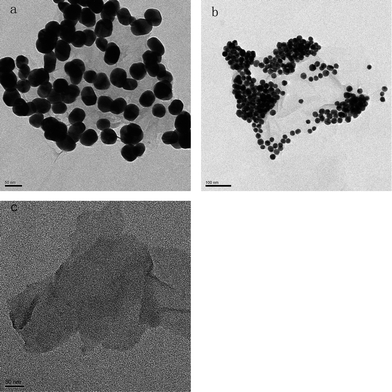 |
| | Fig. 2 TEM images of (a) 40 nm Au NPs, (b) 20 nm Au NPs deposited onto GO sheets, and (c) GO. | |
The binding of GO with the Au NPs is also supported by UV-vis spectral analysis (Fig. 3). The broadening and red-shift of the plasmon band of the Au NPs in the Au-GO composites, to that of the corresponding Au NPs, indicate formation of aggregation of the Au NPs on the GO sheets, in consistence with the TEM result.
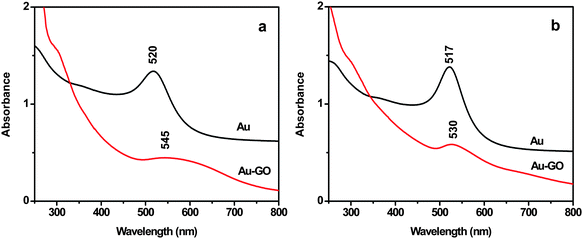 |
| | Fig. 3 UV-vis spectra of aqueous solution of (a) 40 nm Au NPs and (b) 20 nm Au NPs before and after attachment to the GO sheet. | |
3.2 SERS activity of Au-GO composites
It is well known that Au NPs in colloid solution and in dry state exhibit a strong SERS effect.28 We investigated the SERS activity of Au-GO composites (40 nm Au NPs) and compared it with that of the corresponding Au NPs. Fig. S1 of the ESI† depicts the SEM images of Au nanoparticles and Au-GO composites on silicon in SERS measurement. It is clear from the SEM images that the Au NPs formed some aggregates on the GO surface. But it is difficult to visualize the GO sheets from the SEM image. Fig. 4a shows the SERS spectra of the Au NPs capped by 2-MPy at an excitation wavelength of 632.8 nm. The peaks at 1000 cm−1, 1049 cm−1, 1082 cm−1, 1116 cm−1, 1230 cm−1, 1277 cm−1, 1415 cm−1, 1551 cm−1 and 1579 cm−1 are due to vibration modes of the 2-MPy molecule.29 These peaks, interestingly, disappeared when the Au NPs were anchored on the GO sheet (Fig. 4b), the reason for which is still unclear and is currently under investigation in our group. Instead, only two prominent peaks at 1330 cm−1 and 1600 cm−1, assignable to the D and G bands of graphene, appear.30 Consequently, the Raman features of the Au-GO makes investigation of Raman probe molecules convenient and without interference from the 2-MPy ligand.
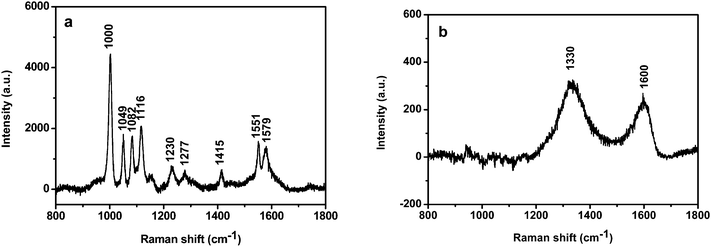 |
| | Fig. 4 SERS spectra of the 40 nm Au NPs capped with 2-MPy (a) before and (b) after attachment to the GO surface. | |
To investigate the SERS activity of the Au-GO, p-aminothiophenol (PATP) was used as a SERS probe because of its well-established Raman features and larger Raman scattering cross section.31Fig. 5 displays the SERS spectra for 1 mM PATP with the Au NPs and Au-GO composites as a SERS substrate, respectively. Considering the difference of the focus point between the two different substrates, we calibrated the first band of silicon (520.6 cm−1). We chose two methods to check the reproducibility of the SERS measurement: first, recording spectra from the different spots of the same substrate; second, taking SERS spectra with different batches of the samples. The difference is very small and the relative standard deviation is within 20%, suggesting good reproducibility of the SERS measurement in our work. It is noticed that the SERS intensity of the PATP on the Au-GO composites is much stronger than on the Au NPs with the same concentration of PATP. It is reasonable to think that the Au NPs on the Si substrate are isolated, which results in few SERS “hot spots” among the Au NPs, while the Au NPs on the GO nanoplatelets are aggregated (Fig. 2 and 3), leading to a coupled electromagnetic (EM) effect that is responsible for a significant enhanced Raman scattering of the PATP molecules. Although there is some interference of GO bands, the b2 modes at 1432, 1390 and 1140 cm−1 and the a1 modes at 1004, 1074 and 1576 cm−1 due to the vibration modes of PATP are clearly seen in the case of the Au-GO substrate (Fig. 5). It is reasonable to think that the coupled EM field caused by aggregation of the Au NPs on the GO surface, and the strong electronic interactions of the Au NPs and the GO sheet are mainly responsible for the enhanced Raman effect. Recently Liu et al.32 reported enhanced Raman with graphene as a SERS active substrate. A more detailed study is desired to understand the contribution of the GO to the observed SERS with Au-GO as the substrate in our experiment. We checked the SERS activity of the aggregated Au NPs using PATP as SERS probes, and compared it with that of the Au-GO composites. Although we observed SERS signals of PATP from the aggregated Au NPs, the Raman intensity is significantly weaker than that from the Au-GO (Fig. S2 of the ESI†).
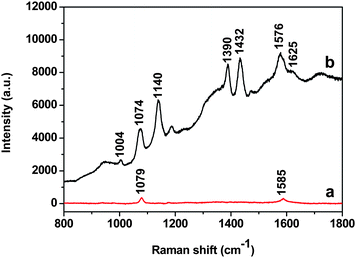 |
| | Fig. 5 SERS spectra of PATP using (a) the 40 nm Au NPs and (b) the corresponding Au-GO composites as SERS substrates, respectively. | |
3.3 Catalytic behavior of Au, Au-GO and Au-rGO composites
We have made a comparative study on the catalytic behaviors of the 40 nm Au NPs, and their GO, and rGO composites, with respect to the reduction of o-nitroaniline to 1,2-benzenediamine by NaBH4. The reduction reaction does not occur without coinage metals such as gold, silver and copper.33
The peak at 410 nm due to o-nitroaniline in the UV-vis spectra was employed to monitor the reaction progress. This peak decreases with the reaction time, and completely diminishes when all the o-nitroaniline is converted to 1,2-benzenediamine. In the presence of the Au NPs catalyst, it takes about 18 min for the reduction reaction to complete. While using the Au-GO catalyst, the reaction lasts only about 1.5 min (Fig. 6). It is noticed that adding NaBH4 to the GO solution yields a black insoluble suspension on the top of the solution (Fig. 7 (b)), which was caused by reduction of GO to insoluble rGO by NaBH4. The suspended Au-GO still displays superior catalytic activity to the metal NPs (18 min and 1.5 min for the Au and Au-GO, respectively) (Fig. 6). It is expected that the catalytic performance can be further improved if the Au-GO catalyst is dispersed well in the reaction solution. With this in mind, we first reduced the GO to rGO by hydrazine according to the literature.34 Thus, the prepared rGO is well dispersed in aqueous solution. The Au NPs are subsequently deposited on the water-soluble rGO. The reduction reaction, surprisingly, was completed in about 10 s in the presence of the water-soluble Au-rGO, clearly evidenced by the complete disappearance of the band at 410 nm (Fig. 6). The color changes for the reduction solutions with 3 different catalysts in Fig. 7 are in good consistence with the UV-vis results discussed above. Then we investigated the kinetics of the reduction reaction in the presence of three catalysts, Au NPs, Au-GO, and Au-rGO composites, respectively. Ct, the concentration of o-nitroaniline at time t, is calculated based on absorbance At at 410 nm by establishing a standard work curve. The linear relationship of 1/Ctversus time is observed for the Au, Au-GO, and Au-rGO catalysts, respectively (Fig. 8), revealing that the reduction reactions with each of the three catalysts follow second-order kinetics. The rate constant (k) for the reaction with Au catalyst is estimated to be 0.0271 l mol−1 s−1. The k for the Au-GO and Au-rGO catalysts are 0.062 l mol−1 s−1 and 0.1176 l mol−1 s−1, being 2.3 times and 4.3 times, respectively, that of the Au catalysts. Inspection of our catalysis data clearly indicates that for the reduction of o-nitroaniline to 1,2-benzenediamine by NaBH4, the catalytic activity increases in the order of the Au NPs, the Au-GO composites, and the Au-rGO composites. In addition, we studied catalytic activities of the aggregated Au NPs and Au-active carbon composites (Au/C), with respect to the reduction of o-nitroaniline by NaBH4. It takes about 30 min and 3 min for the reduction reaction to complete with the aggregated Au NPs and Au/C composites as catalyst, respectively (Fig. S3 and S4 of the ESI†), which are significantly slow compared with the Au-GO and Au-rGO catalytic reduction.
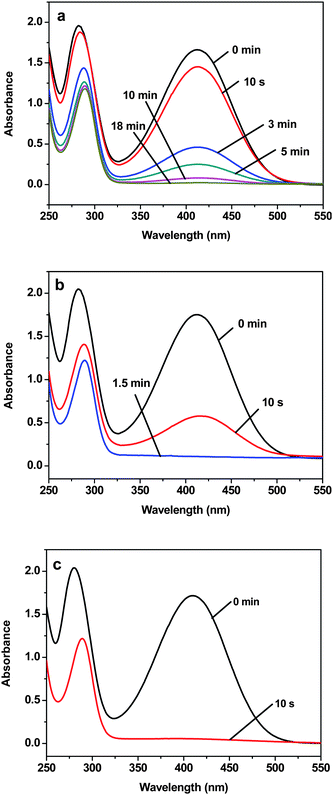 |
| | Fig. 6 UV-vis spectra of aqueous solution of o-nitroaniline and NaBH4 in the presence of the catalyst: (a) 40 nm Au NPs, (b) Au-GO, and (c) Au-rGO, respectively, measured at different time intervals. | |
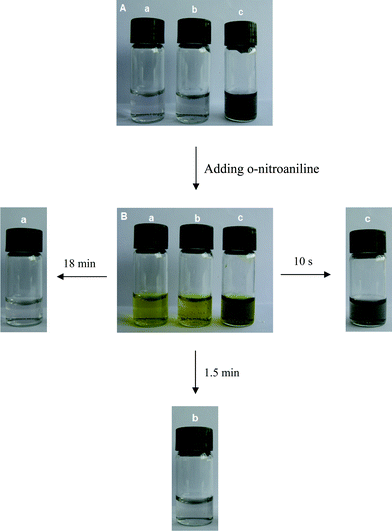 |
| | Fig. 7 Photos of the reaction solution containing reducing agent NaBH4 and the catalyst (a) Au NPs, (b) Au-GO, and (c) Au-rGO, respectively, (A) before and (B) after adding o-nitroaniline. | |
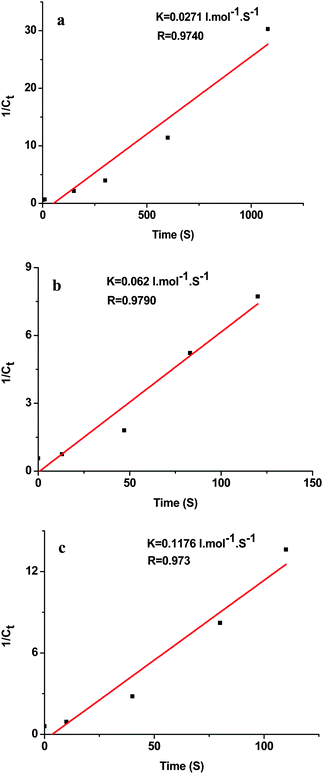 |
| | Fig. 8 Plot of 1/Ctversus time for the reduction reaction with the catalyst (a) 40 nm Au NPs, (b) Au-GO, and (c) Au-rGO, respectively. | |
Similar enhancement in catalytic activity was observed previously for metal catalysts supported on other carbon nanomaterials such as nanofibers.34 It was concluded from these studies that catalyst supports may induce electronic perturbations in the metallic component, and this is even more significant in the case of conductive materials like graphite nanofibers, which dramatically altered the catalytic performance of the metals.35 In this context, the observed high catalytic activities for both the Au-GO and Au-rGO composites in our experiment can be explained in terms of strong metal–graphene interactions, and electron transfer between the Au NPs and the two-dimensional sheet of the large sp2-hybridized carbon, which, may affect the chemical nature of the o-nitroaniline adsorbed onto the metal surface, and accordingly, alter the catalytic performance of the metal particles. Pyridine molecules, the ligand of the metal NPs, through which the metal NPs contact the graphene surface, may facilitate the electron transfer between the metal and the graphene.21 All these lead us to speculate that the electronic interactions between the metal and graphene are largely responsible for high catalytic activities of the Au-GO and Au-rGO. Furthermore, it is very likely that the significantly improved electrical conductivity of rGO leads to dramatically enhanced catalytic activity compared to the metal dispersed on the GO surface. Most recently Jasuja and colleagues36 reported enhanced catalytic and SERS performance of Au-GO nanocomposites prepared by microwave-reduced metal NPs on graphene oxide. They explained the improved catalytic behavior of the metal-GO composites in terms of enhanced density of accessible catalytic sites of the metal NPs. Since our approach to formation of Au-GO is quite different from theirs, further work to elucidate the observed excellent catalytic and SERS activities for the Au-GO and/or Au-rGO compared to their Au NPs is desired.
4. Conclusions
In conclusion, we prepared Au-GO and Au-rGO composites by a simple physisorption method. The approach we developed can be used to prepare various metal-GO composites in which the composition, size and size distribution can be fine tuned easily. We further demonstrated that the Au NPs dispersed on the GO and rGO supports exhibit excellent SERS and catalytic performance compared with the metal nanoparticles alone.
5. Acknowledgements
Financial support of this work was provided by Natural Science Foundation of China (No. 20873090), National Basic Research Program of China (2010CB933504), and Innovation Project of CAS (KJCX2.YW.M12). The assistance with the instrumentation from Platform for Characterization and Test at SINANO is acknowledged.
References
- A. B. Bourlions, D. Gournis, D. Petridis, T. Szabó, A. Szeri and I. Dékány, Langmuir, 2003, 19, 6050 CrossRef CAS.
- A. K. Geim, Science, 2009, 324, 1530 CrossRef CAS.
- Y. B. Zhang, Y. W. Tan, H. L. Stormer and P. Kim, Nature, 2005, 438, 201 CrossRef CAS.
- Y. J. Gan, L. T. Sun and F. Banhart, Small, 2008, 4, 587 CrossRef CAS.
- C. Xu, X. Wang and J. W. Zhu, J. Phys. Chem. C, 2008, 112, 19841 CrossRef CAS.
- G. Williams, B. Seger and P. V. Kamat, ACS Nano, 2008, 2, 1487 CrossRef CAS.
- C. Xu, X. Wang, J. W. Zhu, X. J. Yang and L. J. Lu, J. Mater. Chem., 2008, 18, 5625 RSC.
- T. Cassagneau and J. H. Fendler, J. Phys. Chem. B, 1999, 103, 1789 CrossRef CAS.
- Y. C. Si and E. T. Samulski, Chem. Mater., 2008, 20, 6792 CrossRef CAS.
- S. M. Paek, E. Yoo and I. Honma, Nano Lett., 2009, 9, 72 CrossRef CAS.
- R. Muszynski, B. Seger and P. V. Kamat, J. Phys. Chem. C, 2008, 112, 5263 CrossRef CAS.
- S. Stankovich, D. A. Dikin, G. H. B. Dommett, K. M. Kohlhaas, E. J. Zimney, E. A. Stach, R. D. Piner, S. T. Nguyen and R. S. Ruoff, Nature, 2006, 442, 282 CrossRef CAS.
- G. Eda, G. Fanchini and M. Chhowalla, Nat. Nanotechnol., 2008, 3, 270 CrossRef CAS.
- S. Park, K. S. Lee, G. Bozoklu, W. W. Cai, S. T. Nguyen and R. S. Ruoff, ACS Nano, 2008, 2, 572 CrossRef CAS.
- G. Goncalvest, P. A. A. P. Marques, C. M. Granadeiro, H. I. S. Nogueira, M. K. Singh and J. Grácio, Chem. Mater., 2009, 21, 4796 CrossRef CAS.
- X. Z. Zhou, X. Huang, X. Y. Qi, S. X. Wu, C. Xue, F. Y. C. Boey, Q. Y. Yan, P. Chen and H. Zhang, J. Phys. Chem. C, 2009, 113, 10842 CrossRef CAS.
- B. S. Kong, J. Geng and H. T. Jung, Chem. Commun., 2009,(16), 2174 RSC.
- Z. Liu, J. T. Robinson, X. M. Sun and H. J. Dai, J. Am. Chem. Soc., 2008, 130, 10876 CrossRef CAS.
- X. Y. Yang, X. Y. Zhang, Z. F. Liu, Y. F. Ma, Y. Huang and Y. S. Chen, J. Phys. Chem. C, 2008, 112, 17554 CrossRef CAS.
- L. M. Zhang, J. G. Xia, Q. H. Zhao, L. W. Liu and Z. J. Zhang, Small, 2010, 6, 537 CrossRef CAS.
- X. M. Geng, L. Niu, Z. Y. Xing, R. S. Song, G. T. Liu, M. T. Sun, G. S. Cheng, H. J. Zhong, Z. H. Liu, Z. J. Zhang, L. F. Sun, H. X. Xu, L. Lu and L. W. Liu, Adv. Mater., 2010, 22, 638 CrossRef CAS.
- F. H. Li, H. F. Yang, C. S. Shan, Q. X. Zhang, D. X. Han, A. Ivaska and L. Niu, J. Mater. Chem., 2009, 19, 4022 RSC.
- W. J. Hong, H. Bai, Y. X. Xu, Z. Y. Yao, Z. Z. Gu and G. Q. Shi, J. Phys. Chem. C, 2010, 114, 1822 CrossRef CAS.
- W. S. Hummers and R. E. Offeman, J. Am. Chem. Soc., 1958, 80, 1339 CrossRef CAS.
- N. I. Kovtyukhova, P. J. Ollivier, B. R. Martin, T. E. Mallouk, S. A. Chizhik, E. V. Buzaneva and A. D. Gorchinskiy, Chem. Mater., 1999, 11, 771 CrossRef CAS.
- G. Frens, Nature Phys.Sci., 1973, 24, 20.
- Y. S. Shon and E. Cutler, Langmuir, 2004, 20, 6626 CrossRef CAS.
- G. Chumanov, K. Sokolov, B. W. Gregory and T. M. Cotton, J. Phys. Chem., 1995, 99, 9466 CrossRef CAS.
- J. A. Baldwin, B. Vlčková, M. P. Andrews and I. S. Butler, Langmuir, 1997, 13, 3744 CrossRef CAS.
- F. Tuinstra and J. L. Koenig, J. Chem. Phys., 1970, 53, 1126 CrossRef CAS.
- K. Kim and H. S. Lee, J. Phys. Chem. B, 2005, 109, 18929 CrossRef CAS.
- X. Ling, L. M. Xie, Y. Fang, H. Xu, H. L. Zhang, J. Kong, M. S. Dresselhaus, J. Zhang and Z. F. Liu, Nano Lett., 2010, 10, 553 CrossRef CAS.
- K. Kamata, Y. Lu and Y. N. Xia, J. Am. Chem. Soc., 2003, 125, 2384 CrossRef CAS.
- D. Li, M. B. Müller, S. Gilje, R. B. Kaner and G. G. Wallace, Nat. Nanotechnol., 2008, 3, 101 CrossRef CAS.
- A. Chambers, T. Nemes, N. M. Rodriguez and R. T. K. Baker, J. Phys. Chem. B, 1998, 102, 2251 CrossRef CAS.
- K. Jasuja, J. Linn, S. Melton and V. Berry, J. Phys. Chem. Lett., 2010, 1, 1853 Search PubMed.
|
| This journal is © The Royal Society of Chemistry 2010 |
Click here to see how this site uses Cookies. View our privacy policy here. 


