
 Open Access Article
 This Open Access Article is licensed under a
 Creative Commons Attribution 3.0 Unported Licence
Mobile origami immunosensors for the rapid detection of urinary tract infections†
Cristina
Adrover-Jaume
 ab,
Estrella
Rojo-Molinero
c,
Antonio
Clemente
*a,
Steven M.
Russell
a,
Javier
Arranz
de,
Antonio
Oliver
c and
Roberto
de la Rica
*ab
ab,
Estrella
Rojo-Molinero
c,
Antonio
Clemente
*a,
Steven M.
Russell
a,
Javier
Arranz
de,
Antonio
Oliver
c and
Roberto
de la Rica
*ab
aMultidisciplinary Sepsis Group, Health Research Institute of the Balearic Islands (IdISBa), Spain. E-mail: roberto.delarica@ssib.es; antonio.clemente@ssib.es
bDepartment of Chemistry, University of the Balearic Islands, Cra. de Valldemossa km 7.5, 07021, Palma de Mallorca, Spain
cServicio de Microbiología, Hospital Son Espases, Health Research Institute of the Balearic Islands (IdISBa), Palma de Mallorca, Spain
dEscola Graduada Health Center, Mallorca Primary Care Department, Balearic Health Service, Spain
eInfectious Diseases in Primary Care Group (GMISBAL), Health Research Institute of the Balearic Islands (IdISBa), Spain
First published on 6th October 2020
Abstract
Urinary tract infections (UTI) have a high prevalence and can yield poor patient outcomes if they progress to urosepsis. Here we introduce mobile origami biosensors that detect UTIs caused by E. coli at the bedside in less than 7 minutes. The origami biosensors are made of a single piece of paper that contains antibody-decorated nanoparticles. When the urine sample contains E. coli, the biosensors generate colored spots on the paper strip. These are then quantified with a mobile app that calculates the pixel intensity in real time. The tests are highly specific and do not cross-react with other common uropathogens. Furthermore, the biosensors only yielded one false negative result when queried with a panel containing 57 urine samples from patients, which demonstrates that they have excellent sensitivity and specificity. This, along with the rapid assay time and smartphone-based detection, makes them useful for aiding in the diagnosis of UTIs at the point of care.
Introduction
About 50% of the population will suffer a urinary tract infection (UTI) at least once during their lifetime.1 Complications such as urinary stones, indwelling catheters and surgeries considerably increase the risk of urosepsis, which has a high mortality (20%).1 Furthermore, UTIs represent a considerable healthcare expenditure, costing about 2.8 billion USD in 2011 in the US alone.2 The vast majority of UTIs originate from pathogens in the Enterobacteriaceae family, and in more than 80% of cases are caused by E. coli.3 Urine culture, which identifies the bacterium responsible for the infection as well as the pathogen load, is the gold standard method to diagnose symptomatic UTIs. Bacteriological culture can take several days to be completed, and therefore cannot be used to diagnose UTIs rapidly. Urine strips or dipsticks, which detect nitrite-producing bacteria as well as leukocytes (pyuria), are commonly used to aid in the rapid diagnosis of UTIs. However, the results of these tests are not always reliable. Studies in symptomatic female patients have shown that the nitrite test has a low diagnostic sensitivity (53–66%) and variable specificity (75–95%) when performed at the point of care.3 Detecting the leukocyte esterase yields better sensitivity for diagnosing UTIs (88–96%), but very low specificity (16–37%).3 Furthermore, the urine strip cannot identify the pathogen responsible for the infection. This information, which is standardly obtained through longsome culture methods, could help clinicians personalize treatments according to local antimicrobial resistance patterns.4,5In this manuscript we introduce a new tool for diagnosing UTIs based on the rapid detection of bacteria in urine with mobile biosensors (i.e. biosensors interfaced with a mobile device). The biosensors consist of a lab-on-chip device made of a single piece of paper. This paper biosensor is folded following a simple origami pattern in order to enable all of the analytical steps required to detect the target6–9 Our device is one of the few origami immunosensors that is entirely made of cellulose, it does not require using other materials in order to store antibody-decorated nanoparticles.10,11 Instead, it uses polystyrene sulfonate (PSS) in order to fabricate nanoparticle reservoirs directly on filter paper.12 This reservoir is separated from the detection area by a wax barrier, which is easily drawn manually without using wax printers. The immunosensors were designed in order to detect pathogens above the infectious threshold as soon as possible and with the easiest analytical procedure, since these are the key points that make a biosensor useful in the doctor's office, where there is limited time to diagnose and prescribe therapies. Accordingly, all analytical steps were designed to reduce the turnaround assay time below 10 min and to detect pathogens with a concentration of 105 cells per mL or higher (clinical infectious threshold1) without diluting the sample, since this procedure would be cumbersome at the bedside.
The origami sequence that made this possible is shown in Fig. 1. First, a drop of urine is added and dried for 30 s (Fig. 1A). This method physically adsorbs the pathogens and other components of the urine to the cellulose matrix. After adding a blocking solution for less than 10 s, the biosensor is folded in order to transfer antibody-covered gold nanoparticles from a reservoir to the capture area for 5 min (Fig. 1B). After a quick washing procedure, a colored spot appears on the paper. The pixel intensity of the colored spot correlates to the biospecific recognition of the pathogen by the antibody (Fig. 1C). In this detection scheme the color is generated by the localized surface plasmon resonance (LSPR) of the gold nanoparticles, which is centered around 531 nm (nanoparticle size ca. 40 nm, Fig. S1†). Finally, the pixel intensity is quantified with a mobile app previously developed in our laboratory.13 The app automatically finds the region of interest and compensates for changes in illumination while at the same time guiding the user to the correct positioning of the smartphone with respect to the paper biosensor, all within a few seconds (Fig. 1D). With our app, there is no need to use external attachments or light-tight boxes for quantifying color consistently.14 The resulting origami mobile immunosensors were able to detect E. coli above the clinical infectious threshold in patient samples with a total assay time under 7 min. This rapid assay time, along with the minimal infrastructure requirements, make the biosensors ideal for clinical decision-making in a wide array of healthcare environments, from diagnosing UTIs in primary care to identifying the pathogen responsible for a urosepsis in the ICU. The biosensors were tested against 5 other uropathogens as well as with a panel of 57 different patient samples. Compared to other uropathogen immunosensors proposed in the literature, our biosensors yield results faster and only require an unmodified smartphone as a reader.15–21 Furthermore, they do not require a sample precondition step.14 They are also faster and easier to use than biosensors based on detecting nucleic acids.22–25 Moreover, the biosensors provide more information about the type of pathogen causing the UTI compared to the traditional urine strip. While this information is limited to a single pathogen at the moment, it has the potential to be expanded into a multi-sensor design including multiple reservoirs with antibody-decorated nanoparticles against different types of pathogens.
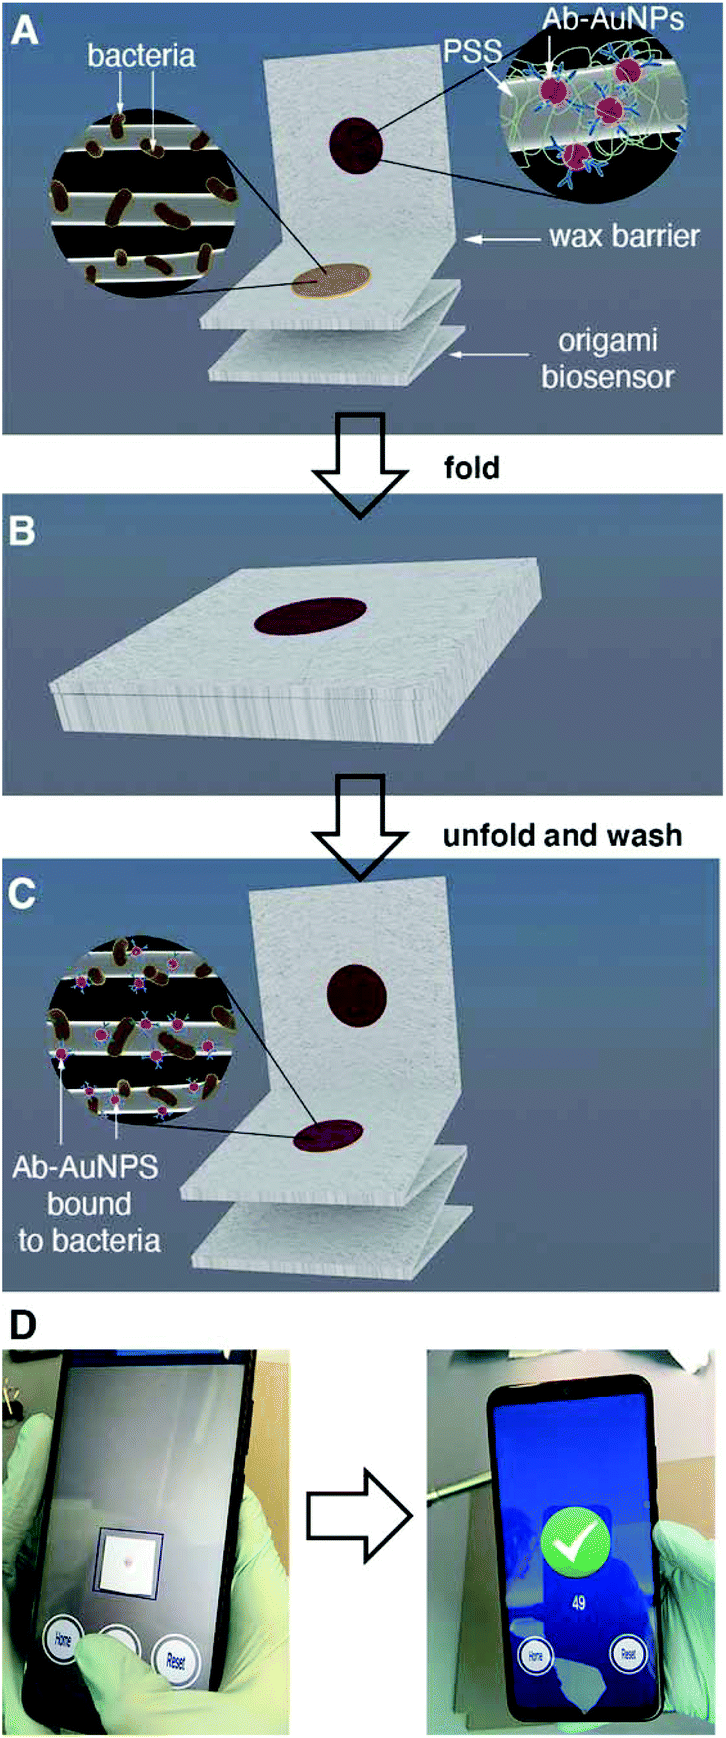 | ||
| Fig. 1 Schematic representation of the mobile origami biosensors. (A) Urine samples are dried on a paper strip with a reservoir containing antibody-decorated gold nanoparticles (Ab-AuNPs), and polystyrene sulfonate (PSS) to avoid irreversible interactions with the paper; (B) after folding the paper the nanoparticles are transferred to the detection area where they specifically recognize E. coli; (C) after washing, a colored spot remains on the paper whose pixel intensity depends on the concentration of E. coli in the sample; (D) the pixel intensity is calculated with a smartphone app within seconds. | ||
Experimental
Materials
Gold(III) chloride, sodium citrate tribasic dihydrate, poly(ethylene glycol) 2-mercaptoethyl ether acetic acid (thiol-PEG-acid) 2100, N-hydroxysulfosuccinimide sodium salt, N-(3-dimethylaminopropyl)-N′-ethylcarbodiimide hydrochloride (EDC), avidin from egg white, poly(sodium 4-styrenesulfonate) (PSS), O-(2-aminoethyl)polyethylene glycol 3000 (biotin-PEG), carboxyfluorescein diacetate succinimidyl ester (CFSE), and Tween-20 were purchased from Sigma Aldrich. Biotinylated polyclonal anti-E. Coli serotype O/K developed in goat was obtained from Thermo Fisher Scientific. Albumin from Bovine Serum (BSA, protease-free) was purchased from VWR Chemicals. PBS is phosphate buffered saline pH 7.4. PBST refers to PBS modified with 0.1% Tween. PBS-BSA is PBS containing 5 mg mL−1 BSA.Biosensor fabrication
The protocol for growing gold nanoparticles with a diameter of ca. 40 nm has been described elsewhere.13 The nanoparticles were stabilized against salt-induced aggregation by substituting citrate molecules on their surface for thiol-PEG-acid ligands, and the resulting carboxylate moieties were used to covalently bind avidin molecules through amidation (EDC/sulfo-NHS coupling) with a previously described method.13 Antibody-decorated nanoparticles were obtained by adding 10 μL of biotinylated antibodies (4–5 mg mL−1) to 100 μL of avidin-modified gold nanoparticles ([Au] = 125 mM) for 1 hour.12 When required, biotin-PEG was added at final concentration of 0.1 mM in order to block free avidin binding sites. Then the nanoparticles were centrifuged (7000 rpm, 6 min), the supernatant was removed, and the pellet was resuspended in 100 μL of PBST twice. Finally, the nanoparticles were resuspended in 20 μL of PBST in order to yield antibody-decorated nanoparticles ([Au] = 625 mM).Paper biosensors were made of Whatman #41 paper sheets cut into 2 × 8 cm strips. The strips were subdivided into four 2 × 2 cm squares that could be folded like an accordion as shown in Fig. 1A.26 Next a wax barrier was added between the top square and the rest of the strip by placing the paper substrate on a hot plate and drawing a line with a piece of paraffin. The heat from the plate melts the paraffin and helps it penetrate the paper therefore creating a hydrophobic wax barrier after cooling (Fig. S3†). Next, 30 μL of 30% PSS was added in the center of the top square and left to dry at room temperature for at least 30 min. Finally, reservoirs containing anti E. coli-decorated nanoparticles were obtained by adding 1 μL of the colloidal suspension in the middle of the dried PSS spot and letting it dry at room temperature for 10 min.12 The resulting biosensors could be stored in vacuum sealed bags at 4 °C for at least 14 days without noticeable loss in performance (Fig. S4 in ESI†).
Patient samples and bacteriological culture
Anonymized patient samples were obtained from the Microbiology Department at Son Espases University Hospital after obtaining approval from the local ethics committee (protocol IB 4005/19 PI). Informed consent was waived by the ethics committee as these samples were leftovers from clinical diagnosis that would otherwise be discarded. The reference strains Escherichia coli ATCC25922 and Enterococcus faecalis ATCC 29212, along with Klebsiella pneumoniae, Enterobacter cloacae, Proteus mirabilis, and Streptococcus viridans group from a collection of clinical isolates were used in this study. First, each strain was grown in blood agar to check purity. Isolates were then inoculated in 50 mL tubes containing 10 mL of Luria Bertani (LB) broth and incubated overnight at 37 °C with shaking at 180 rpm in aerobic conditions.Detection of bacteria
The following experiments were performed to demonstrate that the paper substrate captures E. coli cells in Fig. 2. First, a 107 cells per mL bacterial suspension in Luria–Bertani broth (LB) was stained with 50 μM CFSE for 30 min at 37 °C. Then bacteria were pelleted by centrifugation at 4000 rpm for 10 min. After washing 3 times with PBS by centrifugation at 7000 rpm for 4 min, bacteria were finally resuspended in PBS to obtain CFSE-labeled E. coli with a concentration of 109 cells per mL. Subsequently, 10 μL of non-labeled or CFSE-labeled bacteria at 109 cells per mL were spotted on the receiving paper substrate and left to dry at room temperature for 10 min. Finally, paper substrates were rehydrated with distilled water and the CFSE fluorescence was measured immediately with a Typhoon FLA 9500 laser scanner (General Electric) using the blue LD laser (473 nm).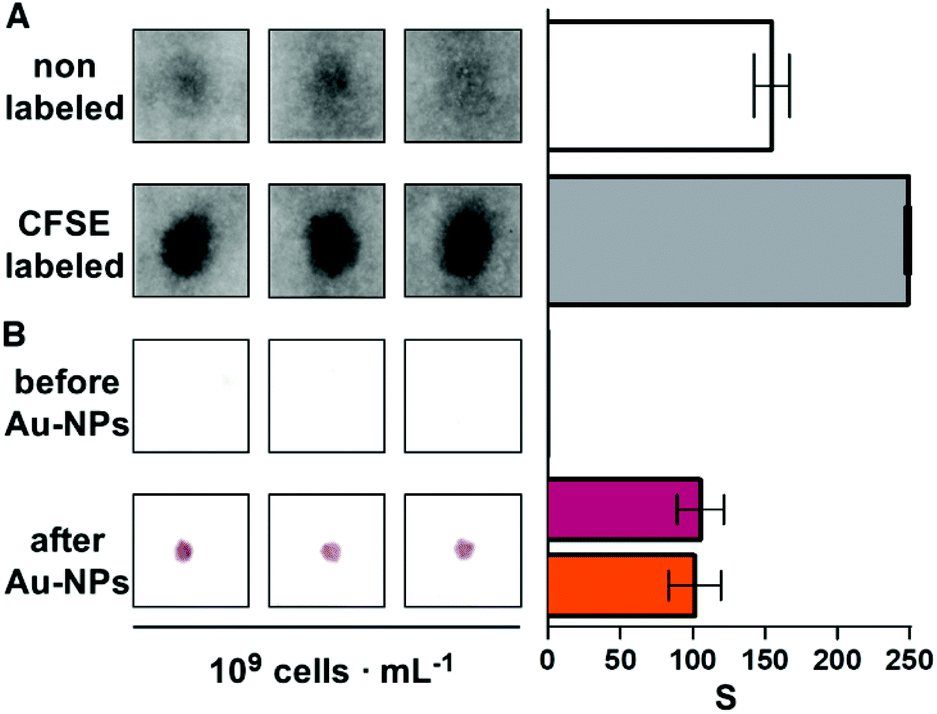 | ||
| Fig. 2 Adsorption of bacteria to paper substrates; scanned images (triplicate) and densitometric signal (S) for E. coli cells trapped in the paper before and after labelling them with (A) CFSE or (B) antibody-decorated gold nanoparticles. In (B), pink bars were quantified by scanning the paper biosensor with a desktop scanner and quantifying the pixel intensity with Image J whereas the orange bar was obtained by means of real-time detection with our smartphone app. Error bars are the standard deviation (n = 3). | ||
Detection of bacteria with the proposed origami biosensors proceeded as follows. First, 10 μL of the sample was added to the second square of the strip and dried with a hairdryer for 30 seconds (Fig. 1A and Fig. S2†). Afterwards, the last three squares of the paper strip were folded and 1 mL of PBS-BSA was added. Subsequently, antibody-decorated nanoparticles were transferred by folding the top square (Fig. 1B). This brings together the nanoparticle reservoir and the detection area where the bacteria are bound. After pressing with a clamp for 5 min, the reservoir is peeled off of the detection platform and the receiving paper is washed 3 times with 1 mL of PBST. The colorimetric signal is measured immediately afterwards with the mobile app.13
Experiments to determine whether bacteria interact specifically with avidin or streptavidin were conducted as follows. Solutions containing E. coli and E. faecalis (100 μL) at different concentrations in PBS were dried onto 96-well ELISA plates (Nunc MaxiSorp, Thermo Scientific) by means of overnight incubation at 37 °C on a heating plate. Next, plates were washed 3 times with PBST, blocked during two hours at room temperature (RT) with PBS-BSA and washed again 3 times. Then, 100 μL of streptavidin-HRP diluted 1![[thin space (1/6-em)]](https://www.rsc.org/images/entities/char_2009.gif) :3000 in PBST was added for 30 minutes at RT. Subsequently, the plates were washed 5 times with PBST and 100 μL of 100 mg mL−1 of TMB supplemented with 1.2 mM of hydrogen peroxide in 50 mM acetate buffer (pH 5.0) was added for 10 minutes at RT. Finally, the colorimetric reaction was stopped with 100 μL of 2N H2SO4 and optical density (OD) was measured at 450 nm.
:3000 in PBST was added for 30 minutes at RT. Subsequently, the plates were washed 5 times with PBST and 100 μL of 100 mg mL−1 of TMB supplemented with 1.2 mM of hydrogen peroxide in 50 mM acetate buffer (pH 5.0) was added for 10 minutes at RT. Finally, the colorimetric reaction was stopped with 100 μL of 2N H2SO4 and optical density (OD) was measured at 450 nm.
Results and discussion
One of the key factors for detecting bacteria rapidly with the proposed origami biosensors is to dry a drop of sample on the substrate, i.e. filter paper (Fig. 1A). The sample is quickly dried by positioning a hair dryer 5 cm away and blowing warm air for 30 s, which generates a temperature gradient that renders the pathogen physically adsorbed within the cellulose matrix, where they are specifically detected by antibody-coated nanoparticles in posterior steps (Fig. 1B and C). To demonstrate this point, E. coli cells were dyed with carboxyfluorescein diacetate succinimidyl ester (CFSE) and spotted on the filter paper. In Fig. 2A, images of three independent experiments obtained with a fluorescent scanner show that the CFSE-labeled cells are trapped within the cellulose matrix. When the same experiment was performed with unlabeled bacteria, the signal was significantly lower, which indicates that the fluorescent signal is originated by the CFSE-labeled cells and not by the spotting procedure. When the cells were immunostained with antibody-decorated nanoparticles, a red-colored spot appeared in the area where the bacteria were trapped, which was not present before the addition of the colloids (Fig. 2B). Densitometric analysis of the color in the spots with a flatbed scanner and with our mobile app yielded nearly identical results, further validating the smartphone-based approach for signal quantification at the point of care (Fig. 2B).13 In summary, the results shown in Fig. 2 demonstrate that the filter paper captures bacteria efficiently, and that these cells can subsequently be detected with antibody-decorated nanoparticles, which generate colored spots that are then able to be automatically quantified with an app. Below we apply these concepts for detecting bacteria at different concentrations with the origami biosensors shown in Fig. 1.Next we calibrated the mobile biosensors with solutions containing different known concentrations of E. coli. Gram positive S. viridans was used as a control to test the specificity of the antibody–antigen interaction. In Fig. 3A, samples containing E. coli yield dose-dependent signals that followed the typical sigmoidal shape seen in immunodetection methods. The limit of detection, expressed as the sample that yields a signal higher than 3 times the standard deviation of the blank (99% confidence), is 105 cells per mL. Control experiments with S. viridans yielded signals that are below the limit of detection in all the concentrations assayed, which demonstrates that the dose-dependent signals observed during the analysis of E. coli samples are originated by the specific recognition of the pathogen with antibody-decorated nanoparticles. We then tested the selectivity of the biosensors with samples containing some the most prevalent pathogens in UTIs. In Fig. 3B, solutions containing P. mirabilis, E. cloacae or K. pneumoniae always yield signals that are lower than the limit of detection for E. coli. However, E. faecalis is detectable at a concentration of 105 cells per mL or higher with the same biosensors, which indicates that the antibody-decorated nanoparticles are establishing non-specific interactions with these bacteria. This came as a surprise because E. faecalis is Gram positive, and therefore, no cross-reactivity was expected with the antibodies.
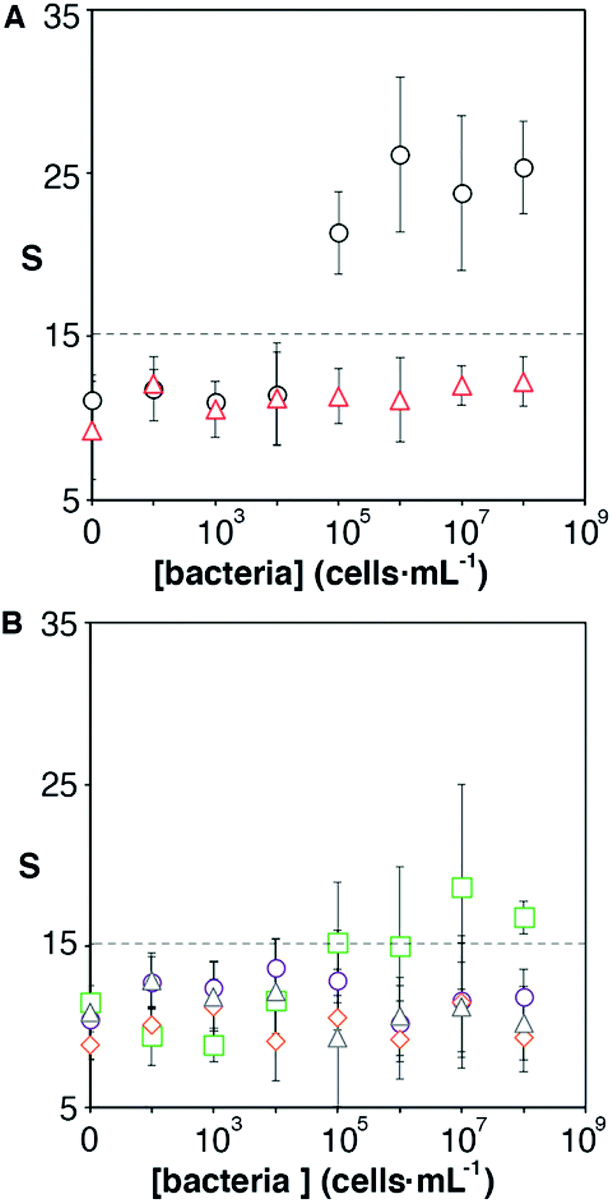 | ||
| Fig. 3 Calibration plots representing the colorimetric signal S with respect to the concentration of pathogens. (A) E. coli (black dots) and S. viridans (red triangles); (B) E. faecalis (green squares); K. pneumoniae (purple dots); P. mirabilis (orange diamonds), E. cloacae (grey triangles) (semi-logarithmic scale). Dotted lines show the signal above 3 times the standard deviation of the E. coli blank. Error bars are the standard deviation (n = 3). | ||
It has been shown that some microorganisms generate biotinylated proteins, and because of this they interact with streptavidin-modified probes.27 In our biosensor design antibodies are bound to the nanoparticles by means of avidin–biotin interactions. Since avidin has 4 biotin binding sites, these are likely not fully occupied by biotinylated antibodies. With this in mind, we hypothesized that avidin could be responsible for the selectivity issues shown in Fig. 3B. To test this hypothesis, we physically adsorbed bacteria at different concentrations on an ELISA plate and added streptavidin-peroxidase. After washing away excess reagents, we quantified the presence of bacteria-streptavidin interactions by adding a chromogen and measuring the generation of color by horseradish peroxidase (HRP). In Fig. 4A, E. faecalis yields signals that are higher than those obtained with E. coli, which indicates that the streptavidin-HRP complex interacts specifically with E. faecalis. We then sought to eliminate this interference in our biosensors by repeating the calibration curve shown in Fig. 3 with nanoparticles modified with anti-E. coli and capped with biotinylated polyethylene glycol (biotin-PEG). In Fig. 4B, E. coli shows a dose-dependent behavior whereas E. faecalis always yields very low signals independently of the concentration of bacteria in the sample. These experiments demonstrate that the selectivity issues in Fig. 3B are caused by avidin–biotin interactions, and that these issues can be alleviated by capping free biotin-binding sites with biotin-PEG. Furthermore, E. coli signals fit well to a linear regression model in the concentration range between 104 and 107 cells per mL (y = 6.6x − 9.5, r2 = 0.93).
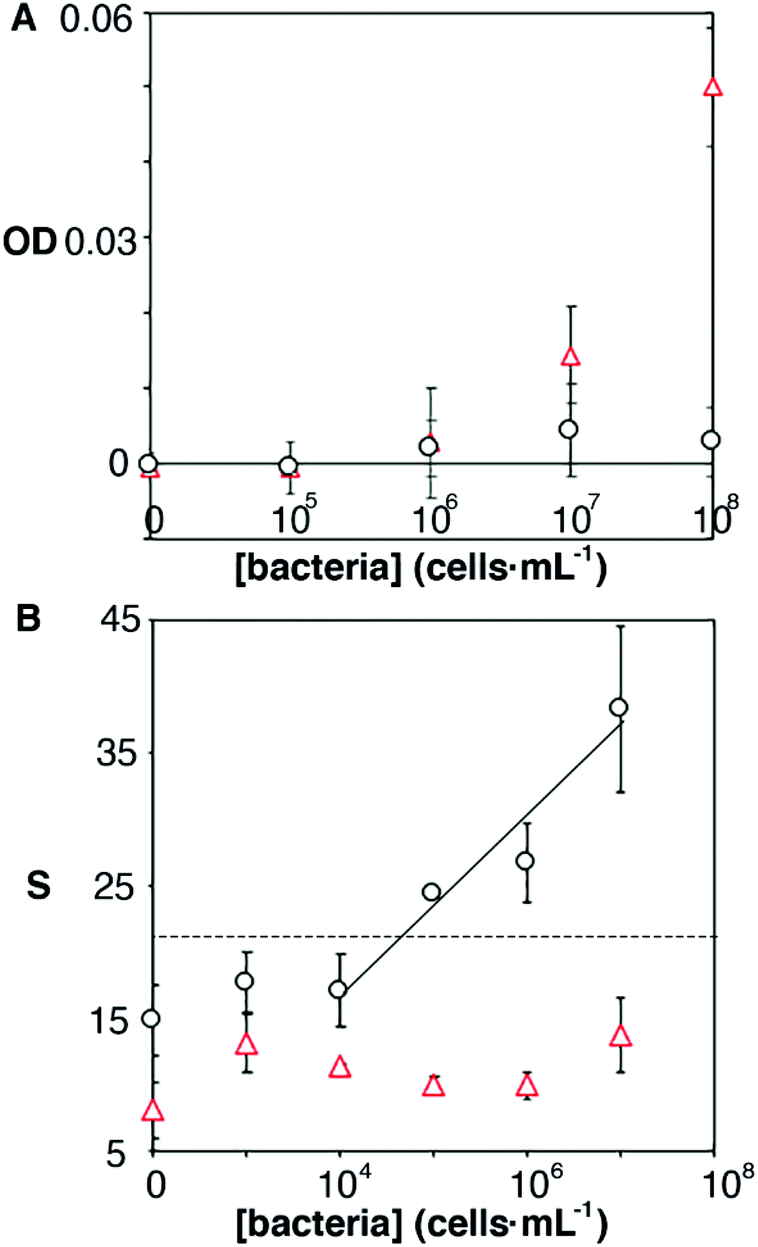 | ||
| Fig. 4 Origin of non-specific interactions between E. faecalis and antibody-decorated nanoparticles. Optical density (OD) or colorimetric signal (S) with respect to the concentration of E. faecalis (red triangles) or E. coli (black dots) after incubating cells with streptavidin-HRP (A); or after repeating the calibration experiment in Fig. 3 with nanoparticles capped with biotin-PEG (B) (semi-logarithmic scale). Dotted lines show the signal above 3 times the standard deviation of the E. coli blank. | ||
After studying the selectivity of our biosensors towards the recognition of different uropathogens, we sought to determine whether they could be used to detect UTIs in real samples. To this end, a panel of 57 patient samples that included UTIs by E. coli, UTIs by other pathogens, and negative samples was queried with our biosensors. All samples were obtained from the Microbiology Unit at Son Espases University Hospital. They were analyzed using bacteriological culture following clinical guidelines. According to these guidelines, bacteriuria is defined by a positive urine culture with a bacteria concentration equal or higher than 105 cells per mL.28,29 Quantification above this threshold is not associated with disease severity or a different diagnosis, and therefore it is not performed in the standard clinical routine. Fig. 5 shows the comparison between our biosensors and the gold standard bacteriological culture following this criterion. Samples that yield signals above 2 times the standard deviation of the mean value of negative samples are considered E. coli positive. Following this criterium, only one sample from E. coli UTI yielded a false negative. Samples containing other bacteria always yielded signals below the threshold value, which corroborates the excellent selectivity of our biosensor. The test diagnostic sensitivity (true positive rate) is 95.5%, and the specificity (true negative rate) is 100%. These results demonstrate that our mobile biosensors are useful for detecting pathogens in real samples rapidly and with high accuracy, which paves the way for their implementation in clinical practice.
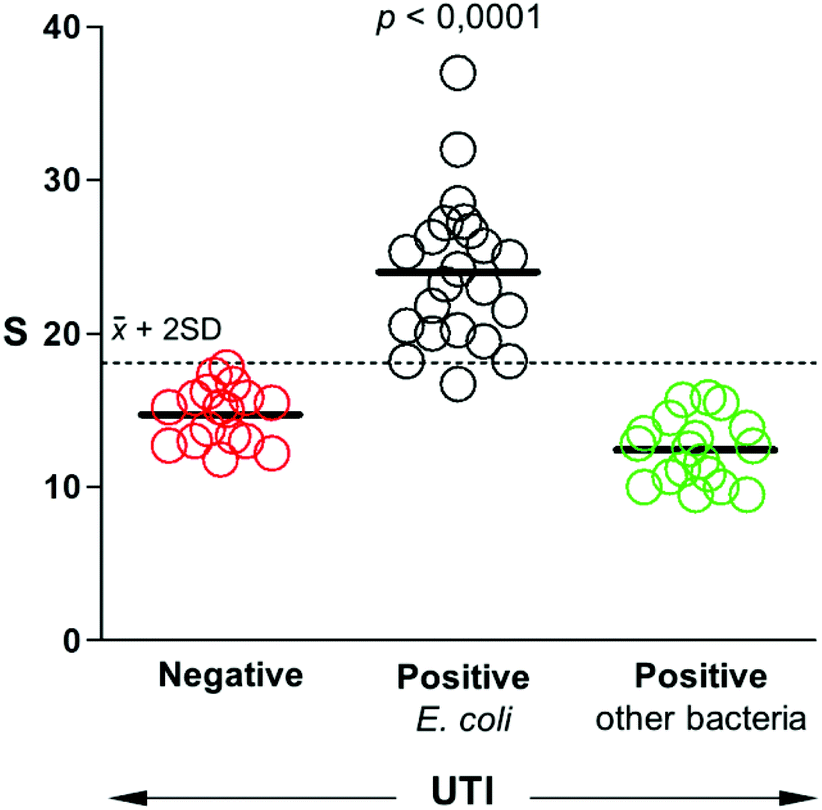 | ||
| Fig. 5 Biosensor response when queried with a panel of patient samples that were E. coli positive (≥105 cells per mL, black), E. coli negative, or positive due to an infection by another pathogen (green). Horizontal bars represent the mean. P-value was obtained with a Kruskall-Wallis test. | ||
Conclusions
In conclusion, we introduced origami biosensors with mobile readouts for detecting UTIs at the point of care. The whole assay takes less than 7 min. Selectivity issues due to unforeseen interactions between avidin and E. faecalis were overcome by capping biotin-binding sites with biotin-PEG. After this treatment, the biosensor shows an excellent selectivity and specificity towards E. coli. When queried with a panel of patient samples the sensors yielded only one false negative. Biosensors for detecting other pathogens could readily be fabricated by changing the antibodies around the nanoparticles. Moreover, multi-sensors containing reservoirs with nanoparticles designed to detect different bacteria could be used to identify the pathogen causing a UTI. These features, along with the short assay time and mobile detection scheme, make our biosensors promising for guiding antibiotic prescriptions at the point of care.Conflicts of interest
R. R., and C. A. have filed a patent application (PCT/EP2020/075013) in order to protect the intellectual property of the method for fabricating nanoparticle reservoirs.Acknowledgements
Dr de la Rica acknowledges financial support from grants FEDER/Ministerio de Ciencia, Innovación y Universidades/Agencia Estatal de Investigación/-Proyecto CTQ2017-82432-R and FEDER/Ministerio de Ciencia, Innovación y Universidades/Agencia Estatal de Investigación/-Proyecto CTQ2017-92226-EXP as well as a Radix fellowship from IdISBa/Impost turisme sostenible/Govern de les Illes Balears.Notes and references
- M. Davenport, K. E. Mach, L. M. D. Shortliffe, N. Banaei, T. Wang and J. C. Liao, Nat. Rev. Urol., 2017, 14, 296–310 CrossRef.
- J. E. Simmering, F. Tang, J. E. Cavanaugh, L. A. Polgreen and P. M. Polgreen, Open Forum Infect. Dis., 2017, 4, 1–7 CrossRef.
- E. Hummers-Pradier and M. M. Kochen, Br. J. Gen. Pract., 2002, 752–761 Search PubMed.
- R. G. Finch, Nat. Rev. Microbiol., 2004, 2, 989–994 CrossRef CAS.
- P. Nag, K. Sadani, S. Mukherji and S. Mukherji, Sens. Actuators, B, 2020, 311, 127945 CrossRef CAS.
- B. Li, Z. Zhang, J. Qi, N. Zhou, S. Qin, J. Choo and L. Chen, ACS Sens., 2017, 2, 243–250 CrossRef CAS.
- W. Li, D. Qian, Q. Wang, Y. Li, N. Bao, H. Gu and C. Yu, Sens. Actuators, B, 2016, 231, 230–238 CrossRef CAS.
- J. Ding, B. Li, L. Chen and W. Qin, Angew. Chem., Int. Ed., 2016, 13033–13037 CrossRef CAS.
- A. Alba-Patiño, S. M. Russell and R. de la Rica, Sens. Actuators, B, 2018, 273, 951–954 CrossRef.
- A. Yakoh, S. Chaiyo, W. Siangproh and O. Chailapakul, ACS Sens., 2019, 4, 1211–1221 CrossRef CAS.
- C.-A. Chen, W.-S. Yeh, T.-T. Tsai, Y.-D. Li and C.-F. Chen, Lab Chip, 2019, 19, 598–607 RSC.
- A. Alba-Patiño, C. Adrover-Jaume and R. de la Rica, ACS Sens., 2020, 5, 147–153 CrossRef.
- A. Alba-Patiño, S. M. Russell, M. Borges, N. Pazos-Perez, R. A. Alvarez-Puebla and R. de la Rica, Nanoscale Adv., 2020, 2, 253–1260 RSC.
- T. Ghonge, H. C. Koydemir, E. Valera, J. Berger, C. Garcia, N. Nawar, J. Tiao, G. L. Damhorst, A. Ganguli, U. Hassan, A. Ozcan and R. Bashir, Analyst, 2019, 144, 3925–3935 RSC.
- S. Kuss, R. A. S. Couto, R. M. Evans, H. Lavender, C. C. Tang and R. G. Compton, Anal. Chem., 2019, 91, 4317–4322 CrossRef CAS.
- H. Ilhan, B. Guven, U. Dogan, H. Torul, S. Evran, D. Çetin, Z. Suludere, N. Saglam, İ. H. Boyaci and U. Tamer, Talanta, 2019, 201, 245–252 CrossRef CAS.
- J. Gomez-Cruz, S. Nair, A. Manjarrez-Hernandez, S. Gavilanes-Parra, G. Ascanio and C. Escobedo, Biosens. Bioelectron., 2018, 106, 105–110 CrossRef CAS.
- C. Catala, B. Mir-Simon, X. Feng, C. Cardozo, N. Pazos-Perez, E. Pazos, S. Gómez-de Pedro, L. Guerrini, A. Soriano, J. Vila, F. Marco, E. Garcia-Rico and R. A. Alvarez-Puebla, Adv. Mater. Technol., 2016, 1, 11600163 Search PubMed.
- N. Pazos-Perez, E. Pazos, C. Catala, B. Mir-Simon, S. Gomez-De Pedro, J. Sagales, C. Villanueva, J. Vila, A. Soriano, F. J. Garcia De Abajo and R. A. Alvarez-Puebla, Sci. Rep., 2016, 6, 1–10 CrossRef.
- I. P. Alves and N. M. Reis, Biosens. Bioelectron., 2019, 145, 111624 CrossRef CAS.
- T. Huang, J. Yang, W. Zhou, X. Liu, Y. Pan and Y. Song, Sens. Actuators, B, 2019, 298, 126885 CrossRef CAS.
- L. Barnes, D. M. Heithoff, S. P. Mahan, G. N. Fox, A. Zambrano, J. Choe, L. N. Fitzgibbons, J. D. Marth, J. C. Fried, H. T. Soh and M. J. Mahan, EBioMedicine, 2018, 36, 73–82 CrossRef.
- D. Liu, Y. Zhu, N. Li, Y. Lu, J. Cheng and Y. Xu, Sens. Actuators, B, 2020, 310, 127834 CrossRef CAS.
- V. D. Nguyen, H. Van Nguyen, K. H. Bui and T. S. Seo, Sens. Actuators, B, 2019, 301, 127108 CrossRef CAS.
- P. Naik, S. Jaitpal, P. Shetty and D. Paul, Sens. Actuators, B, 2019, 291, 74–80 CrossRef CAS.
- S. M. Russell, A. Alba-Patiño, M. Borges and R. de la Rica, ACS Sens., 2018, 3, 1712–1718 CrossRef CAS.
- A. Matsuhisa, Y. Saito, H. Ueyama, M. Yamamoto and T. Ohono, Microbiol. Immunol., 1993, 37, 765–772 CrossRef CAS.
- M. de Cueto, L. Aliaga, J.-I. Alós, A. Canut, I. Los-Arcos, J. A. Martínez, J. Mensa, V. Pintado, D. Rodriguez-Pardo, J. R. Yuste and C. Pigrau, Enferm. Infecc. Microbiol. Clin., 2017, 35, 314–320 CrossRef.
- T. A. Rowe and M. Juthani-Metha, Infect. Dis. Clin. North Am., 2014, 28, 75–89 CrossRef.
Footnote |
| † Electronic supplementary information (ESI) available. See DOI: 10.1039/d0an01218a |
| This journal is © The Royal Society of Chemistry 2020 |