Self-assembly of colloidal micelles in microfluidic channels
Arash
Nikoubashman
Institute of Physics, Johannes Gutenberg University Mainz, Staudingerweg 7, 55128 Mainz, Germany. E-mail: anikouba@uni-mainz.de
First published on 6th July 2016
Abstract
The self-assembly of amphiphilic Janus colloids in microfluidic channels is studied using hybrid molecular dynamics simulations with fully resolved hydrodynamic interactions incorporated through the multi-particle collision dynamics algorithm. The simulations are conducted at a density and temperature where the Janus particles spontaneously self-assemble into spherical micelles to minimize the interface between the solvophobic caps and the surrounding solvent. In confined systems, this contact area can also be reduced by aggregation at the channel walls. Indeed, a sizable fraction of free particles and small clusters with three and four members are found at the walls when the microfluidic channel is made up of a comparably solvophobic material as the Janus colloids. When the applied Poiseuille flow is sufficiently strong, the colloidal micelles break up into smaller fragments and isolated particles. However, at intermediate flow rates the shear-induced dissociation and reorganization of aggregates lead to a net growth of the micelles with a sizable amount of particles in icosahedral clusters with 13 particles. Furthermore, the parabolic velocity profile of the flow causes a highly non-uniform cluster size distribution between the channel walls, where the aggregation number decreases close to the walls.
I. Introduction
Over the past several decades, a significant amount of research has been devoted to studying and engineering self-assembling colloidal particles. Here, the microscopic interactions and structural motifs of the individual building blocks are designed in such a way that they autonomously aggregate into specific super- and macrostructures. This approach has been inspired by nature, where a myriad of structures and processes are governed by this guiding principle, such as the folding of DNA1,2 and the self-assembly of amphiphilic phospholipids into bilayer cell membranes.3–5 The concept of self-assembly is also appealing for many scientific and technological applications. For instance, short amphiphilic molecules (surfactants) are widely used as detergents, emulsifiers,6 and drug delivery agents.7 Macromolecular block copolymers allow for fabricating tailored nanomaterials with structures on the 10–100 nm scale, with morphologies such as lamellae, cylinders, and spheres, depending on the chemical incompatibility and molecular weights of the blocks.8–10At the next length-scale above block copolymers lie Janus colloids, i.e. rigid particles with two physically or chemically distinguishable faces. These particles are promising candidates for a wide range of new applications, such as self-propelling sensors,11,12 soft optoelectronic devices,13 and highly selective catalysts.14 Previous experiments and simulations have revealed a rich self-assembly scenario for bulk systems at equilibrium, including micelles, vesicles, and system-spanning lamellar phases.15–18 For confined systems, the self-assembly behavior becomes even more complex. For instance, highly ordered chain-like and zig-zag structures were observed for Janus particles in narrow channels, depending on the particle density and colloid–wall interactions.19,20
The majority of past studies has focused on static environments in (or close to) equilibrium, where self-assembly occurs as the result of the interplay between the particle interactions and diffusive transport. However, the physical picture changes entirely as soon as the system is macroscopically perturbed and driven out of equilibrium, which is often the case in biological and physical situations. For instance, external flow can enhance growth, coalescence or breakup of aggregates in solution,21–23 induce a transition from a crystal to a uniform phase24–26 and vice versa,26–28 or direct the formation of non-equilibrium structures, such as sliding particle planes.29,30 Even at rest, equilibrium in a strict thermodynamic sense is often never reached due to dynamic arrest.31
Recent simulations of dilute Janus particle solutions under shear have revealed an initial growth of spherical Janus micelles for low shear rates, and a subsequent breakup of the aggregates at high shear rates.32–34 Highly symmetric octahedral and icosahedral aggregates were found to be particularly stable against shear.32 At high colloid concentrations, where the Janus particles assembled into wormlike micelles and lamellar sheets, shear-alignment was observed for small shear, followed by the breakdown to a colloidal gas as the system was driven further out of equilibrium.34
In this article, hybrid molecular dynamics (MD) simulations with fully resolved hydrodynamic interactions are employed to study the self-assembly of Janus particles in microfluidic channels under pressure-driven flow. These systems markedly differ from the previously investigated systems under shear because the characteristic parabolic flow profile leads to a highly non-uniform shear field in the system, which in turn leads to an inhomogeneous cluster size distribution in the channel. Furthermore, confinement effects play an important role in the self-assembly behavior, because the amphiphilic Janus particles can also aggregate close to the walls to minimize the interface with the surrounding solvent.
II. Simulation model and methods
Janus colloids were modeled using a coarse-grained description, where each particle was represented as a single rigid sphere with diameter σ.15–17,32,34 In this model, the interaction between colloids is governed by the following pair potential:| U(rij,qi,qj) = UWCA(rij) + UJanus(rij,qi,qj). | (1) |
 | (2) |
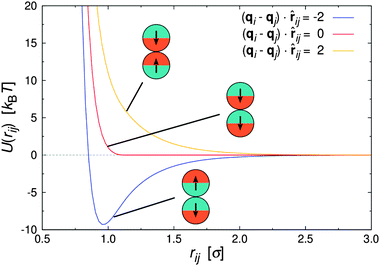 | ||
| Fig. 1 Pair interaction between two Janus particles i and j as a function of inter particle distance for selected particle orientations. | ||
In experimental systems of amphiphilic Janus colloids in aqueous solutions, the water molecules will preferentially adsorb at the solvophilic side of each colloid. The resulting steric exclusion of the adsorbed water molecules then leads to an effective repulsion between the solvophilic sides of neighboring Janus particles. At the same time, the incompatibility between the solvent and the solvophobic caps effectively favors configurations where these sides point toward each other, so that the contact with the surrounding solvent is minimized. To incorporate the amphiphilic character of Janus colloids in our simulations, we employed an anisotropic Yukawa potential:16,32,36
 | (3) |
Fig. 1 shows U(rij) for various configurations. The pair potential has its strongest attraction when the solvophobic hemispheres are facing each other and the solvophilic parts are completely exposed to the surrounding solvent. The attraction becomes weaker as the particles are rotated relative to each other, until the Janus contribution UJanus vanishes completely and the interaction is given by U = UWCA. The particles experience the strongest repulsion, when both solvophobic hemispheres face the solvent. A detailed study of the self-assembly behavior of this model at equilibrium can be found in ref. 16, where small spherical micelles were found at low colloid densities, which then merged to elongated aggregates as the colloid density was increased further. Qualitatively similar morphologies were also observed for other Janus models,15,17,34 highlighting the generic nature of the employed models.
The colloidal suspension was confined in a slit-like channel as schematically depicted in Fig. 2. Here, the coordinate system was chosen so that the principal axes coincide with the gradient (x), vorticity (y), and flow directions (z). The channel dimensions were set to Lx = 15σ, Ly = 10σ, and Lz = 30σ, with periodic boundary conditions in the vorticity and flow direction. It was verified at selected state points that increasing the channel dimensions in either direction does not have any appreciable effect on the resulting behavior.
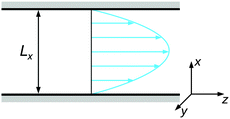 | ||
| Fig. 2 Schematic representation of the channel geometry with gradient (x), vorticity (y), and flow (z) direction. | ||
The interactions between the Janus particles and the channel walls were modeled via:
| Uwall(xi,θi) = Uwr(xi) + Uwa(xi,θi). | (4) |
 | (5) |
| Uwa(xi,θi) = −εwa[1 + cos(θi)]/(2xi4), | (6) |
Standard MD simulations with the velocity Verlet algorithm were employed to compute the translational motion of the colloids.38 Rotational dynamics were included through a quaternion-based algorithm.39 The MD algorithm was coupled with the multi-particle collision dynamics (MPCD) technique40,41 to capture the hydrodynamic interactions between the dispersed colloids. In the MPCD algorithm, solvent particles are modeled explicitly as point particles with unit mass m. Their motion is governed by sequential streaming and collision steps: particles first propagate ballistically over a period ΔtMPCD before they undergo a stochastic collision with solvent particles in the same collision cell. In this work, the stochastic rotation dynamics (SRD) variant of the MPCD algorithm was used,40 where the collision is mimicked by a random rotation of the particle velocities.
In MPCD-SRD, the dynamic properties of the solvent are controlled through the solvent density ρs, the rotation angle α, and the time step ΔtMPCD. The spatial resolution of the hydrodynamics is set by the edge length of the collision cells a. Galilean invariance is violated for mean-free paths  .42 In order to avoid this unphysical behavior, all collision cells were shifted along a randomly chosen direction before each collision step.42 In this work, the MPCD parameters were set to ρs = 5a−3, α = 130°, and ΔtMPCD = 0.1τ, where
  is the intrinsic time scale of the MPCD algorithm. The time step of the conventional MD algorithm was set to ΔtMD = 0.002τ. The transport coefficients of the solvent can be calculated analytically,43 resulting in a self-diffusion coefficient of D = 0.064a2τ−1 and a dynamic viscosity of η = 3.96τkBTa−3 (kinematic viscosity ν = η/ρs = 0.792a2τ−1).
The solvent particles were coupled to the rigid colloids through stochastic reflections during the streaming step.44–47 This approximative coupling scheme reproduces no-slip boundary conditions at the colloid surface and long-time diffusion coefficients consistent with the Stokes–Einstein relation47 when the diameter of the embedded colloids is sufficiently large compared to the size of the collision cells. A colloid diameter σ = 3a was used in this work, which led to a good balance between the computational accuracy and efficiency of the MPCD algorithm. The mass and moment of inertia of the colloids were set to M = ρsπσ3/6 and I = Mσ2/10, respectively, to mimic solid colloids with neutral buoyancy.
Poiseuille flow was generated by applying a body force to the solvent particles together with no-slip boundary conditions at the channel walls. The flow strength can be controlled through the acceleration constant g. Collision cells overlapping the walls were filled using virtual solvent particles as described in ref. 48. The system was kept at constant temperature T = 1 by employing a cell level thermostat, where the solvent velocities relative to the center of mass velocity of the collision cell were rescaled according to the equipartition theorem. Solute particles were then thermostatted through collisions with the solvent particles.
All simulations were conducted at a fixed colloid number density of ρ = 0.05σ−3, unless stated otherwise explicitly. Initial configurations were generated by first randomly placing 225 colloids inside the channel, and then performing 3 × 10⁷ MD steps under quiescent conditions. The same number of simulation steps was performed for acquiring measurements, where the time evolution of the potential energy E was checked to determine whether the systems have reached steady state. Snapshots were taken for analysis every 5000 MD steps, and eight independent simulations were performed at each state point to calculate error bars.
To quantify the relative importance of the flow phenomena and to facilitate comparisons with experiments, fluid parameters are expressed in reduced quantities. The importance of hydrodynamics can be quantified through the Schmidt number Sc = ν/D. The employed simulation parameters lead to Sc ≈ 12, which is sufficiently large for achieving liquid-like conditions.49 To avoid compressibility effects, simulations were restricted to Mach numbers Ma = u/c < 0.6, where u is the maximum fluid velocity and  is the speed of sound of the MPCD fluid under isothermal conditions. The relevance of inertial flow effects can be quantified through the Reynolds number, which is defined as the ratio between the characteristic inertial and viscous forces. In particular, the channel Reynolds number Re = uLx/ν is a useful measure to estimate the emergence of flow instabilities and turbulence, which typically occur at Re ≳ 2000 in pipe flow.50 The particle Reynolds number Rep = uσ/ν is a reliable quantity for estimating the onset of inertial flow effects. For the simulated flow rates, Re ≤ 20 and Rep ≲ 1.3, indicating that the investigated systems should be dominated by viscous forces.
III. Results
To test the simulation model and its implementation, the pure MPCD fluid under Poiseuille flow was simulated. Fig. 3 shows the resulting velocity profile, where the position of the particles is reported in reduced coordinates ξ = x/Lx, defined so that ξ = 0, 1 at the walls and ξ = 0.5 at the channel centerline. It is clearly visible that the velocity profile followed the parabolic profile expected for a Newtonian liquid, and that the wall slip was negligible in our simulations.48,51,52 The dynamic viscosity of the MPCD solvent can be extracted by fitting the simulation data, yielding η = 3.98 ± 0.01, which is in excellent agreement with the analytic estimate.43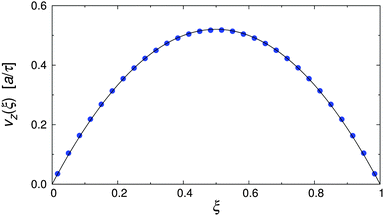 | ||
| Fig. 3 Velocity profile of the pure MPCD solvent at Re = 20 (symbols), and parabolic fit through the data (solid line). | ||
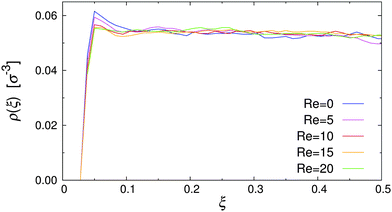
In order to establish a baseline for the amphiphilic systems, the effect of flow on a colloidal suspension of nearly-hard spheres was first investigated. To this end, the anisotropic contribution of the pair potential was switched off (C = 0 in eqn (3)), and all simulations have been conducted with purely repulsive walls (εwa = 0.0 in eqn (4)). Fig. 4 shows the spatial density distribution of the colloids along the gradient direction for various Re. Because of the channel symmetry, only the absolute displacement from either wall is considered to improve sampling. It is clear from Fig. 4 that the accessible volume was delimited rather sharply and that the colloids were essentially uniformly distributed between the walls. In addition, the profiles at rest and under flow were almost indistinguishable, apart from a slight surplus of particles near the channel walls under quiescent conditions. This static effect originated from the excluded volume interactions both within the colloidal suspension and against the wall.53 However, this small inhomogeneity vanished when flow was applied to the system due to hydrodynamic interactions between the colloids and the wall (see further below).
The density distribution of Janus particles under quiescent conditions is shown in Fig. 5 for all investigated colloid–wall attraction strengths, εwa. In the case of non-selective (εwa = 0.0) and weakly selective (εwa = 2.5) walls, the colloids were almost uniformly distributed in the channel, similar to the case of nearly-hard spheres (cf.Fig. 4). There was a slight surplus of Janus colloids close to the channel walls already at εwa = 0.0, because the repulsion of the walls was weaker compared to the interaction with the Janus particles in the channel center. When the wall attraction became comparable to the interaction strength between solvophobic caps (εwa = 5.0), a sizable fraction of Janus particles accumulated at the walls. In this case, about 40% of all particles were located in the immediate vicinity of the walls and 15% in the second layer. The majority of these adsorbed colloids were in clusters with either three or four members, but also isolated colloids were identified at the walls. Typical aggregate configurations are depicted schematically in Fig. 5. A more detailed analysis of the spatial cluster distribution is presented further below.
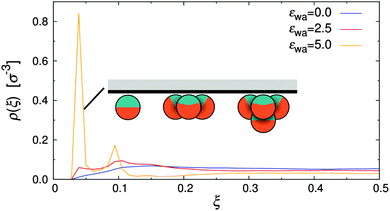 | ||
| Fig. 5 Density distribution of Janus particles for various colloid–wall attraction strengths, εwa, at rest. | ||
When external flow was applied to the system, a small but statistically significant shift of the particle distribution away from the walls could be observed (see Fig. 6). For instance, the deviation between the density profiles at rest and Re = 20 was up to 25% for εwa = 0.0, whereas the measurement uncertainty was approximately 5%. One possible explanation for this behavior could be the Segré–Silberberg effect, where the curvature of the flow profile in combination with the asymmetric wake vorticity distribution near the walls results in transverse forces, pinching the solute particles at ξ ≈ 0.2 and ξ ≈ 0.8.54–57 Although this dynamic effect was negligible for non-aggregating colloids (cf.Fig. 4), it should in principle become more pronounced for the larger self-assembled Janus micelles as they were subject to stronger inertia. To verify this hypothesis, additional simulations of nearly-hard spheres were conducted, where the colloid diameter σ* was set to the average cluster size at rest (σ* ≈ 2σ). The number of colloids was chosen so that the volume fraction of dispersed colloids, Φ = ρπσ3/6, remained constant.
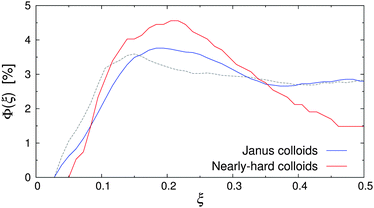 | ||
| Fig. 6 Volume fraction Φ(ξ) of Janus colloids (diameter σ) and nearly-hard spheres (diameter σ* ≈ 2σ) at Re = 20 and εwa = 0.0. The dashed line indicates the distribution of Janus particles at rest. | ||
Fig. 6 shows Φ(ξ) for the Janus colloids and the enlarged nearly-hard spheres at Re = 20 and εwa = 0.0. Here, a maximum at ξ ≈ 0.2 and a subsequent minimum at the channel center ξ = 0.5 can be identified, confirming our hypothesis. The pinching effect was slightly more pronounced for the dispersion of nearly-hard spheres, because the colloid diameter was based on the average aggregate size instead of the actual aggregate distribution (see Fig. 7). Furthermore, Janus micelles can be broken up by shear into smaller fragments (see further below), which then experience weaker inertial effects.
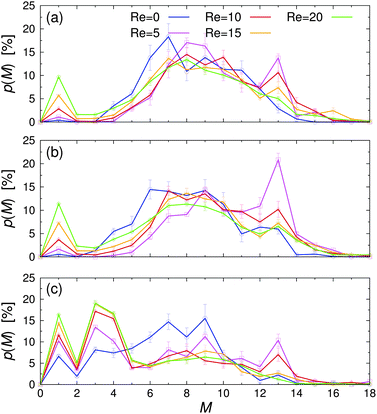 | ||
| Fig. 7 Probability of finding a Janus particle in a cluster with M members, p(M), for various Reynolds numbers Re at (a) εwa = 0.0, (b) εwa = 2.5, and (c) εwa = 5.0. | ||
To better understand the effect of confinement and flow on the self-assembly behavior, it is instructive to study the cluster size distribution. Two Janus particles were assigned to the same aggregate, when the poles of their solvophobic faces were within one particle diameter, i.e. . Furthermore, colloids were only considered members of a stable cluster when the number and identity of the constituent particles did not change for at least 5000 MD steps. This additional constraint filters fluctuating aggregates, where colloids detach and attach frequently. It also ensures that colloids which are brought close to a given cluster by flow are not erroneously considered as part of the aggregate.
The probability p of finding a Janus particle in a cluster with a given aggregation number M is plotted in Fig. 7 for various Re and εwa. Here, several key trends can be identified: under quiescent conditions, the spontaneous self-assembly of nearby free particles and small aggregates led to a rather broad cluster size distribution. When the system was exposed to weak flow, the cluster size distribution shifted to larger M, as shear induced the breakup and reorganization of aggregates with energetically unfavorable configurations. Furthermore, the likelihood of merging free particles and underpopulated aggregates increased when the system was exposed to flow compared to the purely diffusive transport at equilibrium, because the particles could explore space more efficiently. In this weak flow regime, a large fraction of aggregates consisted of M = 13 particles in an icosahedral arrangement. The number of nearest-neighbor bondings is maximized in this close-packed structure with fivefold symmetry, leading to high mechanical stability against external shear.32 As the flow rate was increased further, the applied strain energy surpassed the bond energy, breaking the clusters apart again. This behavior is reflected in the decreasing aggregation number and the simultaneous increase of free colloids.
Furthermore, it is clear that the cluster distribution changed significantly when the colloid–wall interactions became strongly selective. For εwa = 0.0 and εwa = 2.5, the cluster size distributions are qualitatively similar and are characterized by a rather broad distribution centered around M ≈ 7. Furthermore, there were only a few small clusters in the system, even at high Re. However, when the attraction between the solvophobic caps and the confining walls was increased further (εwa = 5.0), a sizable fraction of Janus colloids could be found in the form of isolated particles, trimers, and tetramers (cf.Fig. 5). The amount of particles in such configurations increased significantly when flow was applied, and the majority of clusters consisted of 4 or fewer members at Re ≥ 10.
The spatial cluster size distribution between the channel walls, M(ξ), is shown in Fig. 8 for various Re at all investigated εwa. At rest, M(ξ) was distributed rather uniformly across the channel for εwa = 0.0 and εwa = 2.5. In the case of εwa = 5.0, a local maximum can be identified at ξ ≈ 0.1, which coincides with the second peak in the colloid density distribution (cf.Fig. 5). The cluster size at this position was considerably larger than the ones observed for the εwa = 0.0 and εwa = 2.5 cases. This effect originated from the higher local density, which promotes self-assembly into larger micelles.15,16,32 As an immediate consequence, M became slightly smaller in the interior of the channel for εwa = 5.0, due to the depletion of Janus colloids in this area.
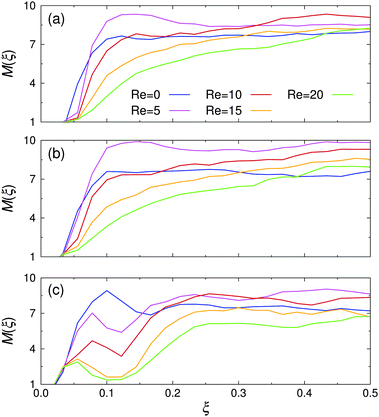 | ||
| Fig. 8 Spatial cluster size distribution, M(ξ), for various Reynolds numbers Re at (a) εwa = 0.0, (b) εwa = 2.5, and (c) εwa = 5.0. | ||
For low (but still finite) flow rates, M first increased uniformly across the entire channel in the case of purely repulsive and weakly attractive walls, but then decreased again as Re was increased further. However, the size of the clusters in the channel center remained consistently larger under flow compared to the value at rest. Furthermore, it is clear from Fig. 8 that the decay was more pronounced closer to the walls. For εwa = 5.0, both the local maximum and the ensuing local minimum shifted closer to the wall as Re was increased. At the same time, the average cluster size in this region decreased substantially.
To better understand the influence of flow on the self-assembly behavior, it is instructive to consider the shear field in the system. In contrast to shear flow between two parallel plates, the shear rate ![[small gamma, Greek, dot above]](https://www.rsc.org/images/entities/i_char_e0a2.gif) in Poiseuille flow is not constant along the gradient direction, but is given by:
in Poiseuille flow is not constant along the gradient direction, but is given by:
 | (7) |
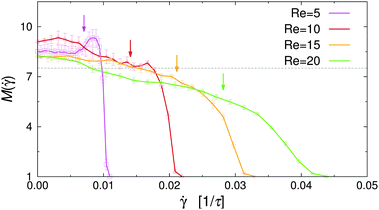
![[small gamma, Greek, dot above]](https://www.rsc.org/images/entities/i_char_e0a2.gif) vanishes at the channel center and increases linearly towards the walls. The dependence of M on the local shear rate can be studied by translating the data shown in Fig. 8 using eqn (7). Fig. 9 shows M(
vanishes at the channel center and increases linearly towards the walls. The dependence of M on the local shear rate can be studied by translating the data shown in Fig. 8 using eqn (7). Fig. 9 shows M(![[small gamma, Greek, dot above]](https://www.rsc.org/images/entities/i_char_e0a2.gif) ) for selected Re in the case of non-selective walls (εwa = 0.0). The horizontal dashed line corresponds to the average cluster size at rest, M(
) for selected Re in the case of non-selective walls (εwa = 0.0). The horizontal dashed line corresponds to the average cluster size at rest, M(![[small gamma, Greek, dot above]](https://www.rsc.org/images/entities/i_char_e0a2.gif) = 0), and the arrows indicate the shear rate experienced at ξ = 0.2, where the density profiles of the Janus particles have essentially leveled off (cf.Fig. 5). It is clearly visible that M increased significantly in the weakly sheared central region of the channel, but then dropped below M(
= 0), and the arrows indicate the shear rate experienced at ξ = 0.2, where the density profiles of the Janus particles have essentially leveled off (cf.Fig. 5). It is clearly visible that M increased significantly in the weakly sheared central region of the channel, but then dropped below M(![[small gamma, Greek, dot above]](https://www.rsc.org/images/entities/i_char_e0a2.gif) = 0) for
= 0) for ![[small gamma, Greek, dot above]](https://www.rsc.org/images/entities/i_char_e0a2.gif) ≳ 0.01. Furthermore, M(
≳ 0.01. Furthermore, M(![[small gamma, Greek, dot above]](https://www.rsc.org/images/entities/i_char_e0a2.gif) ) decreased much more abruptly for low Re, because
) decreased much more abruptly for low Re, because ![[small gamma, Greek, dot above]](https://www.rsc.org/images/entities/i_char_e0a2.gif) (x) ≳ 0.01 moves closer to the channel walls, where the solute density decreases gradually to zero. The
(x) ≳ 0.01 moves closer to the channel walls, where the solute density decreases gradually to zero. The ![[small gamma, Greek, dot above]](https://www.rsc.org/images/entities/i_char_e0a2.gif) -range, in which the transition from cluster growth to cluster breakup occurred, agrees well with previous simulations of Janus clusters under shear.32 These findings suggest that local shear is the dominant factor in the central region of the channel, whereas confinement effects become increasingly important close to the channel walls. A similar behavior has been observed for the cases εwa = 2.5 and εwa = 5.0 (not shown here).
-range, in which the transition from cluster growth to cluster breakup occurred, agrees well with previous simulations of Janus clusters under shear.32 These findings suggest that local shear is the dominant factor in the central region of the channel, whereas confinement effects become increasingly important close to the channel walls. A similar behavior has been observed for the cases εwa = 2.5 and εwa = 5.0 (not shown here).
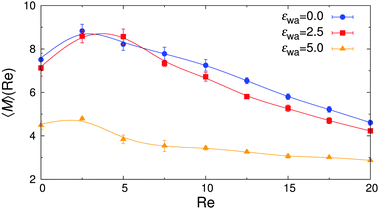
The overall effect of flow becomes more apparent when the average cluster size,  , is considered. Fig. 10 shows the simulation data for all investigated εwa. In all cases, 〈M〉 increased for weak flow and reached its maximum at Re = 2.5, followed by a significant decrease as Re was increased further. Here, the curves for εwa = 0.0 and εwa = 2.5 differ only marginally, whereas the progression of 〈M〉 was much more shallow for εwa = 5.0. This difference stemmed from the fact that the density distribution was significantly more localized close to the channel walls for εwa = 5.0, which in turn restricted the self-assembly of Janus particles to rather small aggregates as shown in Fig. 5, and also led to a relatively narrow range of shear rates experienced by the clusters.
Efficient solute transport is an important aspect for many microfluidic applications, and therefore the particle flux through the gradient-vorticity plane of the channel, Ψ, was computed from the colloid density and velocity profiles:
 | (8) |
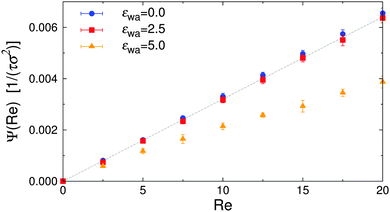 | ||
| Fig. 11 Particle flux Ψ vs. Reynolds number Re for various wall attraction strengths εwa. The dashed line corresponds to a system of isotropic nearly-hard spheres. | ||
IV. Conclusions
The self-assembly of colloidal Janus particles in microfluidic channels was investigated using a hybrid molecular dynamics approach that takes into account hydrodynamic interactions. Simulations were conducted in the parameter range where spherical micelles are spontaneously formed under equilibrium conditions in the bulk. Similar structures were observed under confinement, when the interactions between the Janus colloids and the channel walls were purely repulsive or only weakly attractive. However, when the wall attraction was increased further, a large fraction of Janus colloids aggregated at the walls in the form of isolated particles and small clusters. When Poiseuille flow was applied to the system, the cluster size first increased uniformly across the entire channel at low (but finite) flow rates, with a large fraction of Janus particles arranged in icosahedral clusters with 13 members, maximizing the number of nearest neighbors. However, when the flow rate was increased further, the aggregates broke up into smaller fragments and single particles. Furthermore, the cluster size distribution became increasingly non-uniform at high flow rates, with a strong decrease of the cluster size towards the walls, where the shear rate was maximal. The simulations demonstrate how the self-assembly of Janus particles can be directed towards specific structures by tuning the colloid–wall interactions and applying external flow.Acknowledgements
I would like to thank Athanassios Z. Panagiotopoulos, Christos N. Likos, and Michael P. Howard for many helpful discussions. Furthermore, I would like to acknowledge funding from the German Research Foundation (DFG) under the project number NI 1487/2-1, and gratefully acknowledge the computing time granted on the supercomputer Mogon at Johannes Gutenberg University Mainz (http://www.hpc.uni-mainz.de).References
- J. D. Watson and F. H. Crick, Nature, 1953, 171, 737 CrossRef CAS PubMed.
- P. W. K. Rothemund, Nature, 2006, 440, 297 CrossRef CAS PubMed.
- J. D. Robertson, Prog. Biophys. Mol. Biol., 1960, 10, 343 CAS.
- S. J. Singer and G. L. Nicolson, Science, 1972, 175, 720 CAS.
- M. Antonietti and S. Förster, Adv. Mater., 2003, 15, 1323 CrossRef CAS.
- A. Patist, J. R. Kanicky, P. K. Shukla and D. O. Shah, J. Colloid Interface Sci., 2002, 245, 1 CrossRef CAS PubMed.
- M. J. Lawrence, Chem. Soc. Rev., 1994, 23, 417 RSC.
- F. S. Bates and G. H. Fredrickson, Phys. Today, 1999, 5(2), 32 CrossRef.
- R. A. Segalman, Mater. Sci. Eng., R, 2005, 48, 191 CrossRef.
- A. P. Marencic and R. A. Register, Annu. Rev. Chem. Biomol. Eng., 2010, 1, 277 CrossRef CAS PubMed.
- G. Volpe, I. Buttinoni, D. Vogt, H.-J. Kümmerer and C. Bechinger, Soft Matter, 2011, 7, 8810 RSC.
- A. Brown and W. Poon, Soft Matter, 2014, 10, 4016 RSC.
- M. A. Bucaro, P. R. Kolodner, J. A. Taylor, A. Sidorenko, J. Aizenberg and T. N. Krupenkin, Langmuir, 2009, 25, 3876 CrossRef CAS PubMed.
- J. Faria, M. Pilar Ruiz and D. E. Resasco, Adv. Synth. Catal., 2010, 352, 2359 CrossRef CAS.
- F. Sciortino, A. Giacometti and G. Pastore, Phys. Rev. Lett., 2009, 103, 237801 CrossRef PubMed.
- G. Rosenthal, K. E. Gubbins and S. H. L. Klapp, J. Chem. Phys., 2012, 136, 174901 CrossRef PubMed.
- Z. Preisler, T. Vissers, F. Smallenburg, G. Munaò and F. Sciortino, J. Phys. Chem. B, 2013, 117, 9540 CrossRef CAS PubMed.
- A. Walther and A. H. E. Müller, Chem. Rev., 2013, 113, 5194 CrossRef CAS PubMed.
- M. Sobrino Fernández, V. R. Misko and F. M. Peeters, Phys. Rev. E: Stat., Nonlinear, Soft Matter Phys., 2014, 89, 022306 CrossRef PubMed.
- Y. Kobayashi and N. Arai, Soft Matter, 2016, 12, 378 RSC.
- A. Zaccone, M. Soos, M. Lattuada, H. Wu, M. Bäbler and M. Morbidelli, Phys. Rev. E: Stat., Nonlinear, Soft Matter Phys., 2009, 79, 061401 CrossRef PubMed.
- A. Moussa, M. Lattuada, B. Conchúir, A. Zaccone, M. Morbidelli and M. Soos, Langmuir, 2013, 29, 14386 CrossRef CAS PubMed.
- B. Conchúir and A. Zaccone, Phys. Rev. E: Stat., Nonlinear, Soft Matter Phys., 2013, 87, 032310 CrossRef.
- B. J. Ackerson and N. A. Clark, Phys. Rev. Lett., 1981, 46, 123 CrossRef CAS.
- Y. L. Wu, D. Derks, A. van Blaaderen and A. Imhof, Proc. Natl. Acad. Sci., 2009, 106, 10564 CrossRef CAS PubMed.
- D. Richard and T. Speck, Sci. Rep., 2015, 5, 14610 CrossRef CAS PubMed.
- B. J. Ackerson and P. N. Pusey, Phys. Rev. Lett., 1988, 61, 1033 CrossRef CAS PubMed.
- B. Lander, U. Seifert and T. Speck, J. Chem. Phys., 2013, 138, 224907 CrossRef PubMed.
- A. Wysocki and H. Löwen, Phys. Rev. E: Stat., Nonlinear, Soft Matter Phys., 2009, 79, 041408 CrossRef PubMed.
- A. Nikoubashman, G. Kahl and C. N. Likos, Phys. Rev. Lett., 2011, 107, 068302 CrossRef PubMed.
- C. P. Royall, S. R. Williams, T. Ohtsuka and H. Tanaka, Nat. Mater., 2008, 7, 556 CrossRef CAS PubMed.
- E. Bianchi, A. Z. Panagiotopoulos and A. Nikoubashman, Soft Matter, 2015, 11, 3767 RSC; A. Nikoubashman, E. Bianchi and A. Z. Panagiotopoulos, Soft Matter, 2015, 11, 3946 RSC.
- Z. Huang, P. Chen, Y. Yang and L.-T. Yan, J. Phys. Chem. Lett., 2016, 7, 1966 CrossRef CAS PubMed.
- R. A. DeLaCruz-Araujo, D. J. Beltran-Villegas, R. G. Larson and U. M. Córdova-Figueroa, Soft Matter, 2016, 12, 4071 RSC.
- J. D. Weeks, D. Chandler and H. C. Andersen, J. Chem. Phys., 1971, 54, 5237 CrossRef CAS.
- A. M. Somoza, E. Chacón, L. Mederos and P. Tarazona, J. Phys.: Condens. Matter, 1995, 7, 5753 CrossRef CAS.
- D. Lenz, R. Blaak and C. N. Likos, Soft Matter, 2009, 5, 2905 RSC.
- M. P. Allen and D. J. Tildesley, Computer Simulation of Liquids, Oxford University Press, USA, 1989 Search PubMed.
- D. Rozmanov and P. G. Kusalik, Phys. Rev. E: Stat., Nonlinear, Soft Matter Phys., 2010, 81, 056706 CrossRef PubMed.
- A. Malevanets and R. Kapral, J. Chem. Phys., 1999, 110, 8605 CrossRef CAS.
- G. Gompper, T. Ihle, D. Kroll and R. G. Winkler, Adv. Polym. Sci., 2009, 221, 1 CAS.
- T. Ihle and D. M. Kroll, Phys. Rev. E: Stat., Nonlinear, Soft Matter Phys., 2001, 63, 020201 CrossRef CAS PubMed.
- H. Noguchi and G. Gompper, Phys. Rev. E: Stat., Nonlinear, Soft Matter Phys., 2008, 78, 016706 CrossRef PubMed.
- J. T. Padding, H. Löwen, A. Wysocki and A. A. Louis, J. Phys.: Condens. Matter, 2005, 17, S3393 CrossRef CAS.
- M. Hecht, J. Harting, M. Bier, J. Reinshagen and H. J. Herrmann, Phys. Rev. E: Stat., Nonlinear, Soft Matter Phys., 2006, 74, 021403 CrossRef PubMed.
- A. Nikoubashman, C. N. Likos and G. Kahl, Soft Matter, 2013, 9, 2603 RSC.
- D. S. Bolintineanu, G. S. Grest, J. B. Lechman, F. Pierce, S. J. Plimpton and P. R. Schunk, Comp. Part. Mech., 2014, 1, 321 CrossRef.
- A. Lamura, G. Gompper, T. Ihle and D. M. Kroll, Europhys. Lett., 2001, 56, 319 CrossRef CAS.
- M. Ripoll, K. Mussawisade, R. G. Winkler and G. Gompper, Phys. Rev. E: Stat., Nonlinear, Soft Matter Phys., 2005, 72, 016701 CrossRef CAS PubMed.
- V. C. Patel and M. R. Head, J. Fluid Mech., 1969, 38, 181 CrossRef.
- J. Whitmer and E. Luijten, J. Phys.: Condens. Matter, 2010, 22, 104106 CrossRef PubMed.
- D. S. Bolintineanu, J. B. Lechman, S. J. Plimpton and G. S. Grest, Phys. Rev. E: Stat., Nonlinear, Soft Matter Phys., 2012, 86, 066703 CrossRef PubMed.
- I. K. Snook and D. Henderson, J. Chem. Phys., 1978, 68, 2134 CrossRef CAS.
- G. Segré and A. Silberberg, Nature, 1961, 189, 209 CrossRef.
- J. Matas, J. Morris and E. Guazzelli, Oil Gas Sci. Technol., 2004, 59, 59 Search PubMed.
- C. Prohm, M. Gierlak and H. Stark, Eur. Phys. J. E: Soft Matter Biol. Phys, 2012, 35, 80 CrossRef CAS PubMed.
- M. P. Howard, A. Z. Panagiotopoulos and A. Nikoubashman, J. Chem. Phys., 2015, 142, 224908 CrossRef PubMed.
| This journal is © The Royal Society of Chemistry 2017 |

