
 Open Access Article
 This Open Access Article is licensed under a
 Creative Commons Attribution 3.0 Unported Licence
Polymer–iron oxide nanofiber composites for lead removal: performance improvements through organic acid stabilization of nanoparticles to promote surface segregation during electrospinning†
Sewoon
Kim
 a,
Yun Young
Choi
b,
Chang Min
Park
c,
Nosang V.
Myung
b and
David M.
Cwiertny
*ad
a,
Yun Young
Choi
b,
Chang Min
Park
c,
Nosang V.
Myung
b and
David M.
Cwiertny
*ad
aDepartment of Civil and Environmental Engineering, University of Iowa, 4105 Seamans Center, Iowa City, IA 52242, USA. E-mail: david-cwiertny@uiowa.edu
bDepartment of Chemical and Biomolecular Engineering, University of Notre Dame, 121 McCourtney Hall, Notre Dame, IN 46556, USA
cDepartment of Environmental Engineering, Kyungpook National University, 80 Daehak-ro, Buk-gu, Daegu 41566, Republic of Korea
dDepartment of Chemistry, University of Iowa, E331 Chemistry Building 230 North Madison Street, Iowa City, IA 52242, USA
First published on 24th December 2024
Abstract
Herein we developed nanofiber composite membranes made of polyacrylonitrile (PAN) and iron oxide nanoparticles using a one-pot electrospinning synthesis method for application in point-of-use (POU) water treatment devices targeting both dissolved and particulate lead. With the goal of optimizing lead removal while minimizing raw material costs, we explored different commercially available iron oxides and incorporated simple organic acids (OAs) [e.g., ortho- and tera-phthalic acid (PTA and TPTA) and ethylenediaminetetraacetic acid (EDTA)] based on our previous observation that sodium dodecyl sulfate (SDS) promotes enrichment of iron oxide at the electrospun nanofiber surface (i.e., surface segregation). From sorption isotherm studies, we found that increasing iron oxide loading led to higher lead uptake (e.g., PAN with 5 wt% iron oxide exhibited a lead removal capacity of 10 mg g−1 of mat versus 5 mg g−1 for 1 wt% iron oxide). PAN with 5 wt% iron oxide (3.3 mg lead removal per $) also resulted in better cost-normalized lead removal than PAN with 1 wt% iron oxide (1.0 mg lead removal per $). The integration of OAs further improved performance; for example, PAN with 5 wt% iron oxide and 3 wt% PTA achieved approximately 40 mg g−1. From nanofiber characterization via microscopic (SEM and TEM) and spectroscopic (XPS and FTIR) tools, OAs increase lead uptake through a combination of pathways: (1) stabilizing iron oxide particles and improving their dispersion in electrospinning sol gels; (2) promoting surface segregation that increases iron oxide concentration at the nanofiber surface; (3) functioning as a porogen that increases composite surface area; and (4) introducing some additional lead binding sites (e.g., carboxylates) within the nanofiber. Simulating point-of-use application in a dead-end filtration system (effective filter area of 12.6 cm2, filter thickness of 120 μm, and flow rate of 20 mL min−1), we observed lead-free permeate with just 0.24 g of our optimal formulation when challenged with 4 L of 150 μg L−1 soluble lead solution and 90% removal when this filter was challenged with a feed solution containing both dissolved and particulate lead (160 μg L−1 total lead with 30% of particulate lead; >0.1 μm). Our study highlights the potential for OAs to enhance the performance of polymer–metal oxide nanofiber composites via a one-pot synthesis that will help to minimize production costs for high-performing materials.
Environmental significanceThis work is a direct response to the need for improved point-of-use (POU) treatment technologies to protect drinking water consumers from exposure to dissolved and particulate lead in light of recent performance failures of conventional carbon-based POU devices during high profile lead in drinking water events (e.g., Newark, New Jersey). It also provides generalizable insights and new synthetic approaches for overcoming practical challenges commonly associated with the deployment of highly reactive engineered nanomaterials (e.g., nanoscale iron oxide sorbents) in water treatment. |
1. Introduction
Drinking water can be a significant source of lead (Pb) exposure, particularly for infants who consume formula prepared with contaminated water, resulting in irreversible human health effects including behavior and learning problems, lower IQ, and slowed growth for children, and reduced fetus growth and premature birth for pregnant women.1,2 Pb poses a unique management challenge for public drinking water systems as both dissolved and particulate Pb can enter the water supply after treatment via the distribution system (e.g., lead service lines) and premise plumbing (e.g., lead goosenecks, fixtures, and solder).3,4 Accordingly, common management practices for Pb in drinking water require interventions in and around the consumer's residence, including lead service line (LSL) removal or point-of-use (POU) treatment devices certified by NSF/ANSI for Pb removal.Among available certified POU technologies for Pb removal from drinking water, granular activated carbon, either as a packed bed or pressed carbon block filter, has emerged as a popular choice because of its cost-effectiveness coupled with simple process design and operation.5 When appropriately installed and maintained, carbon-based POU devices offer the potential to lower Pb in drinking water to levels well below the current non-health-based US EPA action level of 15 μg L−1. Carbon-based POU devices have been distributed during Pb in drinking water crises in affected communities,6 are the focus of “filter first” legislation in the US to remove Pb from school drinking water,7 and are likely to be the device of choice for municipalities mandated to provide POU technologies to consumers under the recently proposed Lead and Copper Rule Improvements, which will lower the action level to 10 μg L−1.8 Indeed, even with recent federal commitments to remove LSLs in the coming years,9 POU devices will continue to play a critical role in reducing Pb exposure through drinking water in consumer residences because they offer protection from lead that enters water after the LSL (i.e., from premise plumbing).
Despite their widespread use, there remain opportunities to improve the performance and accessibility of POU technologies for Pb removal. For example, Lytle et al. recently reported that carbon-based POU devices supplied to residents of Newark, NJ during a Pb in drinking water crisis intermittently failed, resulting in some instances of Pb above 45 μg L−1 in POU device effluent.10 Similarly, Purchase et al. found that 50% of colloidal Pb in synthesized water passed through some certified carbon-based POU devices.11 Challenges with particulate or colloidal Pb removal by conventional carbon-based POU devices may require a shift toward membrane technologies that are able to remove such contaminants by physical separation. Unfortunately, POU membrane treatment systems such as reverse osmosis tend to be considerably more expensive than carbon-based treatment,12 and they often produce large volumes of reject water as waste (e.g., the US EPA estimates as much as 5 gallons of waste for every gallon of treated drinking water).13 To achieve affordable and sustainable Pb-free drinking water accessible to all consumers, there is need for lower cost, lower pressure membrane systems that can effectively remove both dissolved and particulate Pb.
We have previously developed a nanofiber membrane filter for dissolved Pb removal consisting of a composite of electrospun polyacrylonitrile (PAN) and a nanoscale iron (Fe) oxide.14 Iron oxides are a relatively low cost, naturally abundant material that are commercially available across a range of particles sizes (including as nanomaterials) and exhibit properties (e.g., a point of zero charge typically near circumneutral pH) that make them ideal for use as sorbents of various dissolved metals, including lead.15 Accordingly, in the composite, the nanoscale Fe oxide functions as a high surface area sorbent with a large capacity for uptake of dissolved Pb ions. The nanofiber membrane also functions as a microfilter, which although not yet experimentally tested should be well-suited for the physical removal of particulate Pb at relatively high fluxes and low pressures consistent with an in-residence water tap. To fabricate our composites, we used electrospinning, a high-throughput, industrially viable fabrication route for nanofibers,16 which we further improved through the inclusion of a surface-segregating surfactant (sodium dodecyl sulfate or SDS) that helped to concentrate the Fe oxide nanoparticles at or near the nanofiber surface (rather than buried within the bulk of the polymer fiber).14 We also found that SDS functioned as a porogen; after synthesis, the majority was released to solution, creating pores that increased reactive surface area for lead uptake. Optimal composites exhibited a Pb uptake capacity of ∼35 mg of Pb per g mat, which compares favorably to commercially available Pb sorbents (10–100 mg g−1).17,18 Moreover, because the majority of nanofiber surface area is external (unlike the large internal porosity of granular activated carbon), composite nanofiber membranes performed well in dead-end filtration experiments (pH 6, 20 mL min−1 of flow rate, 12.6 cm2 of active area), suggesting a consumer's supply of Pb-free drinking water (from a source initially contaminated with 300 μg L−1 of Pb) would require only 170 mg of composite.
Herein, we explore the generalizability of composite fabrication across different commercially Fe oxide particles and chemical additives. Fundamentally, we aim to improve our understanding of organic-assisted surface segregation during electrospinning, the process by which interactions between organic additives, like SDS, and nanoparticles result in production of composites that are surface-enriched in both the nanoparticles and organic additives. More practical considerations relate to developing materials better suited for translation to the POU technology scale. For example, despite exhibiting promising performance as a reactive filtration media for Pb removal, a major limitation of our prior formulation was the reliance on high-cost, research grade nanomaterials. In fact, a general challenge for the environmental application of nanoengineered materials is the availability of large quantities of high-performing materials at low cost.19 Thus, we evaluated seven different commercially available, industrial grade Fe oxides as lower cost alternatives to determine whether they could achieve comparable Pb removal. Similarly, while SDS is valuable as a porogen that promotes surface segregation, retention of negatively charged surface moieties would also be advantageous for their ability to promote electrostatic, ion exchange, and/or complexation interactions with dissolved Pb. Accordingly, we fabricated nanofiber composites with various organic acids (OAs) including ortho-phthalic acid (PTA), tera-phthalic acid (TPA), and ethylenediaminetetraacetic acid (EDTA) for comparison with SDS as an additive.
Once synthesized, composites were characterized using both microscopic (scanning and transmission electron microscopy; SEM and TEM, respectively) and spectroscopic (X-ray photoelectron spectroscopy and Fourier transform infrared spectroscopy; XPS and FTIR, respectively) tools, as well as surface area and pore volume analysis. Pb sorption capacity was determined for all Fe oxide nanoparticles in dispersion and compared to their corresponding nanofiber composite. For the highest performing materials, we also simulated POU treatment for the removal of both dissolved and particulate Pb in a dead-end filtration apparatus. Collectively, the insights developed herein should help to advance the development of high-performance, lower cost nanocomposite membranes for applications in decentralized water treatment.
2. Materials and methods
2.1. Chemicals
A detailed list of reagents is provided in the ESI.† All nanofibers were prepared from polyacrylonitrile (PAN) and N,N-dimethylformamide (DMF). Seven different commercially available Fe oxides (see Table 1) were considered for nanofiber composite development, hereafter referred to as materials A through G. Organic additives included the surfactant SDS, dicarboxylic acids PTA and TPA, and the polycarboxylic acid EDTA, a well-recognized metal chelator.20 Pb solutions used in performance testing were prepared from lead nitrate [Pb(NO3)2; ≥99.0%].| Vendor | Particle sizea (nm) | Specific surface areab (m2 g−1) | Total pore volumec (cm3 g−1) | Particle Costa ($ per g) | Lead capacityd (mg g−1) | Removed lead per dollar (mg per $) |
|---|---|---|---|---|---|---|
| a Primary particle size and cost were provided from each vendor. b Determined by N2 adsorption isotherms using the BET isotherm model. c Determined from N2 adsorption isotherms at P/P0 = 0.99. d q max values obtained from Langmuir model fits of Pb sorption isotherms. | ||||||
| A | 5 | 69 | 0.7 | 2.950 | 87.1 ± 0.9 | 29.5 |
| B | 20–40 | 40 | 0.4 | 0.380 | 73.6 ± 0.8 | 193.7 |
| C | 3 | 160 | 1.6 | N.A. | 120 ± 0.7 | N.A. |
| D | 20–40 | 90 | 0.3 | 1.820 | 83.8 ± 0.5 | 46.04 |
| E | 30![[thin space (1/6-em)]](https://www.rsc.org/images/entities/char_2009.gif) 000 000 |
7 | 0.04 | 0.001 | 40.8 ± 0.7 | 40800 |
| F | 50 | 38 | 0.2 | 4.960 | 49.7 ± 0.7 | 10.0 |
| G | 50000 |
5 | 0.02 | 0.772 | 25.6 ± 0.6 | 33.2 |
2.2. Electrospun nanofiber synthesis and processing
To prepare electrospinning sol gel precursor solutions, 0–8 wt% of Fe oxide powders and 0–4 wt% of organic additive (relative to the total sol gel mass) were first dissolved and dispersed in DMF via sonication for 5 h. Then, 8 wt% PAN (relative to the total sol gel mass) was added to this Fe oxide or Fe oxide/organic additive suspension and mixed at 60 °C for 2 h to produce a homogenous solution. The sol gels then were kept at room temperature for at least 8 h prior to use in electrospinning. Full details of the electrospinning conditions used during synthesis are provided in the ESI,† including a photo and simplified diagram of the electrospinning set-up (Fig. S1†). Hereafter, synthesized nanofiber mats will be referred to as ‘Fex–OAy’, where x and y denote the Fe and organic additive (SDS, PTA, TPA or EDTA) loadings in the sol gel, respectively.To assess the retention of additives within the composite nanofibers, we employed a rinsing method that was previously developed by our laboratory.21 For rinsing, as synthesized nanofiber mats were submerged in DI water and mixed vigorously for 12 h. During this rinsing period, the DI water was exchanged with fresh DI water every 4 h. These materials were then air dried over 12 h for characterization or used directly in Pb uptake experiments. Hereafter, these rinsed materials follow a similar nomenclature to that previously described but are denoted as ‘Fex–OAy(R)’.
2.3. Characterization for iron oxides and nanofibers
Commercially available Fe oxides and nanofiber formulations were characterized using X-ray Diffraction (XRD) for crystal phase determination, zeta-potential for surface charge, SEM and TEM for particle and nanofiber morphology, N2-BET analysis to measure specific surface area and pore volume, FTIR for bulk chemical character, and XPS for nanofiber surface chemical composition. Complete details of instrumentation, sample preparation and characterization methods for all materials are described in the ESI.†2.4. Batch sorption experiments
All batch experiments were performed in duplicate at room temperature and pH 6.5 (buffered by 10 mM HEPES) with a fixed material loading of either 0.2 g Fe oxide powder per L or 0.5 g nanofiber composite per L. Both as synthesized (i.e., unrinsed) and rinsed nanofiber composites were used in sorption experiments; comparing their Pb uptake capacity allowed us to evaluate the influence of any additive release during rinsing on performance.14 All experiments were carried out using polypropylene centrifuge tubes and caps to avoid loss of Pb via sorption to glass. Experiments examining the rate of Pb uptake were conducted at a fixed initial Pb concentration of 10 mg L−1 at pH 6.5 (buffered by 10 mM HEPES), with samples collected over time up to 24 h. Sorption isotherms were carried out by varying the initial concentration of Pb from 1 to 40 mg L−1 at pH 6.5 (note, when buffered by 10 mM HEPES, the solubility of Pb(NO3)2 in water is 52 g/100 mL,22 with Pb2+ as the dominant species), where 24 h of contact time was found to be sufficient to achieve sorption equilibrium from rate studies. Sorption capacity for all materials was evaluated through modeling of isotherms using the Langmuir and Freundlich models, with additional details provided in the ESI.†2.5. Flow-through filtration experiments for soluble and particulate Pb
Dead-end, flow-through filtration experiments (see schematic in Fig. S2†) were conducted with select nanofiber composites to simulate their use in POU filtration devices. The filter housing was purchased from Sterlitech (Auburn, WA, USA). The nanofiber mat was cut to have an effective area of 12.6 cm2. For soluble Pb filtration experiments, 4 L of 150 μg L−1 Pb at pH 6.5 (buffered by 10 mM HEPES) was applied as a feed solution, which was continuously dosed to the filter housing by a peristaltic pump (Cole-Parmer, Chicago, IL, USA) and Tygon® tubing (Masterflex, Gelsenkirchen, Germany) at 20, 35, and 50 mL min−1. The influence of nanofiber filter thickness, which influences contact time in dead-end filtration applications, on Pb uptake was evaluated by layering sheets (from 1 to 4 layers) of a specific nanofiber formulation at each flow rate. For particulate Pb filtration experiments, the feed solution was prepared using a recipe adapted from the NSF/ANSI 53 protocol for particulate Pb-containing water,23 with the resulting water quality provided in Table S1.† During filtration experiments, the flux through the filter was held constant across the entire 4 L test solution, and filter effluent was collected every 100 mL to measure both dissolved and particulate Pb concentration, as appropriate (see details below).2.6. Analytical methods
For both batch sorption and flow-through filtration experiments, Pb concentration in samples was quantified using inductively coupled plasma mass spectrometry (ICP-MS; Agilent 7900). The ICP-MS was calibrated with a single-element Pb standard obtained from Inorganic Ventures (99.98 ± 0.39 μg mL−1 lead in 0.5% v/v HNO3). For samples taken from suspensions of Fe oxide particles, the Fe oxide was removed prior to analysis via centrifugation at 8000g for 30 min and with subsequent ICP-MS analysis of the resulting supernatant. All collected samples were acidified with 2% HNO3 prior to analysis.To distinguish between dissolved and particulate Pb in flow through studies, we measured total Pb ([Pbtotal]) by using 2% HNO3 to digest a portion of the experimental sample for at least 2 hours, while another portion of the sample was passed through a 0.1 μm filter to determine dissolved Pb [Pbdissolved]. Using these values, the amount to particulate Pb (i.e., that retained by at 0.1 μm filter) was calculated from the difference between total and particulate Pb as follows: [Pbparticulate] = [Pbtotal] − [Pbfiltered].
3. Results and discussion
3.1. Pb sorption on different commercially available Fe particles
For our work with Fe oxide particles, a detailed presentation of results (Fig. S3–S7,† and Tables 1 and S2†) and the associated discussion can be found in our ESI.† Briefly, in 0.2 g L−1 Fe oxide suspensions with an initial concentration of 10 mg L−1 of total dissolved Pb, rates of Pb sorption were initially fast, ultimately achieving equilibrium within ∼2 h and uptake values after 24 h ranging from approximately 10 mg g−1 (vendor G) to 40 mg g−1 (vendor C). From isotherm studies, Langmuir model fits were best to determine equilibrium sorption capacities (qmax values) for all commercial Fe oxides (Table S2†). As with the Pb sorption rate studies, the largest qmax value was observed for the Fe oxide from vendor C (∼120 mg g−1 ± 0.7), whereas the lowest qmax value was obtained for the material from vendor G (∼25 mg g−1 ± 0.6) (Table 1).Characterization by XRD revealed that most commercial Fe oxides (vendors A, B, C and G) were hematite, whereas maghemite was observed for particles from vendors D and F. TEM images revealed that particles were roughly spherical in shape and comparable in size to the values provided by the vendor. From particle properties summarized in the ESI,† trends in Pb sorption capacity generally could be explained by differences in the Fe oxide particle size and corresponding specific surface area; more Pb uptake was observed on smaller, higher surface area particles, as expected. Another important factor was the Fe oxide surface charge, with Fe oxides that were more negatively charged at pH 6.5 (from zeta potential analysis of suspensions) typically exhibiting higher Pb sorption capacity. This is consistent with established behavior for the complexation of dissolved Pb ions (i.e., Pb2+) by surface hydroxyl groups present on the iron oxide surface.15
With a primary intent of minimizing the material costs associated with nanofiber composite production, we determined the cost-normalized performance (mg of Pb removed/US dollar cost of Fe oxide) for each commercial Fe oxide, as summarized in Table 1. Values of qmax are also shown as a function of Fe oxide particle cost (USD per gram) in Fig. S7b.† Although the Fe oxide from vendor E exhibited the second lowest Pb capacity based on qmax value (∼40 mg g−1), its considerably lower cost relative to all other Fe oxides yielded the greatest cost-normalized performance (∼40800 mg of Pb/US dollar cost of Fe oxide). Thus, in considering nanofiber composite development, we found important tradeoffs between sorbent capacity (smaller particles) and technology cost (larger particles). Accordingly, Fe oxides from vendors B, D and E were selected for further development into OA-functionalized Fe–PAN nanofiber composites because they produced the largest reduction in Pb per dollar cost of Fe oxide (∼194, ∼46, and ∼40800 mg of Pb per US dollar cost of Fe oxide, respectively).
3.2. Characterization of nanofiber composites
From microscopic analysis, we generally observed comparable characteristics for Fe–PAN nanofiber composites regardless of the Fe oxide from different vendors. SEM images of composites generated with Fe oxide from vendor B are shown in Fig. 1, whereas images of composites made with material from vendors D and E are shown in Fig. S9.† Relative to unmodified PAN, which exhibited relatively smooth nanofiber surfaces, the addition of Fe oxide alone (e.g., Fe5 without any OA) resulted in mostly rough surface features, including large, particle-shaped inclusions within the nanofibers. We attribute this surface roughness, and these inclusions, to aggregated Fe oxide particles embedded within the fibers and at or near the polymer surface. Notably, for nanofibers containing both Fe oxide and an OA, the nanofibers appeared to exhibit smoother surfaces in SEM images. For example, compared to Fe5, Fe5–SDS3 and Fe5–PTA3 had less embedded aggregates. TEM analysis (Fig. 2) also helped to illustrate the distribution of Fe oxides within the nanofibers. Individual Fe oxide particles were more easily seen in TEM images of Fe5–PTA3 relative to those of Fe5. For Fe5–PTA3, the Fe oxide particles appeared reasonably distributed throughout the fibers, although it is difficult to discern whether the particles were located at the surface or embedded within the polymer. We also note that TEM images of rinsed Fe5–PTA3 [or Fe5–PTA3(R)] suggest that the Fe oxide particles are well retained within the nanofibers after extensive rinsing to simulate their use in water treatment.
 | ||
| Fig. 1 SEM images (a–c and g–i) and histograms of nanofiber diameters (d–f and j–l; as measured by SEM image processing in ImageJ) for PAN, Fe5, Fe5–SDS3, Fe5–SDS3(R), Fe5–PTA3, and Fe5–PTA3(R). The Fe oxide particles obtained from vendor B were used for all of these materials. Average nanofiber diameters and standard deviation were determined by measuring at least n = 150 nanofibers for each material. | ||
 | ||
| Fig. 2 TEM images of (a) Fe5, (b) Fe5–PTA3, and (c) Fe5–PTA3(R) prepared with Fe oxide from vendor B. | ||
Previous studies have reported that additives such as anionic surfactants can improve sol gel viscosity and electrical conductivity, resulting in more uniform fibers by preventing beading.24 Presumed interactions between the OA and the Fe oxide also appear to improve the dispersion and stability of the particles in the sol gel used for electrospinning (Fig. S10†), resulting in fewer aggregates of Fe oxide in the composite and thus a smoother nanofiber appearance. SDS can form a mono- or surfactant bi-layer on Fe oxide nanoparticle surfaces,25 which would be expected to improve nanoparticle dispersion. Similarly, PTA, with two carboxylate ligands able to complex the Fe oxide surface, may also improve particle dispersion in the electrospinning precursor solution by acting as a stabilizing agent for the particles.26,27
Histograms of as-synthesized nanofiber diameters collected from analysis of SEM images are also shown in Fig. 1. They illustrate an observed increase in average nanofiber diameter for nanofibers containing Fe oxide relative to unmodified PAN. Moreover, the OA-containing nanofiber composites had a higher average nanofiber diameter than corresponding nanofiber composites without OA, although there was little difference between SDS and PTA containing materials. After rinsing of nanofiber composites to remove any loosely bound additives, there was no statistically significant change (based on mean and standard deviation) in the distribution of nanofiber diameters.
XPS scans of the Fe2p region were used to assess the relative degree of surface enrichment of Fe oxide in each of the composite materials, and clearly illustrated that the highest Fe surface concentration was obtained for Fe5–PTA3 (Fig. S13† for materials prepared with Fe oxide from vendor B). From the relative signal of the Fe2p region, the surface concentration of Fe oxide nanoparticles was more than 2-fold greater in composites prepared with PTA (peak area = 2923) than SDS (peak area = 1288), but both organic additives increased Fe surface concentration relative to composites (Fe5) without either OA (peak area = 909).
We have previously reported on the ability for surface-segregating SDS to enhance the surface concentration of Fe oxide nanoparticles during electrospinning.14 Although this co-enrichment of both SDS and Fe oxide nanoparticles is not fully understood, we speculate that co-migration to the nanofiber surface occurs via either physical entanglement of the Fe oxide in the hydrophobic chain of SDS or chemical coordination of the Fe oxide surface by the sulfonic acid group on SDS. For PTA, we are left to speculate that its chemical interactions with the Fe oxide surface, either via complexation30 or hydrogen bonding,31 also help to promote particle migration to the polymer surface. This may result from the improved dispersion of the Fe oxide, making it easier for the smaller particles to migrate to and more uniformly coat the nanofiber surface. It could also simply reflect a similar surface segregation phenomenon to that previously reported for surfactants,14 where certain additives may preferentially migrate to the nanofiber surface to minimize the free energy of interaction with the polymer.
3.3. Performance of Fe–PAN nanofibers: effect of iron oxide loading
Fig. 3a shows Pb sorption capacities (qmax values) obtained from Langmuir model fits of Pb sorption isotherms collected for Fe–PAN composites that were prepared with oxides from vendors B, D, and E across a range of Fe oxide loadings (from 1 to 8 wt%) but without any organic additive. The values of qmax in Fig. 3 are reported in terms of mass of Pb sorbed per unit mass of the Fe–PAN composite (Fig. 3a). Pb sorption isotherms and corresponding Langmuir model fits for each of these composites are shown in Fig. S14,† and qmax values are summarized in Table S3.†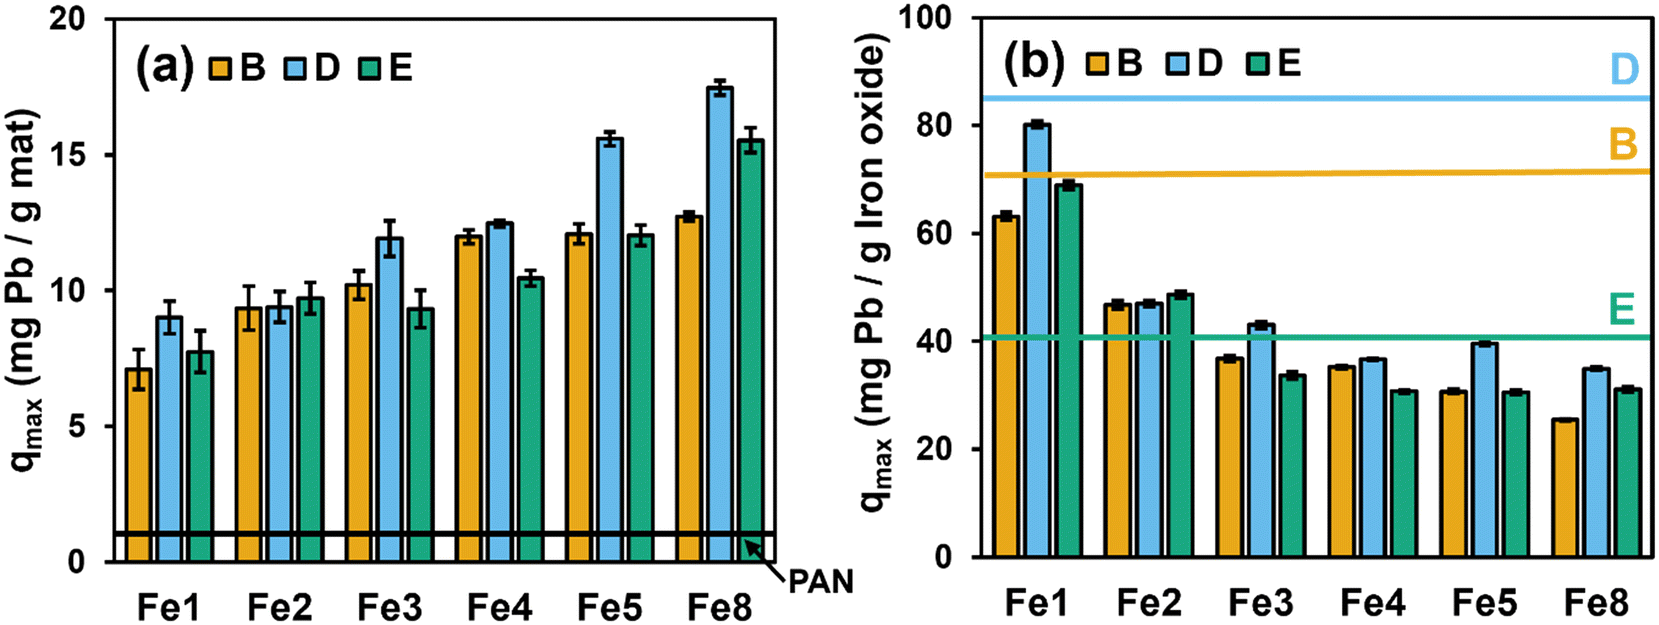 | ||
| Fig. 3 Pb uptake capacities (qmax values) for Fe–PAN nanofiber composites (a) with increasing embedded Fe oxide loading from 1 to 8 wt% (relative to total sol–gel mass) and (b) after normalization to the mass of Fe oxide within the composite. Data are shown for composites prepared using Fe oxides from vendors B, D, and E. For comparison in (a), we show the uptake of Pb measured under identical experimental conditions for PAN nanofibers without embedded Fe oxide (shown as the black dashed line). For comparison in (b), we show the mass normalized sorption capacity for Pb measured in particle suspensions of each Fe oxide. Experimental conditions: Cinitial = 1–40 mg L−1 as Pb; pH = 6.5 with 10 mM HEPES buffer; T = 20 °C; dosage = 0.5 g L−1; contact time = 24 h. | ||
As anticipated from our prior work,14 limited Pb uptake was observed on PAN nanofibers [shown as the solid black line in Fig. 3(a) at ∼1.0 mg (± 0.9) Pb per g], which we attribute to interactions of Pb2+ (the dominant lead species at pH 6.5)32,33 with the electron-rich nitrile groups (−C![[triple bond, length as m-dash]](https://www.rsc.org/images/entities/char_e002.gif) N) of PAN.34 Sorption of Pb considerably increased with integration of Fe oxide into the nanofibers, although the extent of Pb sorption did vary across materials from different vendors. For example, at a Fe oxide loading of 8 wt%, the trend in qmax values was as follows: B (12.0 mg g−1 ± 0.6) < E (15.5 mg g−1 ± 0.4) < D (17.5 mg g−1 ± 2.3). This relative trend in Pb sorption for different Fe–PAN composites tends to follow the trend in Pb uptake that we observed in particle suspensions (see Fig. S3† and Table 1). Also, from Fig. 3(a), the extent of Pb uptake generally increased with increasing Fe oxide loading within the composite fibers. However, as we have reported previously,14 this increase tended to become less significant at the highest Fe oxide loadings explored; for example, qmax values were roughly constant for Fe4–PAN, Fe5–PAN and Fe8–PAN for composites prepared with Fe oxide from vendor B. We attribute such behavior to saturation of the PAN surface with embedded Fe, such that further increases in Fe oxide loading primarily increase the fraction of Fe oxide within the bulk of the fiber (rather than on the fiber surface), where it is mostly inaccessible to Pb in solution.
N) of PAN.34 Sorption of Pb considerably increased with integration of Fe oxide into the nanofibers, although the extent of Pb sorption did vary across materials from different vendors. For example, at a Fe oxide loading of 8 wt%, the trend in qmax values was as follows: B (12.0 mg g−1 ± 0.6) < E (15.5 mg g−1 ± 0.4) < D (17.5 mg g−1 ± 2.3). This relative trend in Pb sorption for different Fe–PAN composites tends to follow the trend in Pb uptake that we observed in particle suspensions (see Fig. S3† and Table 1). Also, from Fig. 3(a), the extent of Pb uptake generally increased with increasing Fe oxide loading within the composite fibers. However, as we have reported previously,14 this increase tended to become less significant at the highest Fe oxide loadings explored; for example, qmax values were roughly constant for Fe4–PAN, Fe5–PAN and Fe8–PAN for composites prepared with Fe oxide from vendor B. We attribute such behavior to saturation of the PAN surface with embedded Fe, such that further increases in Fe oxide loading primarily increase the fraction of Fe oxide within the bulk of the fiber (rather than on the fiber surface), where it is mostly inaccessible to Pb in solution.
We also normalized the mass of Pb sorbed on each Fe–PAN formulation by the mass of Fe oxide present in each composite. Accordingly, in Fig. 3b we present sorbed Pb concentrations as mg of Pb per g of Fe after accounting for the small amount of Pb sorption onto PAN. For comparison in Fig. 3b, we also show (as horizontal lines) the corresponding qmax values obtained from Pb sorption isotherms in suspensions of each Fe oxide particle (see Tables 1 and S2†).
For Fe oxide normalized Pb sorption, we see comparable performance of Fe–PAN composites and Fe oxide particle suspensions at low Fe oxide loadings. For example, for Fe–PAN materials with 1 wt% Fe (Fe1), the extent of Pb sorption per mg of Fe oxide in composites nearly matches, or even exceeds, that measured in aqueous suspension of particles from all three vendors. It is often assumed that immobilization of particles within or on a substrate will come at the expense of the available reactive surface area.35 For these low Fe oxide loading composites, we are left to conclude that any loss of reactive surface area resulting from the embedding of Fe oxide particles within PAN is less than or comparable to the loss of reactive surface area resulting from the aggregation of Fe oxide particles in suspension. Thus, while Fe–PAN at low wt% exhibits less net uptake of Pb relative to Fe–PAN at high wt% (see Fig. 3a), they are far more efficient in harnessing the sorption capacity of the Fe oxide embedded within PAN. With increasing Fe oxide loading, Pb sorption per gram of Fe oxide decreases, with values falling well below those observed in Fe oxide suspensions. This is likely the result of a greater fraction of Fe oxide particles at these higher loadings residing in the bulk of the PAN nanofiber, with limited access to Pb2+ ions in solution.
Finally, we compared the cost effectiveness of Pb removal based on the cost of Fe oxides used to produce Fe–PAN composites (i.e., mg of Pb removed/US dollar cost of Fe) (Table S4†). When simply considering removal of Pb per gram of the entire composite (i.e., Fe–PAN), the material fabricated using the Fe oxide from vendor E exhibits the best performance [e.g., ∼18 mg of Pb removal per g of Fe8(D)–PAN compared to ∼16 and ∼12 mg of Pb removal per g of Fe8(E)–PAN and Fe8(B)–PAN, respectively]. However, when accounting for the Fe oxide cost, the material from vendor B produces the greatest extent of Pb removal per dollar invested, especially at a loading of ∼4 to 5 wt% [e.g., Fe5(B)–PAN: 3.5 mg Pb removed per US dollar]. Therefore, Fe5 using Fe oxide from vendor B [i.e., Fe5(B)–PAN] was chosen for all subsequent experiments focusing on the impact of organic additives on nanofiber composite performance.
3.4. Performance of Fe–PAN nanofibers: effect of organic acid additives
Fig. 4a shows Pb sorption isotherms collected using Fe5(B)–PAN both with and without OAs (i.e., SDS and PTA). Data in Fig. 4a are shown for as synthesized materials, without any rinsing to remove loosely bound additives. Sorption of Pb on all composite formulations followed Langmuir-type sorption; Langmuir isotherm model fits are shown in Fig. 4a, and best-fit model parameters are summarized in Table S5.†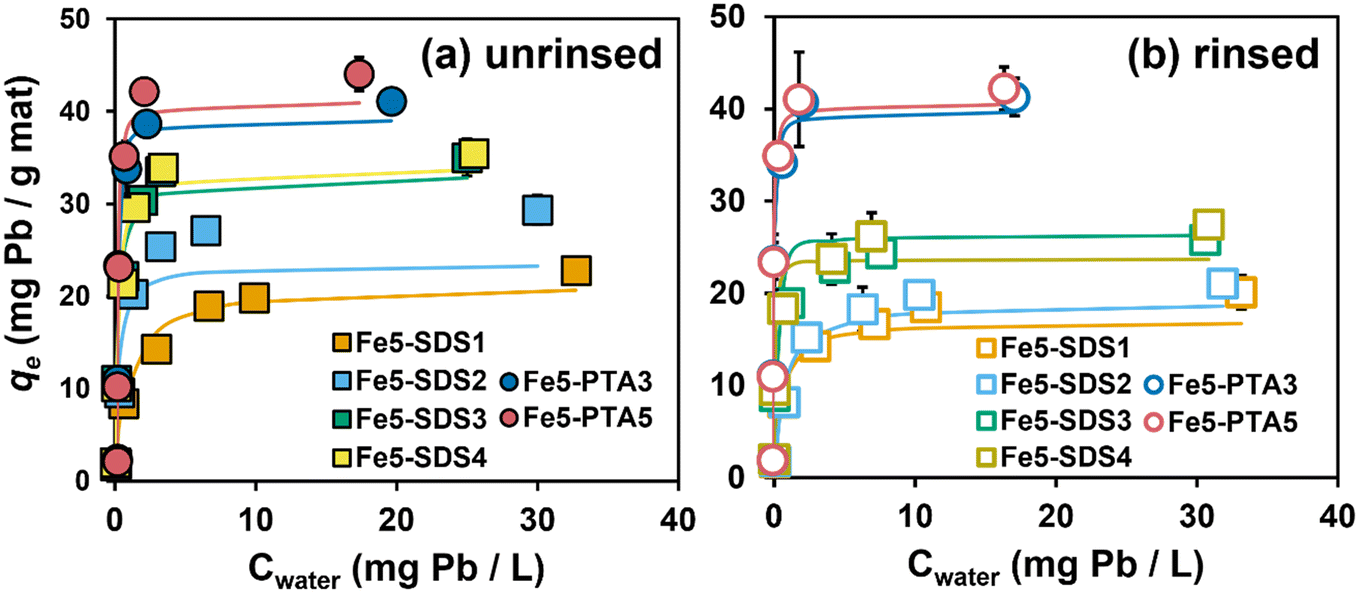 | ||
| Fig. 4 Uptake isotherms for Pb by (a) unrinsed and (b) rinsed Fe5(B)–SDS/PTA composites. Solid lines represent Langmuir isotherm model fits determined through non-linear regression analysis. Error bars represent standard deviation from duplicated experimental result. Experimental conditions: Cinitial = 1–40 mg L−1 as Pb; pH = 6.5 with 10 mM HEPES buffer; T = 20 °C; dosage = 0.5 g L−1; contact time = 24 h. | ||
With the addition of SDS and PTA, composites showed significantly higher Pb uptake capacities than the corresponding formulations prepared without additives. For example, without any OA, Fe5 produced from vendor B [or Fe5(B)] exhibited a maximum sorption capacity (qmax value from Langmuir model fits) of 11.7 ± 0.7 mg of Pb per g of sorbent. For SDS-containing composites, qmax values tended to increase with SDS loading (from 1–4 wt%), ranging from 21.3 to 34.0 mg of Pb per g of sorbent. We note, however, that we measured near-equivalent qmax values for Fe5(B)–SDS3 (qmax = 33.1 mg of Pb per g of sorbent) and Fe5(B)–SDS4 (qmax = 34.0 mg of Pb per g of sorbent), suggesting there is a limited range of loadings where SDS promotes Pb uptake. Nevertheless, the observed increase in Pb sorption is notable because compared to unmodified PAN nanofiber mats, the incorporation of Fe oxides and SDS reduced available surface area and pore volume within the composite, resulting in high Pb removal per unit surface area in these unrinsed materials (see surface-area-normalized Pb uptake values in Table S6†). While we have previously reported on this beneficial role of SDS before,14 these results demonstrate the generalizability of this finding to materials other than the specific, research-grade Fe oxide nanoparticles used in our prior work.
Greater Pb sorption was also observed with PTA-containing Fe–PAN composites, with qmax values at high PTA loadings exceeding those observed with SDS (e.g., 39.0 ± 0.6 mg of Pb per g of sorbent for Fe5(B)–PTA3 and 44.8 ± 0.2 mg of Pb per g of sorbent for Fe5(B)–PTA5). We envision that the role of PTA in promoting Pb sorption is like that of SDS. PTA improves the homogeneity of the sol gel solution (see Fig. S10†) resulting in a more uniformly Fe oxide-coated nanofiber surface (see Fig. 2), and XPS analysis supports surface enrichment of Fe oxide in PTA-containing composites (see Fig. S13†). Although the protonation state of PTA in our sol gel is not known, aqueous solutions of PTA have been shown to bind to Fe surfaces through a monodentate carboxylate complex, bidentate chelate coordination, and H-bonding.27 Thus, interactions between PTA and the Fe oxide in the sol gel are likely responsible for the improved particle dispersion and surface segregation of the Fe oxides in the nanofiber composite. We note that in our experimental systems at pH 6.5, both of the carboxylic acid groups on PTA are dissociated (pKa1 = 2.9 and pKa2 = 5.1),36 which will promote favorable electrostatic interactions between PTA and Pb.
Pb sorption isotherms for these same nanofiber formulations after extensive rinsing to remove any loosely bound OAs (Fig. 4b) revealed distinct differences in the performance of composites synthesized with SDS and PTA. After rinsing, all SDS-containing composites lost ∼20% of their Pb removal capacity relative to materials that were not rinsed prior to use. This loss in Pb uptake results from the release of SDS, as supported by the increase in specific surface area and pore volume observed with these rinsed materials (see Fig. S11†). Despite this increase in surface area and pore volume, the loss of surface sulfonate groups via the release of SDS (as supported by our spectroscopic characterization of the rinsed nanofibers; see Fig. S12†) appears to exert a greater influence on Pb sorption. Indeed, we prepared PAN fibers containing only SDS to determine the contribution of embedded SDS to Pb sorption; while unrinsed materials showed ∼1.5-fold higher Pb uptake than unmodified PAN, there was no appreciable increase in Pb uptake relative to PAN after rinsing (Fig. S15a†).
In contrast, rinsing of PTA-containing Fe–PAN had little to no impact on Pb sorption capacities (see Fig. 4b). Further, experiments with PTA-modified PAN (see Fig. S15a†) also improved uptake relative to unmodified PAN, and this increased performance was sustained after rinsing, indicating that a small amount of PTA must be retained within PAN despite the evidence from surface area and pore volume measurements (see Fig. S11†) and FTIR analysis (see Fig. S12†) suggesting near-complete release of PTA during rinsing. We are left to conclude, therefore, that the Pb removal mechanism for PTA-containing materials involves a small degree of direct Pb binding with the carboxylate groups of embedded PTA in addition to sorption on the surface-enriched Fe.
Motivated by these findings, we explored Pb removal with Fe(B)–PAN composites containing other structurally similar OAs including ethylenediaminetetraacetic acid (EDTA) (see Fig. S15†), as well as combinations of SDS and PTA (Fig. S16†). The results shown in Fig. S15† are for PAN amended with TPA and EDTA (both with and without Fe oxide), whereas the results in Fig. S16† are for PAN–Fe oxide composites with various combinations of SDS and PTA. The increase in Pb sorption observed with PTA was also observed for other benzyl dicarboxylic acid isomers (i.e., TPA) and EDTA. These OAs exerted a similar influence on sol gel stability as observed for PTA, and they produced comparable behavior with respect to trends in Pb sorption capacity with increasing wt% in PAN composites. They also appeared to be at least partially retained in PAN through rinsing, as inferred from observations of increased Pb sorption on PAN-modified nanofibers (see Fig. S15a†). We conclude, therefore, that OAs can improve Pb uptake primarily through interactions with the Fe oxide surface in the sol gel to improve particle dispersion, thereby distributing less aggregated Fe oxides more uniformly on or near the nanofiber surface. A secondary contribution results from their deprotonated carboxylate groups influencing the surface charge of the composite to promote favorable electrostatic interactions with dissolved Pb species, and possibly even direct binding of Pb through complexation or other binding interactions. We note that we observed no benefit in combining SDS and PTA into a single composite; in all instances composite performance mirrored that observed for materials made at the same wt% of PTA alone. Accordingly, all future trials focused on the application of PTA-modified materials in simulated POU applications.
3.5. Simulated POU treatment
 | ||
| Fig. 5 Normalized dissolved Pb concentration (Pbeffluent/Pbinfluent) as a function of water volume passed through the filter for a single layer of (a) PAN and Fe5, (b) increasing layer thickness of Fe5(B)–PTA3 and (c) Fe5(B)–SDS3 in a dead-end filtration system (one layer of the mat is ∼60 mg and ∼120 μm in thickness). The US EPA lead action level of 15 μg L−1 (or ppb) is shown for reference, corresponding to 90% removal. Experimental conditions: total feed volume = 4 L, Pbinfluent = 150 μg L−1, flow rate = 20 mL min−1, effective nanofiber area = 12.6 cm2, and pH 6.5 with 10 mM HEPES buffer. | ||
Using a single layer of Fe(B)–PAN composite, trends in the relative removal of soluble Pb followed that previously observed from batch uptake experiments: Fe5–PTA3 > Fe5–SDS3 > Fe5 > PAN. In kinetically limited, flow-through systems the improved dispersion and surface enrichment of the Fe oxide particles by PTA enables greater Pb capture during a single pass through the dead-end filter (Fig. 5b). For a single layer of all composites, relatively fast breakthrough was observed after approximately 300 mL, resulting in effluent concentrations that quickly exceeded the current US EPA Pb action level of 15 μg L−1, corresponding to 90% removal.
With increasing filter layer thickness, we observed improved filter performance that resulted in larger volumes of water that could be treated, even maintaining the effluent concentration at or below the US EPA Pb action level for the duration of testing at the greatest thicknesses investigated. The thickness of a single layer of Fe5–PTA3 was determined to be ∼120 μm by cross-sectional SEM imaging (Fig. S17†). Increasing the thickness of Fe5–PTA3 by two-fold (through the simple stacking of two layers) produced a filter capable of maintaining 90% reduction in effluent Pb, at or near the US EPA Pb action level, for about 3 L before effluent Pb began to gradually increase. Pb removal improved at greater Fe5–PTA3 thicknesses, achieving 95% removal across 4 L of influent volume at a three-fold increase in thickness, and nearly 100% removal over 4 L of influent volume for a four-fold increase in thickness (∼480 μm) with only intermittent detectable effluent Pb. Similar behavior was observed with Fe5–SDS3 (Fig. S5c†), although more Pb breakthrough was observed at all thicknesses relative to the corresponding PTA-containing filter. Nevertheless, because flux was steady across all thicknesses given the high wettability and permeability of these materials, filter thickness is a viable design factor that we anticipate can be further increased to achieve near-zero effluent Pb concentrations over long filter run times.
XRD patterns for filters both before and at the conclusion of filtration experiments were comparable, revealing only the expected Fe oxide phase, indicating that separate Pb phases were not precipitated during filtration (Fig. S18†). Indeed, SEM imaging of the Fe5–PTA3 composite at the conclusion of the filtration experiment (Fig. S19†) showed no obvious signs of a new surface precipitate, while also providing evidence for the retention of the iron oxide particles. Thus, all available evidence is consistent with sorption (rather than precipitation) as the dominant mechanism for Pb removal.
We note that from qmax values obtained from isotherm experiments with Fe5(B)–SDS3 and Fe5(B)–PTA3, one layer of each filter material has the theoretical capacity to remove all of the Pb from a 4 L solution of 150 μg Pb per L (the theoretical capacities in mg of Pb for a single, double, triple, and quadruple layer filter of Fe5(B)–SDS3 and Fe5(B)–PTA3 range from 1.5 to 6 mg and 2.3 to 9.2 mg, respectively). It seems the extremely limited contact times within the filter (estimated as only 1.8 s assuming a linear flow velocity for 20 mL min−1) result in only a small fraction of the available Pb uptake capacity being used in the single pass (dead end) filtration set up. Nevertheless, 4 layers of Fe5(B)–PTA3 (∼0.24 g) were shown to produce nearly complete Pb removal over 4 L of feed solution containing 150 μg Pb per L. Thus, for deployment as single use technology (i.e., no regeneration, as is customary for most adsorptive media like activated carbon used for Pb removal) and assuming an average individual drinks 2 L of water per day, only ∼45 g of this material would be required annually to produce drinking water safe for human consumption.
 | ||
| Fig. 6 (a) Normalized dissolved Pb concentration (Pbeffluent/Pbinfluent) as a function of water volume passed through a quadruple layer filter (∼480 μm) of Fe5(B)–PTA3 at different volumetric flow rates (20, 35, and 50 mL min−1). (b) Average normalized Pb effluent concentration in the filter permeate as a function of filter layer thickness at 20, 35 and 50 mL min−1. Experimental conditions: total feed volume = 4 L, Pbinfluent = 150 μg L−1, effective nanofiber area = 12.6 cm2, and pH 6.5 with 10 mM HEPES buffer. | ||
Fig. 6b summarizes the average normalized Pb effluent concentration in the filter permeate (calculated as a simple average of all dissolved Pb concentrations measured in the effluent over the 4 L treatment) as a function of filter layer thickness. These data further illustrate the critical role that contact time plays in Pb removal when using Fe5–PTA3 for dead end filtration. Generally, we observed increased Pb removal (i.e., lower normalized effluent concentrations) at lower flow rates and with thicker filter layers. Thus, to improve dead end filter performance, it may be possible to fabricate thicker active filtration layers to achieve less Pb in the permeate. For example, assuming a linear decrease in effluent Pb concentration with filter thickness at a flow rate of 35 mL min−1, we estimate a filter approximately 960 μm thick would be necessary to achieve non-detectable dissolved Pb in the filter effluent.
 | ||
| Fig. 7 Total Pb removal (left y-axis) and flux (right y-axis) during a single pass-through a (a) double (∼240 μm) and (b) quadruple (∼480 μm) layer filter of Fe5(B)–PTA3. Also shown are the relative contributions of dissolved and particulate Pb measured in the filter permeate. Experimental conditions: total feed volume = 4 L, flow rate = 20 mL min−1, influent conditions are described in Table S1,† effective nanofiber area = 12.6 cm2, and pH 8.5. | ||
The permeate flux through the double-layer filter was maintained at approximately 950 L m−2 h−1 across the trial, whereas we observed a small (8%) decrease in permeate flux across the trial with a thicker (four-layer) filter. We attribute this loss to accumulation of particulate Pb within the pore space of the filter layer over time. Overall, total Pb removal showed similar trends in performance to those observed in experiments with soluble Pb (see Fig. 5b). The Pb removal efficiency for a double layer filter of the Fe5(B)–PTA3 composite remained at 85% for about 2.5 L before gradually increasing. The concentration of particulate Pb in the effluent gradually increased compared to soluble Pb, with the majority of Pb in the effluent being present in particulate form by the end of the filtration trial. For the thicker, quadruple layer filter, we observed ∼90% reduction in total Pb in the filter effluent, where once again the majority of the effluent Pb was present in particulate form. This result suggests that particulate Pb, presumably removed by physical entrapment within the pore space of the nanofiber filter layer, may be more difficult to remove in our dead-end apparatus than soluble Pb, which is removed primarily by sorption processes. We remain optimistic, however, that thicker filtration layers, which are the focus of our ongoing work, will be able to produce sufficient tortuosity for near-complete capture of particulate Pb simultaneously with sorption of dissolved Pb species.
4. Conclusion and implications
In this study, we used electrospinning to fabricate several organic acid-functionalized, polymer–iron oxide nanofiber composites and evaluated their performance and relative cost-effectiveness as POU water treatment devices. We examined seven different commercially available Fe oxides that ranged in key material properties (e.g., primary particle size; ranging from 5–50000 nm) and cost (ranging from 0.0001–4.960 $ per g). Ultimately, based on both lead removal in batch isotherm studies and material costs per unit mass, three Fe oxides (those of vendor B, D and E) were chosen for development into electrospun composites. For all composites, Pb removal increased with increasing Fe oxide loading, and we found that the additional inclusion of OAs such as PTA resulted in significantly higher performance than those with only Fe, achieving sorption capacities up to 40 mg Pb per g composite. Evidence presented herein suggests that the improved performance of PTA-functionalized materials can be attributed to several factors including: (i) stabilization of the Fe oxide nanoparticles in the electrospinning sol gel to improve dispersion in the electrospun composite; (ii) promotion of surface segregation to increase the abundance of Fe oxide at or near the composite surface; and (iii) the retention of a small amount of the PTA within the composite that contributes to Pb uptake through interactions with embedded carboxylic acid groups.
Beyond these fundamental insights into composite performance and reactivity, we used a dead-end, flow-through filtration system to simulate material use during POU water treatment, demonstrating the ability of the optimal composite material to remove both dissolved and particulate lead. Indeed, at an initial Pb concentration of 150 μg L−1 and a flow rate of 20 mL min−1, four layers (480 μm) of the optimal composites achieved near-complete removal of all Pb in 4 L of influent containing 150 μg L−1 of dissolved Pb. When particulate Pb was present (as 30% of the total Pb in the influent), this same composite filter achieved 90% total Pb removal, achieving effluent Pb levels at or near the US EPA action level, although the majority of lead in the effluent was particulate. Collectively, we contend that the results herein demonstrate the promise of PTA-functionalized PAN–Fe oxide composites for use as microfiltration membranes in water treatment applications, including at the point of use, so long as sufficiently thick filters can be manufactured to increase contact time during filtration and total Pb removal.
Although this work focused on a specific material and treatment application, we contend it provides valuable, generalizable insights related to the development of nanomaterial-enabled technologies for environmental applications. First, we demonstrate the need for more study of nanomaterials other than the research grade materials most often used in fundamental research investigations. As we encountered for the Fe oxides used in our prior work,20 high quality, research grade materials are often cost-prohibitive and not produced in sufficient or reliable quantities for technology development. There remain opportunities to explore the properties and performance of lower quality, industrial-grade nanomaterials that are more likely to be produced in quantities and available at costs necessary for technology scale up. This is especially true in POU water treatment applications, where many existing technologies use low-cost forms of activated carbon. To effectively harness the promise of nanomaterials, technology development will need to find balance between high performance (afforded by beneficial nanomaterial properties including large specific surface area) and material cost (with smaller particles generally more expensive than larger ones).
Second, we demonstrate the benefit of simple and versatile fabrication routes for the development of multi-functional nanomaterials for use in environmental applications. Herein, we exploit organic acid-nanoparticle interactions to create a three-dimensional network of composite nanofibers that are suitable for use as a depth filter for particulate removal and also enriched in sorption sites (through surface segregation) for dissolved metal removal. Our work has long focused on electrospinning because it is a proven, industrially viable route to the production of polymer nanofibers, and recent technological advances (e.g., multi-nozzle and needleless electrospinning) are increasing the throughput of this fabrication technique. The discovery of a simple, one-pot synthesis for functionalized nanofiber composites, which we suspect is translatable to other polymers and nanoparticle additives, should advance nanomaterial-based technology development by decreasing the complexity and cost of fabrication.
There remains need for additional work with these and other composite-based nanofiber materials. For example, one potential limitation of PAN-based composites is that they are somewhat brittle, and thus may not be best suited for manufacturing (e.g., rolling) into a POU filtration device. Prior work by our group,38 supported by tensile strength testing, has found that other types of electrospun polymers such as polyamide-6 (also known as nylon-6) tend to be more mechanically durable. Accordingly, a priority for future work will be extending the findings herein on organic acid functionalization of PAN-based composites to other, more robust polymer nanofiber systems that may be better suited for POU filter development.
Data availability
The data supporting this article have been included as part of the main manuscript and ESI.†Conflicts of interest
There are no conflicts to declare.Acknowledgements
This material is based upon work supported by the National Science Foundation under Grant Numbers 2232527, 2231816, 2029909 and 1940777. The authors also would like to thank the Central Microscopy Research Facility at University of Iowa, and the Materials Analysis, Testing, and Fabrication Facility at University of Iowa. The authors would also like to acknowledge the helpful comments of two anonymous reviewers whose suggestions greatly improved the clarity and impact of this work. We dedicate this work to Dr. Katherine Peter, a brilliant researcher and even more exceptional person who will be remembered for her innovation, intellect, creativity and determination.References
- US EPA, Basic Information about Lead in Drinking Water, Available at: https://www.epa.gov/ground-water-and-drinking-water/basic-information-about-lead-drinking-water#.
- G. F. Nordberg, Human health effects of metals in drinking water: relationship to cultural acidification, Environ. Toxicol. Chem., 1990, 9, 887–894 CrossRef CAS.
- W. Pan, E. R. Johnson and D. E. Giammar, Lead phosphate particles in tap water: challenges for point-of-use filters, Environ. Sci. Technol. Lett., 2021, 8, 244–249 CrossRef CAS.
- M. A. Del Toral, A. Porter and M. R. Schock, Detection and evaluation of elevated lead release from service lines: a field study, Environ. Sci. Technol., 2013, 47, 9300–9307 CrossRef CAS PubMed.
- C.-C. Wu, S. Ghosh, K. J. Martin, A. J. Pinto, V. J. Denef, T. M. Olson and N. G. Love, The microbial colonization of activated carbon block point-of-use (PoU) filters with and without chlorinated phenol disinfection by-products, Environ. Sci.: Water Res. Technol., 2017, 3, 830–843 RSC.
- V. Bosscher, D. A. Lytle, M. R. Schock, A. Porter and M. Del Toral, POU water filters effectively reduce lead in drinking water: a demonstration field study in flint, Michigan, J. Environ. Sci. Health, Part A: Toxic/Hazard. Subst. Environ. Eng., 2019, 54, 484–493 CrossRef CAS.
- State of Michigan, Department of Environment, Great Lakes, and Energy, Available at: https://www.michigan.gov/egle/about/organization/drinking-water-and-environmental-health/school-drinking-water-program/filter-first.
- US EPA, Proposed Lead and Copper Rule improvements, Available at: https://www.epa.gov/system/files/documents/2023-12/lcri-faq_statespws_11.28.23-nr.pdf.
- US EPA, EPA Launches New Initiative to Accelerate Lead Pipe Replacement to Protect Underserved Communities, Available at: https://www.epa.gov/newsreleases/epa-launches-new-initiative-accelerate-lead-pipe-replacement-protect-underserved.
- D. A. Lytle, M. R. Schock, C. Formal, C. Bennett-Stamper, S. Harmon, M. N. Nadagouda, D. Williams, M. K. DeSantis, J. Tully and M. Pham, Lead particle size fractionation and identification in Newark, New Jersey's drinking water, Environ. Sci. Technol., 2020, 54, 13672–13679 CrossRef CAS.
- J. M. Purchase, R. Rouillier, K. J. Pieper and M. Edwards, Understanding failure modes of NSF/ANSI 53 lead-certified point-of-use pitcher and faucet filters, Environ. Sci. Technol. Lett., 2020, 8, 155–160 CrossRef.
- C. K. Pooi and H. Y. Ng, Review of low-cost point-of-use water treatment systems for developing communities, npj Clean Water, 2018, 1, 11 CrossRef.
- US EPA, Point-of-Use Reverse Osmosis Systems, Available at: https://www.epa.gov/watersense/point-use-reverse-osmosis-systems.
- K. T. Peter, N. V. Myung and D. M. Cwiertny, Surfactant-assisted fabrication of porous polymeric nanofibers with surface-enriched iron oxide nanoparticles: composite filtration materials for removal of metal cations, Environ. Sci.: Nano, 2018, 5, 669–681 RSC.
- R. M. Cornell and U. Schwertmann, The Iron Oxides: Structure, Properties, Reactions, Occurences and Uses, Wiley, 2003, DOI:10.1002/3527602097.
- L. Persano, A. Camposeo, C. Tekmen and D. Pisignano, Industrial upscaling of electrospinning and applications of polymer nanofibers: a review, Macromol. Mater. Eng., 2013, 298, 504–520 CrossRef CAS.
- M. Kalagasidis Krušić, N. Milosavljević, A. Debeljković, Ö. Üzüm and E. Karadağ, Removal of Pb2+ ions from water by poly (acrylamide-co-sodium methacrylate) hydrogels, Water, Air, Soil Pollut., 2012, 223, 4355–4368 CrossRef.
- A. A. Alghamdi, A.-B. Al-Odayni, W. S. Saeed, A. Al-Kahtani, F. A. Alharthi and T. Aouak, Efficient adsorption of lead (II) from aqueous phase solutions using polypyrrole-based activated carbon, Materials, 2019, 12, 2020 CrossRef CAS.
- K. Simeonidis, S. Mourdikoudis, E. Kaprara, M. Mitrakas and L. Polavarapu, Inorganic engineered nanoparticles in drinking water treatment: a critical review, Environ. Sci.: Water Res. Technol., 2016, 2, 43–70 RSC.
- C. R. Evanko and D. A. Dzombak, Influence of structural features on sorption of NOM-analogue organic acids to goethite, Environ. Sci. Technol., 1998, 32, 2846–2855 CrossRef CAS.
- K. T. Peter, A. J. Johns, N. V. Myung and D. M. Cwiertny, Functionalized polymer-iron oxide hybrid nanofibers: Electrospun filtration devices for metal oxyanion removal, Water Res., 2017, 117, 207–217 CrossRef CAS PubMed.
- International Chemical Safety Cards, Lead Nitrate, Available at: https://chemicalsafety.ilo.org/dyn/icsc/showcard.display?p_version=2&p_card_id=1000.
- National Science Foundation, NSF/ANSI 53, Available at: https://www.nsf.org/knowledge-library/nsf-ansi-42-53-and-401-filtration-systems-standards.
- S. Mirmohammad Sadeghi, M. Vaezi, A. Kazemzadeh and R. Jamjah, Morphology enhancement of TiO2/PVP composite nanofibers based on solution viscosity and processing parameters of electrospinning method, J. Appl. Polym. Sci., 2018, 135, 46337 CrossRef.
- R. Mohammed, H. H. El-Maghrabi, A. A. Younes, A. Farag, S. Mikhail and M. Riad, SDS-goethite adsorbent material preparation, structural characterization and the kinetics of the manganese adsorption, J. Mol. Liq., 2017, 231, 499–508 CrossRef CAS.
- W. Xu, Z.-X. Si, M. Xie, L.-X. Zhou and Y.-Q. Zheng, Experimental and theoretical approaches to three uranyl coordination polymers constructed by phthalic acid and N, N′-donor bridging ligands: crystal structures, luminescence, and photocatalytic degradation of tetracycline hydrochloride, Cryst. Growth Des., 2017, 17, 2147–2157 CrossRef CAS.
- K. V. Korpany, D. D. Majewski, C. T. Chiu, S. N. Cross and A. S. Blum, Iron oxide surface chemistry: effect of chemical structure on binding in benzoic acid and catechol derivatives, Langmuir, 2017, 33, 3000–3013 CrossRef CAS.
- C. D. Bruce, M. L. Berkowitz, L. Perera and M. D. Forbes, Molecular dynamics simulation of sodium dodecyl sulfate micelle in water: micellar structural characteristics and counterion distribution, J. Phys. Chem. B, 2002, 106, 3788–3793 CrossRef CAS.
- A. Zotov, N. Akinfiev and L. Koroleva, Thermodynamic properties of o-phthalic acid and its products of dissociation at 0–200° C and 1–5000 bar, Russ. J. Phys. Chem. A, 2013, 87, 1259–1265 CrossRef CAS.
- Y. S. Hwang, J. Liu, J. J. Lenhart and C. M. Hadad, Surface complexes of phthalic acid at the hematite/water interface, J. Colloid Interface Sci., 2007, 307, 124–134 CrossRef CAS PubMed.
- X. Jin, D. Wu, C. Liu, S. Huang, Z. Zhou, H. Wu, X. Chen, M. Huang, S. Zhou and C. Gu, Facet effect of hematite on the hydrolysis of phthalate esters under ambient humidity conditions, Nat. Commun., 2022, 13, 6125 CrossRef CAS.
- L. C. Oliveira, W. G. Botero, T. S. Farias, J. C. Santos, G. V. Gabriel, D. Goveia, T. A. Cacuro and W. R. Waldman, Application of natural organic residues as adsorbents to remove lead from waters, Water, Air, Soil Pollut., 2019, 230, 1–11 CrossRef CAS.
- X. Wang, L. Wang, Y. Wang, R. Tan, X. Ke, X. Zhou, J. Geng, H. Hou and M. Zhou, Calcium sulfate hemihydrate whiskers obtained from flue gas desulfurization gypsum and used for the adsorption removal of lead, Crystals, 2017, 7, 270 CrossRef.
- S. Deng, R. Bai and J. P. Chen, Aminated polyacrylonitrile fibers for lead and copper removal, Langmuir, 2003, 19, 5058–5064 CrossRef CAS.
- S. Xiao, H. Ma, M. Shen, S. Wang, Q. Huang and X. Shi, Excellent copper (II) removal using zero-valent iron nanoparticle-immobilized hybrid electrospun polymer nanofibrous mats, Colloids Surf., A, 2011, 381, 48–54 CrossRef CAS.
- A. K. Tummanapelli and S. Vasudevan, Estimating successive p K a values of polyprotic acids from ab initio molecular dynamics using metadynamics: the dissociation of phthalic acid and its isomers, Phys. Chem. Chem. Phys., 2015, 17, 6383–6388 RSC.
- S. Takao, S. Rajabzadeh, C. Otsubo, T. Hamada, N. Kato, K. Nakagawa, T. Shintani, H. Matsuyama and T. Yoshioka, Preparation of Microfiltration Hollow Fiber Membranes from Cellulose Triacetate by Thermally Induced Phase Separation, ACS Omega, 2022, 7, 33783–33792 CrossRef CAS PubMed.
- Y. Y. Choi, D. T. H. To, S. Kim, D. M. Cwiertny and N. V. Myung, Mechanically durable tri-compotie polyamide6/hematitie nanoparticle/tetra-n-bytylammonium bromide (PA6/α-Fe2O3/TBAB) nanofiber based membranes for phosphate remediation, Front. Chem., 2024, 12, 1472640 CrossRef CAS PubMed.
Footnote |
| † Electronic supplementary information (ESI) available. See DOI: https://doi.org/10.1039/d4en00902a |
| This journal is © The Royal Society of Chemistry 2025 |