
 Open Access Article
 This Open Access Article is licensed under a
 Creative Commons Attribution 3.0 Unported Licence
Sorption of arsenate on cerium oxide: a simulated infrared and Raman spectroscopic identification†
Khoa Minh
Ta
 a,
Deyontae O.
Wisdom
a,
Lisa J.
Gillie
a,
David J.
Cooke
a,
Runliang
Zhu
bcd,
Mário A.
Gonçalves
e,
Stephen C.
Parker
f and
Marco
Molinari
*a
a,
Deyontae O.
Wisdom
a,
Lisa J.
Gillie
a,
David J.
Cooke
a,
Runliang
Zhu
bcd,
Mário A.
Gonçalves
e,
Stephen C.
Parker
f and
Marco
Molinari
*a
aDepartment of Physical and Life Sciences, School of Applied Sciences, University of Huddersfield, Queensgate, Huddersfield HD1 3DH, UK. E-mail: m.molinari@hud.ac.uk
bCAS Key Laboratory of Mineralogy and Metallogeny, Guangdong Provincial Key Laboratory of Mineral Physics and Materials, Guangzhou Institute of Geochemistry, Chinese Academy of Sciences, Guangzhou 510640, China
cCAS Center for Excellence in Deep Earth Science, Guangzhou 510640, China
dUniversity of Chinese Academy of Sciences, Beijing 100049, China
eDepartment of Geology and IDL, Faculty of Sciences, University of Lisbon, Campo Grande, 1749-016 Lisbon, Portugal
fDepartment of Chemistry, University of Bath, Claverton Down, Bath BA2 7AY, UK
First published on 10th January 2025
Abstract
Ceria (CeO2) is a candidate for arsenic removal, and characterizing its surface speciation is crucial for controlling its removal ability. Here, we focus on arsenates and exploit ab initio calculations to study their interaction with the three most stable surfaces of CeO2. The adsorption of arsenate is stronger on the {100} surface followed by the {110} and {111} surfaces. We find that arsenate can potentially adsorb to CeO2 surfaces, with a range of binding configurations. Interestingly, we discovered a 5-fold coordinated As(V) species in a trigonal bipyramidal coordination, which is stable and displays a strong interaction with the surfaces, pulling oxygen out of the surfaces, which should be a valuable model to address in As adsorption experiments such as EXAFS. We then predict the infrared (IR) and Raman spectral signatures, finding that adsorbed arsenates have a characteristic spectral fingerprint between 200 and 1200 cm−1. Characteristic peaks compared with experiments gives confidence in the modelling. The 5-fold coordinated As species in particular shows potential diagnostic As–O stretching modes between 635–756 cm−1 in IR spectra and 387–521 cm−1 in Raman spectra. While all binding modes for arsenate adsorption on ceria provide IR active modes, interestingly this is not the case for Raman active modes. Here, we provide a set of reference spectra and binding modes for arsenates on CeO2 that can further experimental characterization of arsenate speciation, and provide control of its impact on the removal performance of cerium dioxide.
Environmental significanceMetal oxide phases are important materials for removal and control of As in natural aqueous solution because of their strong interactions with As complexes. Highly efficient adsorbents, such as cerium oxide nanoparticles, are thus worth studying for As removal in natural systems. While there is a wealth of data on As adsorption mechanisms on natural metal (hydr)oxides, less is known about Ce oxides. A new 5-fold As complex is proposed and spectroscopic data on other As surface complex species is produced aiming to assist on the characterization of adsorption mechanisms and adsorbent selective studies. These findings can equally be extended to similar metal oxide systems. |
1. Introduction
Arsenic based compounds are abundant in water in several countries including China, Cambodia, India, Bangladesh, the coastal aquifers of Australia, West Africa, Western USA and Northern Chile.1–4 A safety guideline has been set out for the concentration of arsenic not to be greater than 10 ppb in drinking water by the World Health Organization (WHO),5 as the long-term exposure to the inorganic form of arsenic is reported to cause severe health problems including cancer, cardiovascular diseases and diabetes.6 Inorganic arsenic also relates to the suppression of cognitive development in early-age infants.7–9 Therefore, it is essential to monitor, detect and remove arsenic from water sources and drinking water.10,11In ground water, arsenic is found mainly to be in two ionic forms including arsenate, As(V), and arsenite, As(III). Arsenic is known to develop a strong affinity with natural metal (hydr)oxides,12,13 including the ability to attenuate As concentrations in mine drainage waters under proper conditions.14 Cerium oxide also shows good interaction toward both species, hence it can be considered as a potential option for arsenic removal in water.15–21 In Li et al. the “hydrous cerium oxide” produced by the authors could remove more than 100 mg g−1 of both As(V) and As(III) species.16 Although depending on the synthesis conditions of nanoparticles and of the aqueous solution used, ceria nanoparticles were able to remove 95% of both arsenate and arsenite species within one hour,20 while coating provides a >90% removal toward As(V).21 In general nanoceria exhibit a more favourable adsorption with As(III) than As(V) across the full pH range.22 Ce4+ can oxide As(III) to As(V), while Ce3+ can reduce As(V) to As(III), thanks to the localised electron in the 4f orbital of Ce3+.23
It is known that the surface chemistry and composition of nanoceria play an important role in the interaction with molecular species.24–28 However, little is known about adsorbed arsenates, As(V), on nanoceria, with some IR spectroscopy finding characteristic peaks for stretching (828 and 839 cm−1)20,29 and bending (470 cm−1)29 modes. Modes of adsorption are unknown on ceria but arsenates have displayed both monodentate and bidentate complexes on other metal oxides (e.g. iron oxide).30–32 Knowing the adsorption modes has also been fundamental for the modelling and prediction of As species in macroscopic natural systems using surface complexation modelling (SCM).33–35 Ceria is expected to remove arsenate via the exchange of the surface hydroxyl with water dissolved arsenate ions.23
Previously, we have demonstrated that the adsorption of phosphate species may occur in trigonal bipyramidal configurations wherein the oxygen atoms of the ceria surfaces are bound to the phosphorus atom.25 This is speculated to be the first step towards the scavenging of CeO2 by phosphates to form CePO4.36,37 Such information is not available for arsenates, and the formation of CeAsO4 upon adsorption of arsenates is unknown. Due to the similarity of phosphates and arsenates, with both P and As atoms in a +5 oxidation state and both species 4-fold coordinated, it is worth investigating if similar arsenate adsorption modes on ceria nanoparticles are equally likely to be formed.
This work aims to study the adsorption of arsenates on the three most important {100}, {110}, and {111} surfaces of CeO2, employing density functional theory (DFT) calculations and lattice dynamics to simulate the surface speciation of ceria in the presence of arsenates. Furthermore, our research aims to provide computational vibrational analyses of the most stable surface bound arsenate species by simulating the IR and Raman spectra and to demonstrate that these spectroscopic techniques can be a sensitive probe for studying the interaction of arsenates with ceria. This approach and the obtained results are fundamental for the complete characterization of As dispersion and fate in natural systems. These results obtained can help and guide the search for new forms of adsorption mechanisms and formation of structural complexes. These are fundamental steps to predict long-term As fixation and to design efficient As-removal adsorbents.
2. Methods
Calculations were performed using density-functional theory (DFT) as implemented using the Vienna Ab initio Simulation Package (VASP) code.38–40 All calculations were carried out using the generalised-gradient approximation (GGA) exchange–correlation functional of Perdew, Burke and Ernzerhof (PBE).41,42 A plane wave cut-off energy of 500 eV was used. The ion cores were modelled using projector augmented-wave (PAW) pseudopotentials,43,44 with frozen cores of [Kr] for Ce, and [He] for O and As atoms to model the valence electronic structure. The electron localisation of the Ce 4f orbitals was considered using the DFT+U using the Dudarev method.45 The use of PBE+U with Ueff = 5 eV is standard for CeO2.24,25,27,46–52Like in our previous study, the minimised CeO2 bulk structure retains the Fm![[3 with combining macron]](https://www.rsc.org/images/entities/char_0033_0304.gif) m space group with a lattice constant of 5.498 Å,25 which is a known overestimation compared with the experimental value of 5.411 Å.53
m space group with a lattice constant of 5.498 Å,25 which is a known overestimation compared with the experimental value of 5.411 Å.53
The slab models of the {100}, {110}, and {111} surfaces were generated from the minimised bulk CeO2 unit cell using the methodology described in our previous study25 and the METADISE code.54 The {100} and {110} surface models correspond to a  and
and  × 1 expansions of the primitive unit cell, respectively, each with 7 surface layers and 28 CeO2 formula units, and the {111} model corresponds to a
  expansion with 5 surface layers and 20 CeO2 formula units. The surface models were optimised at constant volume, with the top and the bottom layers allowed to relax, using electronic total energy and ionic force convergence criteria of 1 × 10⁻⁵ eV and 1 × 10⁻² eV Å−1. A k-point grid with 2 × 2 × 1 subdivision was used to sample the Brillouin zones.
For each surface, we attempted to minimize several models with arsenic acid adsorbed on the surface in different binding configurations. In some cases, arsenic acid dissociated following adsorption (i.e. its hydrogen atoms transferred to the surface oxygen atoms to form hydroxyl groups). The dissociation observed in each model is listed in Table S1.† Images of the structural models were generated using VESTA.55
We simulated the infrared (IR) and Raman spectra of arsenates adsorbed on the surfaces of ceria using the procedure outlined in ref. 56, where harmonic lattice dynamics calculations at constant volume are employed. For each configuration, a Γ-point phonon calculation was performed employing the finite-displacement approach as implemented in the Phonopy code,57 with a displacement length of 5 × 10⁻³ Å. Accurate single-point force calculations were performed using the VASP code as a minimizer, and a tight electronic convergence criterion (1 × 10⁻⁹ eV). All the configurations examined are dynamically stable as they did not show any imaginary modes. The IR activities were computed using the Born effective-charge tensors calculated via the density-functional perturbation theory (DFPT)58 as implemented in the VASP code. The Raman activities were computed from the changes in the macroscopic dielectric tensor when the atoms in the structure are displaced by ±5 × 10⁻³ Å along each normal-mode vector, with the tensors calculated via DFPT. For this approach, further details are in ref. 56 and 59. The assignments of the spectral bands were carried out using animations of the phonon modes generated via the Phonopy code and visualized via VMD.60
3. Results and discussion
Determining the structure, energetics and spectroscopic fingerprint of adsorbed arsenates on oxide CeO2 is key to understand and model this system, since these oxides can be effective scavengers for As. Particularly, we have focused on the 4-fold As adsorption where the arsenate species is in the common tetrahedral shape with four oxygen atoms surrounding the As atom. However, our previous study related to the adsorption of phosphate on cerium oxide has shown that a 5-fold coordinated species arises when P is adsorbed on the surfaces of CeO2.25 For this reason, we have also investigated the possibility to have such species for As when adsorbed on CeO2. This species sees 5 oxygen atoms arranged around As in a trigonal bipyramidal configuration. Such 5-fold As species could be an intermediate state of the scavenging of As towards cerium oxide surfaces, a feature that has been reported for phosphate but not for arsenate so far.3.1. Structure and energetics of adsorbed arsenates on CeO2 surfaces
The three most stable {100}, {110}, and {111} surfaces of CeO2 are adsorbed with arsenates in different binding configurations. For these configurations, we use the generic label {hkl}-xOAs-yOsurf, where {hkl} is the Miller index of the surface, x is the oxygen coordination of the As species (either 4 or 5 for tetrahedral or trigonal bipyramidal coordination), and y is the adsorption denticity of the arsenate on the surface based on the number of Ce–O bonds (denticities of 1, 2 and 3 indicate monodentate, bidentate or tridentate binding). For example, {111}-4OAs-3Osurf denotes arsenate adsorbed to the {111} surface as a 4-fold coordinated As species with a tridentate adsorption configuration.Considering the wealth of EXAFS data on As adsorption, there are some general statements showing a consistency of results regarding As adsorption structure and mechanisms.32 Two of the most important refer the predominant formation of inner-sphere complexes, and the maintenance of the coordination geometries in all of the adsorption modes, which means the tetrahedral coordination. However, these authors note that such consistency may be fundamentally due to the fitting of O of the oxyanion species as one average shell, instead of considering them in separate groups. In EXAFS, 4 sorption modes have been identified32 with the clear predominance of inner-sphere (IS) over outer-sphere (OS) complexes, especially the formation of the bidentate, corner-sharing, IS complex.
The strength of the interaction between adsorbed arsenates and CeO2 surfaces is given by the adsorption energy (eqn (S1)†), which we present in Fig. 1 for all the stable configurations (numerical values are presented in Table S1†). Fig. 2 present the stable configurations, while Table S2† presents the extent of the arsenate dissociations for all configurations.
 | ||
| Fig. 1 Adsorption energies of arsenate species in different binding configurations on the stoichiometric {111}, {110}, and {100} surfaces of CeO2. 5OAs denotes five-fold coordinated As species, and 4OAs-1Osurf, 4OAs-2Osurf, 4OAs-3Osurf denote four-fold coordinated As species adsorbed in monodentate, bidentate and tridentate configurations, respectively. | ||
 | ||
| Fig. 2 Arsenate adsorption configurations on the {100}, {110}, and {111} stoichiometric surfaces of CeO2. (a)–(c) As in a five-fold trigonal bipyramidal configuration. (d)–(j) As in a four-fold tetrahedral configuration. The dashed blue lines in (a)–(c) show the surface plane to emphasise surface O atoms pulled out by arsenates as described in the text. The atom colours are as follows: O – red, Ce – yellow, As – green, and H – white. | ||
All energies are negative, implying stable adsorption configurations. The adsorption of arsenate on the {100} surface is generally more stable. The {100} surface is also the only one where a monodentate adsorption is stable ({100}-4OAs-1Osurf). The second most stable adsorption is on the {110} surface followed by the {111} surface. 5-Fold coordinate As species are bound to the {100} and {110} surfaces less strongly than 4-fold coordinate As species. Surprisingly this is not the case for the {111} surface where the 5OAs is more stable than any 4OAs configurations. Such trigonal bipyramidal 5-fold coordinated As has not yet been detected in adsorption experiments using either EXAFS or DFT calculations,61,62 but although no structure has been proposed, As models with coordination numbers between 4.6 and 4.8 have been used in the fitting of EXAFS spectra of As adsorbed onto Fe–Ce bimetal oxide.63
Arsenate is very similar to phosphate, as P and As belong to the same pnictogen group of the periodic table (group 15), and thus can be compared with the available literature.25 The adsorption of 5-fold arsenate species on nanoceria is more energetically stable than 5-fold phosphate species. The adsorption of 4-fold arsenate species is less energetically stable than adsorbed 4-fold phosphate species, except for {110}-4OAs-2Osurf. The differences in energies are presented in Table S1.†
The binding energy of arsenate is stronger than the adsorption of water on nanoceria surfaces (−0.5, −1.2, and −1.6 eV for the {111}, {110}, and {100} surfaces, respectively52), implying that arsenate will adsorb as IS complexes on the surfaces of cerium oxide in an aqueous environment.
We investigated three different adsorption configurations of 4OAs, viz. monodentate, bidentate and tridentate (Fig. 2d–j).
Both {111}-4OAs-3Osurf and {100}-4OAs-3Osurf configurations have the most negative adsorption energies compared to the monodentate and bidentate adsorptions, which indicates that 4OAs is preferably adsorbed as tridentate binding configurations on the {100} and {111} surfaces. The {110} surface expresses a different affinity towards arsenate, where the bidentate binding configuration {110}-4OAs-2Osurf is preferred compared to all other binding configurations.
The three arsenate oxygen atoms (OAs) of the {100}-4OAs-3Osurf configuration embed into the surface at a similar height of the surface oxygen atoms (Osurf) to form the tridentate binding configuration. This is due to the flexibility and mobility of the surface oxygens of the {100} surface,25,27,46,64,65 which allows for the surface rearrangement to accommodate the adsorption, which leads to the strongest adsorption energy (−4.14 eV) compared to all other adsorption configurations. Unlike the tridentate adsorption of 4OAs on the {100} and {111} surfaces, the {110}-4OAs-3Osurf configuration has three Ce–OAs bonds, with two of them elongated (2.36 vs. 2.61 Å) alongside two hydrogen bonds; however, this is not sufficient to stabilize this configuration further compared to {110}-4OAs-2Osurf (−2.36 eV vs. −2.98 eV).
The 4OAs bidentate adsorption on all three surfaces has two direct Ce–OAs bonds (Fig. 2). The adsorption stability follows the order {100}-4OAs-2Osurf > {110}-4OAs-2Osurf > {111}-4OAs-2Osurf, indicating that the strongest bidentate adsorption occurs again on the {100} surface.
We attempted to stabilize 4OAs monodentate configurations on all three surfaces of ceria, but we could only stabilize it for the {100} surface, and its adsorption energy is −2.26 eV. {100}-4OAs-1Osurf has a crowded hydrogen bond network, which prevents the adsorption from rearranging to bidentate or tridentate.
3.2. Vibrational signatures of adsorbed arsenate species
The simulated IR and Raman spectra of the adsorbed arsenate on nanoceria surfaces are discussed using the notation used in our previous study on phosphate species.25ν denotes stretching modes, δ bending, ρ rocking, ω wagging, sc scissoring, and t twisting modes. The subscripts s and as identify symmetric and asymmetric modes, where relevant, and we denote longitudinal (within the surface plane) and transverse (perpendicular to the surface plane) modes by L or T in parentheses. We denote bulk and surface O atoms as Obulk and Osurf, respectively, and we further distinguish the surface O directly bonded to the As atom in the 5OP configurations as *Osurf. Finally, OAs and OHAs denote O and OH (hydroxyl) groups belonging to arsenate, OHsurf indicates a surface hydroxyl group, and Hsurf and HAs denote H adsorbed on the surface and As oxygen atoms, respectively.The Ce–O stretch for bulk CeO2 has a single IR signal at 274 cm−1,25 which is a good representation of the 272 cm−1 from experimental measurements.66 Computationally, the Raman active signal is in the range of 434–437 cm−1,25,59 which is underestimated compared to the experimental value of 464 cm−1.67 For all surfaces, both IR and Raman spectra display characteristic peaks in the region 0–500 cm−1.25
![[double bond, length as m-dash]](https://www.rsc.org/images/entities/char_e001.gif) OAs; Table 1 and Fig. S1†). The bending modes δAs–OHAs, δAs–(OHAs)2 of the adsorbed As species are predicted to be at 428 cm−1 and 1065 cm−1. Experimentally the IR active bending modes δAs–OAs of the adsorbed arsenate have been measured at 470 cm−1, which is the same region of the IR active modes of the surface of cerium oxide.29 The IR spectra of the adsorbed arsenates on ceria surfaces also display peaks above 2000 cm−1 (raw spectra in Fig. S2 and full spectra in Fig. S3†) corresponding to the stretching of the hydroxyl groups (νO–Hsurf/νO–HAs), which are in good agreement with the literature.20,30,68,69
OAs; Table 1 and Fig. S1†). The bending modes δAs–OHAs, δAs–(OHAs)2 of the adsorbed As species are predicted to be at 428 cm−1 and 1065 cm−1. Experimentally the IR active bending modes δAs–OAs of the adsorbed arsenate have been measured at 470 cm−1, which is the same region of the IR active modes of the surface of cerium oxide.29 The IR spectra of the adsorbed arsenates on ceria surfaces also display peaks above 2000 cm−1 (raw spectra in Fig. S2 and full spectra in Fig. S3†) corresponding to the stretching of the hydroxyl groups (νO–Hsurf/νO–HAs), which are in good agreement with the literature.20,30,68,69
| IR mode arsenate | Adsorbed arsenate on CeO2 (PBE+U, this study) | Adsorbed arsenate on CeO2 (Expt)20,29 | Molecular arsenate (PBE+U, this study) | Molecular arsenate (DFT)68 | Arsenate (aq) (Expt)69,70 | IR mode phosphate | Adsorbed phosphate (PBE+U)25 |
|---|---|---|---|---|---|---|---|
| ρOAs–HAs | 284–350, 885 | — | 134–317, 952–986 | 215–330 | — | ρOp–Hp | 547–977 |
| ρOsurf–Hsurf | 417, 778–894 | — | — | — | — | 618–870 | |
| νOAs–HAs | 2732–3694 | — | 3684–3699 | 3700–4092 | — | — | |
| νOsurf–Hsurf | 2507–3207 | — | — | — | — | — | — |
| t, ωO2As(OH)2 | 287 | — | — | 250–330 | — | — | — |
| ν, ρ, δAs–*Osurf | 635–756 | — | — | — | — | νP–*Osurf | 680–695 |
| ν sAs–OHAs | 591–979 | 828, 839 (ref. 20) | 656–695 | 493–924 | — | ν sP–OHp | 796–833 |
| ν asAs–OHAs | — | 677 | 852–1008 | — | ν asP–OHp | 853–1007 | |
| ν sAs–OAs | 778–848 | — | 812–924 | 875–878,70 830–890 (ref. 69) | ν sP–Op | 965–1077 | |
| ν asAs–OAs | 783–894 | — | 852–1008 | 858–908,70 830–890 (ref. 69) | ν asP–Op | 985–1160 | |
| δAs–OHAs; δAs–(OHAs)2 | 324–349, 975 | 470 (ref. 29) | 278–292, 1032 | 1028–1157 | 315–385,70 1170 (ref. 69) | δP–OHp | 1043–1077 |
| δAs–OAs; δAs–(OAs)2 | 273–320 | 280–292 |
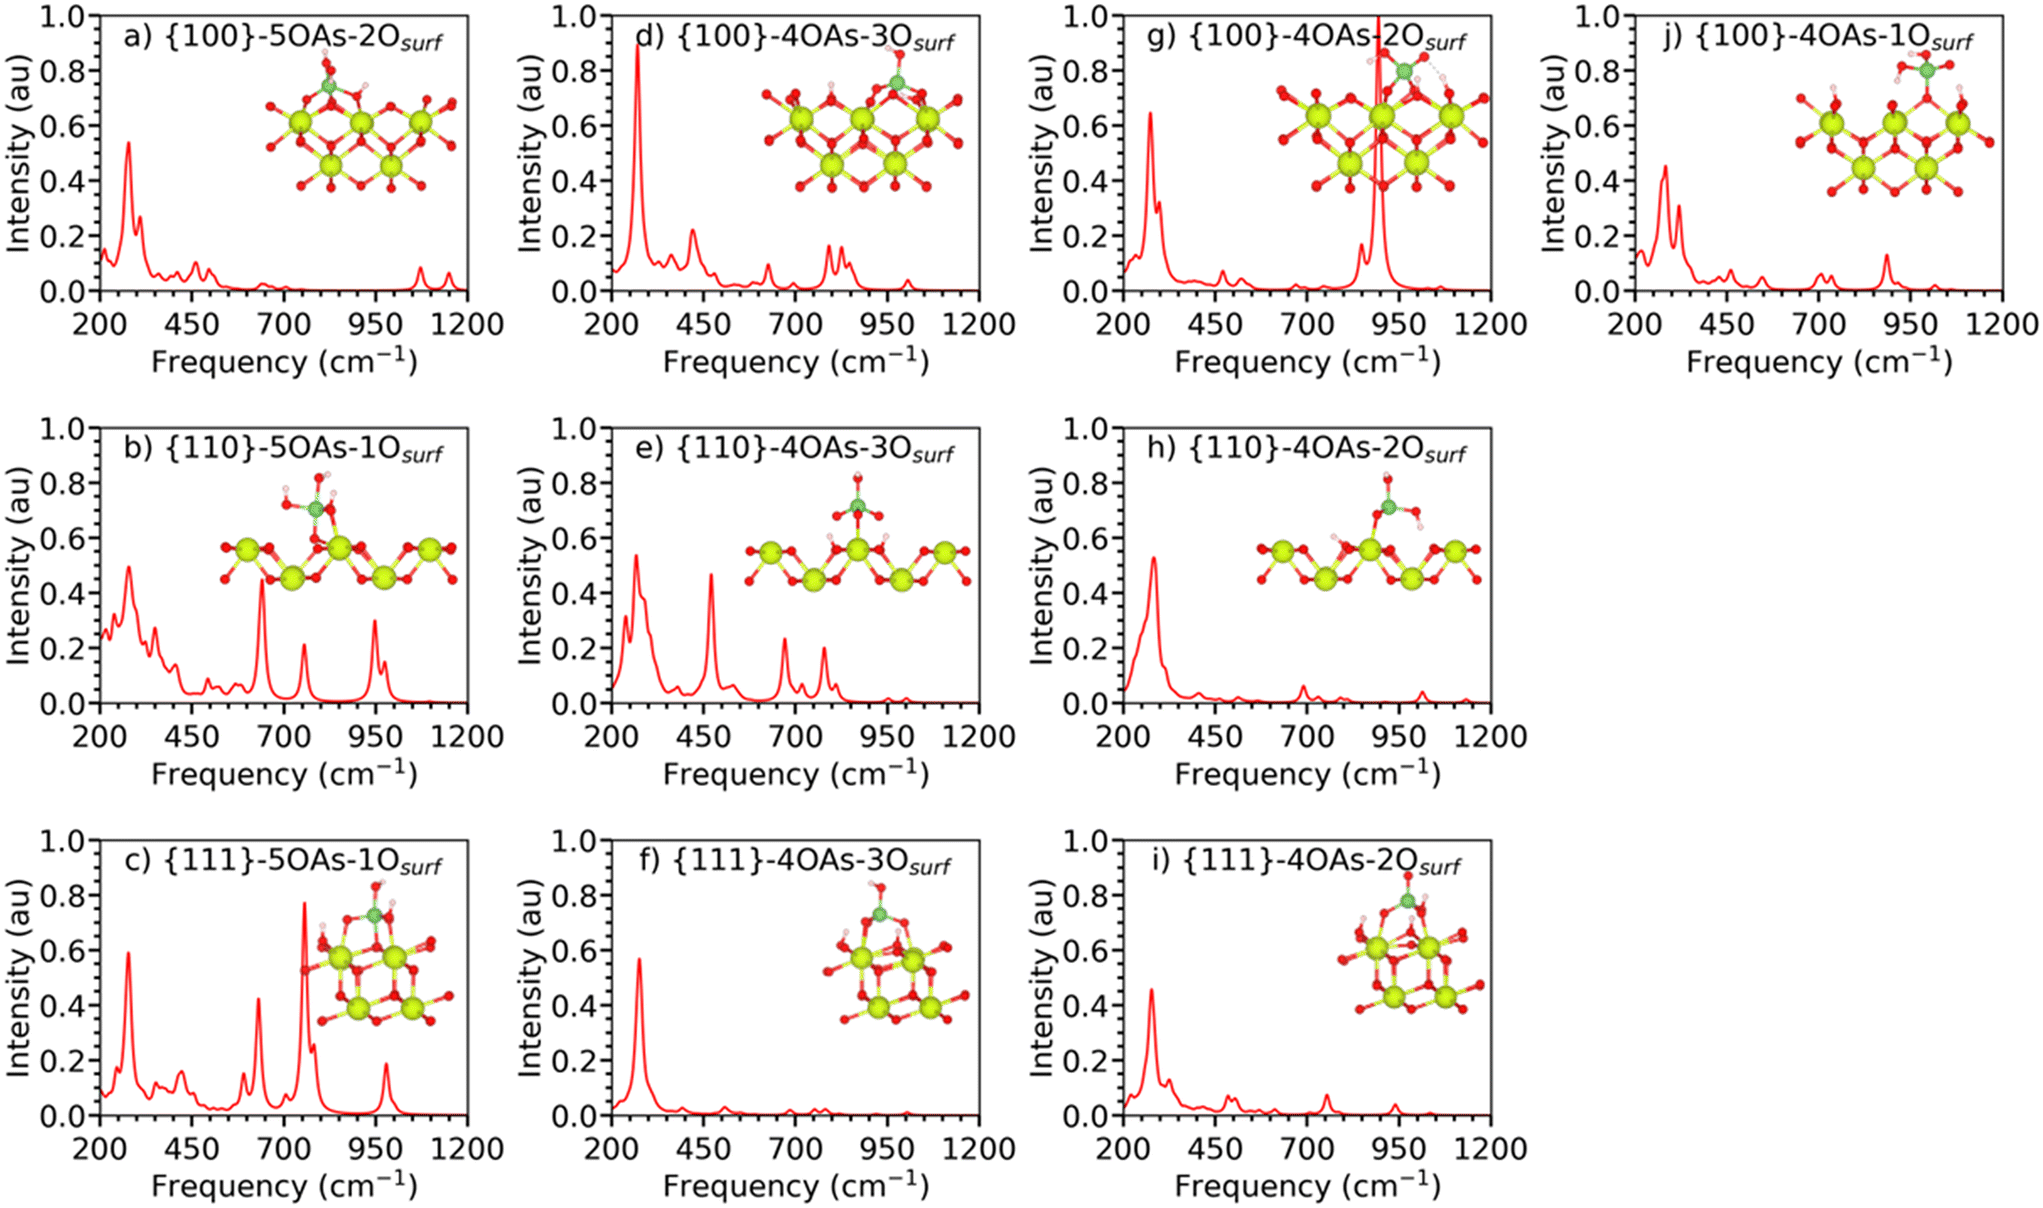 | ||
| Fig. 3 Simulated IR spectra of arsenate species adsorbed onto the {111}, {110}, and {100} stoichiometric surfaces of CeO2 with different binding modes as shown by the inset structures. The spectra are normalised relative to each other such that the highest absolute intensity across all the spectra is set to unity. | ||
Fig. 3(a–c) shows the IR spectra of the 5OAs binding configurations for the {100}, {110}, and {111} stoichiometric surfaces. The displacement of the surface oxygen seen for {110}-5OAs-1Osurf and {100}-5OAs-2Osurf is also observed in the IR active mode as the νAs–*Osurf, where *Osurf is the surface oxygen atom directly bonded to As. The νAs–*Osurf for the {110}-5OAs-1Osurf and {100}-5OAs-2Osurf are at 493–756 cm−1 and 496 cm−1, respectively. Such signals are in a similar region as the 5-fold coordinated phosphate species (680–695 cm−1).25 The absence of displaced Osurf for {111}-5OAs-1Osurf results in no IR active mode for νAs–*Osurf on the {111} surface.
All three 5OAs binding configurations show νAs–OAs. The νAs–OAs are at 757–783 cm−1, 635–756 cm−1 and 1150 cm−1 for the {111}-5OAs-1Osurf, {110}-5OAs-1Osurf and {100}-5OAs-1Osurf, respectively. The high frequency value of νAs–OAs on the {100}-5OAs-1Osurf is similar to the IR signal observed for 5-fold phosphate species adsorbed on the {100} surface (1197 cm−1).25
The bending modes δAs–OHAs are not observed on {111}-5OAs-1Osurf and {100}-5OAs-1Osurf, whereas they are a strong IR feature in the region of 324–350 cm−1 in {110}-5OAs-1Osurf, which is in the same region of the IR signal for δAs–OHAs in molecular arsenate (278–292 cm−1, 1032 cm−1). The δAs–OAs mode gives rise to IR active signals at 413 and 1072 cm−1 for {111}-5OAs-1Osurf, and {100}-5OAs-2Osurf. The much higher shift for the {100} surface may be due to the bidentate binding configuration of the {100}-5OAs-2Osurf compared to the monodentate binding configuration of the {111}-5OAs-1Osurf.
We predicted the IR stretching of the AsOAs bond (νAsOAs) at 952 cm−1 and at 1032 cm−1 for molecular arsenate, Table S4.† Similar to the phosphate adsorption on ceria, the IR signal of νAsOAs is not observed in any of our 5OAs binding configurations, which may arise from the elongation of the AsOAs bond from 1.64 Å (isolated molecule) to 1.71–1.89 Å when adsorbed on ceria, potentially resulting in the band suppression in the IR spectra.25,71
The IR spectra of the stable monodentate, bidentate and tridentate 4OAs adsorptions on the three surfaces of CeO2 are shown in Fig. 3(d–j). In the following, we discuss the spectra with respect to the denticity of the binding.
The {100}4OAs-1Osurf is the only monodentate configuration we could stabilize for the 4OAs adsorption (Fig. 3j). The νAs–OAs gives rise to a strong characteristic feature at 885 cm−1 in the IR spectrum. The IR bending mode (δAs–OAs) is at 320–321 cm−1, which is comparable to the δAs–OAs of molecular arsenate (280–292 cm−1).
The {111}-4OAs-2Osurf, and {100}-4OAs-2Osurf configurations have fingerprint characteristic signals for νsAs–OAs at 754 cm−1 and 848 cm−1, respectively. These signals are similar to those νsAs–OAs for molecular arsenate at 812–924 cm−1 (DFT literature68) and at 830–890 cm−1 (experimental study69,70). {110}-4OAs-2Osurf has νAs–OHAs at 690 cm−1, which is similar to the νsAs–OHAs for the isolated molecular arsenate at 656–695 cm−1 (this study), and is within the range of computational studies (493–924 cm−1).68 As the IR spectra of all the configurations were standardized with the highest IR signal across all the 5OAs and 4OAs binding configurations, the {100}-4OAs-2Osurf has the dominant IR frequency at 894 cm−1 with 1.0 a.u. intensity for νasAs–OAs.
The tridentate adsorption configurations of the 4OAs arsenate species for all three surfaces have dominant IR stretching for the As–OAs and the As–OHAs bonds. The νsAs–OAs and νasAs–OAs give rise to the signals at 626–1002 cm−1 and at 752–859 cm−1, respectively (Table S4,† most of these peaks are weak with intensities between 0.05 and 0.1 a.u.). The νsAs–OHAs and νasAs–OHAs signals are at 626–779 cm−1 and at 683–847 cm−1. This wide spread of IR signals for the νAs–OAs is in the range of νsAs–OAs (656–695 cm−1) and νAs–OHAs (677 cm−1) for the isolated molecular arsenate (Table 2).
| Raman mode arsenate | Adsorbed arsenate on CeO2 (PBE+U, this study) | Isolated arsenate (PBE+U, this study) | Arsenate (aq) (experiment)70,72 | Raman mode phosphate | Adsorbed phosphate (PBE+U)25 |
|---|---|---|---|---|---|
| ρOAs–HAs | 229–786, 916–1257 | 280–317, 952 | 250 (ref. 72) | ρOp–Hp | 916–1077 |
| ρOsurf–Hsurf | 360–786, 916–1065 | — | — | ρOsurf–Hsurf | 584–955 |
| νOAs–HAs | 2732–3701 | 3684–3699 | — | — | — |
| νOsurf–Hsurf | 2507–3722 | — | — | — | — |
| δAs–OAs; δAs–(OAs)2 | 229–435, 1016–1072 | 280 | 270–365,72 285–385 (ref. 70) | — | — |
| δAs-OHAs; δAs-(OHAs)2 | 428, 1065 | δP–OHp; δP–(OHp)2 | 1047–1236 | ||
| ρAs–OAs, ρAs–OHAs | 400–484 | — | — | — | — |
| t, ωO2As(OH)2 | 568–571 | — | 315–319 (ref. 70) | — | — |
| ν, ρ, δAs–*Osurf | 387–421 | — | — | νP–*Osurf | 680–701 |
| ν sAs–OHAs | — | 656 | 700–745 (ref. 70) | ν sP–OHp | 750–859 |
| ν asAs–OHAs | 1150 | — | 765 (ref. 70) | ν asP–OHp | 902–1079 |
| ν sAs–OAs | 561–798, 1002–1028 | — | 834–875 (ref. 70) | ν sP–Op | 1043–1077 |
| ν asAs–OAs | 505–954 | — | 866–915 (ref. 70) | ν asP–Op | 1142–1160 |
| scAs–OAs; scAs–OHAs | 340–551 | 317 | 270–450 (ref. 72) | — | — |
|
νAsOAs |
— | 952 | 923 (ref. 72) | — | — |
Our prediction for the IR characteristic features of the adsorbed arsenates is similar to the IR signals for adsorbed phosphates on nanoceria.25,71 The As–OHAs and As–OAs stretching modes are generally the most intense signals (as for adsorbed phosphates on ceria), with νAs–OHAs, νsAs–OAs, νasAs–OAs in the regions of 591–979 cm−1, 778–848 cm−1, 783–894 cm−1, respectively. Our predicted values are in a wider range of frequencies compared to the experimental νAs–OAs IR active stretching signals (828–839 cm−1) for adsorbed arsenates on ceria,20,29 and for the IR active stretching modes of isolated aqueous arsenate (830–908 cm−1),69,70 most likely due to the direct bonding to the surface of ceria.
Our spread of simulated δAs–OAs (at 273–320 cm−1) and δAs–OHAs (at 324–349 cm−1, and 975 cm−1) signals is consistent with the bending modes for aqueous arsenate found at 315–385 cm−1,70 and at 1170 cm−1.69 Although we report only a few peaks for the bending modes, there are many more associated with intensities lower than 0.1 a.u. (Table S4†). The complex interaction between arsenate and ceria surfaces causes such a spread, where visual inspection of the vibrational modes has shown complex motions, all related to bending modes of As–O. Such a spread is, however, not seen in the experimental reported value for δAs–OAs, which is observed at 470 cm−1 for adsorbed arsenate on ceria.29 This is most likely because our intensities for the bending modes are low.
 | ||
| Fig. 4 Simulated Raman spectra of arsenate species adsorbed onto the {111}, {110}, and {100} stoichiometric surfaces of CeO2 with different binding modes as shown by the inset structures. The spectra are normalised relative to each other such that the highest absolute intensity across all the spectra is set to unity. | ||
The unique νAs–*Osurf stretching of the 5-fold As configurations is suppressed for the {110}-5OAs-1Osurf and {111}-5OAs-1Osurf. The {100}-5OAs-2Osurf has the νAs–*Osurf Raman active mode at 516 cm−1 with a very low intensity of 0.06 a.u.
The adsorption of monodentate arsenate on the {100} surface shows a νasOAs–As–OHAs signal at 1016 cm−1 (Fig. 4j), which falls close to the νAsOAs signal of the isolated arsenate (952 cm−1). Across all surfaces, the stretching signals are in the ranges 668–1150 cm−1 for νAs–OHAs and 505–1028 cm−1 for νAs–OAs. These signals are also consistent with the Raman active modes for the computed isolated molecular arsenate (656 cm−1 for As–OH and 952 cm−1 for As–O), and in line with the reported experimental values (700–765 cm−1 for As–OH and 834–915 cm−1 for As–O) (Table 2).70,72
The scissoring modes (scAs–OAs, scAs–OHAs) are frequent active modes (with an intensity ≥0.1) in the Raman spectra in the region of 340–551 cm−1 (Table 2). These are in line with scAs–OAs and scAs–OHAs Raman active modes observed in the isolated molecular arsenate (317 cm−1 with 0.08 a.u.), and the experimental values (270–450 cm−1).69,72 Adsorbed arsenates on ceria surfaces display Raman active scissoring modes at higher frequency compared to the isolated arsenate, most likely due to the direct bonding between the arsenate and the surface.
The large range of Raman active rocking modes (ρOAs–HAs) are in the region 229–786 cm−1, and 916–1257 cm−1, which is comparable with the Raman signals for the isolated arsenate (280–317, and 952 cm−1) and the rocking mode of aqueous arsenate measured at 250 cm−1.72 The plethora of rocking modes arises from the interaction of the arsenate with the surface. However, the majority of the Raman active ρOAs–HAs signals are weak, but there are some exceptions with high intensity such as {111}-5OAs-1Osurf (at 1001 cm−1 with 0.37 a.u.), {100}-5OAs-2Osurf (at 1076 cm−1 with 0.17 a.u.), {100}-4OAs-1Osurf (at 916 cm−1, 937 cm−1 and 1257 cm−1 with 0.52 a.u., 0.67 a.u., and 0.45 a.u. respectively). The higher frequency shift for rocking modes in the case of adsorbed arsenate is similar to the shift observed for adsorbed phosphate (916–1077 cm−1 for adsorbed phosphate species vs. 144–322 cm−1 for molecular phosphate25), and this again confirms the significant constraints effect due to the adsorbed arsenate interacting with the ceria surfaces.
4. Conclusions
This study provides a prediction of IR and Raman signals for adsorbed arsenates onto the three most stable Miller index {100}, {110}, and {111} surfaces of CeO2 including different arsenate binding configurations. This study also shows the potential of IR and Raman spectroscopy to identify the binding configurations of adsorbed arsenates onto the surfaces of ceria.We found that arsenate can bind to the nanoceria surfaces in both trigonal bipyramidal (five-fold) and tetrahedral (four-fold) configurations. Whereas the tetrahedral binding is expected since it has been consistently identified as the main As structure bound to oxide surfaces,32 the five-fold binding is peculiar since it has never been described or suggested in experimental models, but found to be stable. The five-fold binding configurations exhibit some oxygen scavenging, pulling surface oxygen above the surface plane. Due to the nature of the binding, generally the four-fold adsorption maximised the interaction between the arsenate species with the three surfaces resulting in more thermodynamically favourable energetics, especially the tridentate adsorption which has generally the most negative binding energies.
The identification of 5-fold coordinated As has not been addressed in As adsorption experiments on oxides, using either EXAFS or DFT calculations, which in general support the formation of predominantly monodentate mononuclear and bidentate binuclear complexes.61,62 However, in As adsorbed onto Fe–Ce bimetal oxide, coordination numbers between 4.6 and 4.8 were used as models, meaning that our As complex structure deserves further investigation to clarify the As adsorption mechanisms.63 The incorporation of this data into SCM is recognized as fundamental and may provide clues for open issues, such as the enhanced adsorption behaviour of As into oxides with co-existing ions.73
The IR and Raman spectra of the adsorbed arsenate show a stretching characteristic fingerprint in the region above 700 cm−1 similar to experimental findings. However, we found a plethora of stretching and bending modes (many with low intensity) in the region between 200–1200 cm−1, which overlap between the IR and Raman active regions of arsenate adsorption on ceria but also with the region of IR and Raman characteristic signature of bare ceria surfaces. The five-fold arsenate configurations have unique IR fingerprint signals in the region of 635–756 cm−1, and Raman fingerprint signals between 387–421 cm−1 for νAs–*Osurf due to the direct interaction between As and a surface oxygen. These characteristic signals give an indication to identify these species experimentally. We also find that some of the binding configurations have suppressed Raman spectra altogether, which would make their identification more challenging using experimental Raman measurements.
Finally, future studies should focus on more complex models including arsenite, and the effect of coverage and solvent effects are considered.
Data availability
Raw data are available from https://doi.org/10.17632/rkbkbxcmj4.Author contributions
Conceptualization: LJG, DJC, RZ, MAG, SCP, MM; data curation: KMT, MM; formal analysis: KMT, DOW, MM; funding acquisition: LJG, DJC, MM; investigation: KMT, DOW, MAG, MM; methodology: KMT, DOW, MM; project administration: LJG, DJC, RZ, MAG, SCP, MM; software: KMT, MM; resources: LJG, DJC, MM; supervision: LJG, DJC, MM; validation: KMT, DOW, MM; visualization: KMT, DOW, LJG, DJC, RZ, MAG, SCP, MM; writing – original draft: KMT, DOW, LJG, DJC, RZ, MAG, SCP, MM; writing – review & editing: KMT, DOW, LJG, DJC, RZ, MAG, SCP, MM.Conflicts of interest
There are no conflicts to declare.Acknowledgements
KMT is funded via the Vice Chancellor's Scholarship Scheme at the University of Huddersfield. Analysis was performed on the Orion computing facility and the Violeta HPC at the University of Huddersfield. Calculations were run on the ARCHER2 UK National Supercomputing Services via our membership of the UK HEC Materials Chemistry Consortium (MCC; EPSRC EP/X035859/1). MAG acknowledges funding from the project UIDB/50019/2020 to IDL, by Fundação para a Ciência e a Tecnologia, I.P./MCTES through PIDDAC National funds.References
- J. Podgorski and M. Berg, Global threat of arsenic in groundwater, Science, 2020, 368, 845–850 CrossRef CAS.
- P. Ravenscroft, H. Brammer and K. Richards, Arsenic in Asia, in Arsenic Pollution: A Global Synthesis, Wiley-Blackwell, 2009, ch. 8, pp. 318–386 Search PubMed.
- P. Ravenscroft, H. Brammer and K. Richards, Arsenic in North America and Europe, in Arsenic Pollution: A Global Synthesis, Wiley-Blackwell, 2009, ch. 9, pp. 387–454 Search PubMed.
- P. Ravenscroft, H. Brammer and K. Richards, Arsenic in South and Central America, Africa, Australasia and Oceania, in Arsenic Pollution: A Global Synthesis, Wiley-Blackwell, 2009, ch. 10, pp. 455–491 Search PubMed.
- P. Sabbatini, F. Yrazu, F. Rossi, G. Thern, A. Marajofsky and M. M. Fidalgo de Cortalezzi, Fabrication and characterization of iron oxide ceramic membranes for arsenic removal, Water Res., 2010, 44, 5702–5712 CrossRef CAS.
- P. Ravenscroft, H. Brammer and K. Richards, Health Effects of Arsenic in Drinking Water and Food, in Arsenic Pollution: A Global Synthesis, Wiley-Blackwell, 2009, ch. 5, pp. 157–212 Search PubMed.
- R. Quansah, F. A. Armah, D. K. Essumang, I. Luginaah, E. Clarke, K. Marfoh, S. J. Cobbina, E. Nketiah-Amponsah, P. B. Namujju, S. Obiri and M. Dzodzomenyo, Association of arsenic with adverse pregnancy outcomes/infant mortality: a systematic review and meta-analysis, Environ. Health Perspect., 2015, 123, 412–421 CrossRef.
- S. F. Farzan, M. R. Karagas and Y. Chen, In utero and early life arsenic exposure in relation to long-term health and disease, Toxicol. Appl. Pharmacol., 2013, 272, 384–390 CrossRef CAS PubMed.
- M. Tolins, M. Ruchirawat and P. Landrigan, The developmental neurotoxicity of arsenic: cognitive and behavioral consequences of early life exposure, Ann. Glob. Health, 2014, 80, 303–314 CrossRef.
- K. Nagaraj, A. N. Shetty and D. R. Trivedi, Development of multi-analyte responsive sensors: optical discrimination of arsenite and arsenate ions, ratiometric detection of arsenite, and application in food and water samples, Sens. Diagn., 2024, 3, 64–78 RSC.
- P. Ravenscroft, H. Brammer and K. Richards, Removing Arsenic from Drinking Water, in Arsenic Pollution: A Global Synthesis, Wiley-Blackwell, 2009, ch. 7, pp. 261–317 Search PubMed.
- R. A. Root, S. Dixit, K. M. Campbell, A. D. Jew, J. G. Hering and P. A. O'Day, Arsenic sequestration by sorption processes in high-iron sediments, Geochim. Cosmochim. Acta, 2007, 71, 5782–5803 CrossRef CAS.
- K. M. Campbell and D. K. Nordstrom, Arsenic Speciation and Sorption in Natural Environments, Rev. Mineral. Geochem., 2014, 79, 185–216 CrossRef.
- F. Maia, C. Pinto, J. C. Waerenborgh, M. A. Gonçalves, C. Prazeres, O. Carreira and S. Sério, Metal partitioning in sediments and mineralogical controls on the acid mine drainage in Ribeira da Água Forte (Aljustrel, Iberian Pyrite Belt, Southern Portugal), Appl. Geochem., 2012, 27, 1063–1080 CrossRef CAS.
- Z. Li, S. Deng, G. Yu, J. Huang and V. C. Lim, As(V) and As(III) removal from water by a Ce-Ti oxide adsorbent: behavior and mechanism, Chem. Eng. J., 2010, 161, 106–113 CrossRef CAS.
- R. Li, Q. Li, S. Gao and J. K. Shang, Exceptional arsenic adsorption performance of hydrous cerium oxide nanoparticles: Part A. Adsorption capacity and mechanism, Chem. Eng. J., 2012, 185–186, 127–135 CrossRef CAS.
- P. P. Mon, P. P. Cho, D. Vidyasagar, P. Ghosal, G. Madras and S. Challapalli, Synergistic sorption: Enhancing arsenic (V) removal using biochar decorated with cerium oxide composite, Mater. Today Sustain., 2024, 25, 100675 Search PubMed.
- T. Basu, D. Nandi, P. Sen and U. C. Ghosh, Equilibrium modeling of As(III,V) sorption in the absence/presence of some groundwater occurring ions by iron(III)–cerium(IV) oxide nanoparticle agglomerates: A mechanistic approach of surface interaction, Chem. Eng. J., 2013, 228, 665–678 CrossRef CAS.
- F. Chai, R. Wang, L. Yan, G. Li, Y. Cai and C. Xi, Facile fabrication of pH-sensitive nanoparticles based on nanocellulose for fast and efficient As(V) removal, Carbohydr. Polym., 2020, 245, 116511 CrossRef CAS PubMed.
- R. Sawana, Y. Somasundar, V. S. Iyer and B. Baruwati, Ceria modified activated carbon: an efficient arsenic removal adsorbent for drinking water purification, Appl. Water Sci., 2017, 7, 1223–1230 CrossRef CAS.
- N. K. Devaraj, A. S. M. Mukter-Uz-Zaman and H. Y. Wong, Ceria-Coated Magnetite Nanoparticles for As(V) Removal from Water, presented in part at the Recent Advances in Environmental Science from the Euro-Mediterranean and Surrounding Regions, Cham, 4th dn, 2024 Search PubMed.
- Q. Feng, Z. Zhang, Y. Ma, X. He, Y. Zhao and Z. Chai, Adsorption and desorption characteristics of arsenic onto ceria nanoparticles, Nanoscale Res. Lett., 2012, 7, 84 CrossRef.
- X. Bi, C. Zeng and P. Westerhoff, Adsorption of Arsenic Ions Transforms Surface Reactivity of Engineered Cerium Oxide Nanoparticles, Environ. Sci. Technol., 2020, 54, 9437–9444 CrossRef CAS PubMed.
- D. C. Sayle, F. Caddeo, L. M. Morgan, R. L. Neale, T. X. T. Sayle, C. Brambila, J. Nutter, U. Bhatta, K. M. Ta, J. M. Flitcroft, T. S. Sakthivel, S. Seal, G. Möbus and M. Molinari, Aging mechanisms of nanoceria and pathways for preserving optimum morphology, Nano Today, 2023, 51, 101916 CrossRef CAS.
- K. M. Ta, D. J. Cooke, L. J. Gillie, S. C. Parker, S. Seal, P. B. Wilson, R. M. Phillips, J. M. Skelton and M. Molinari, Infrared and Raman Diagnostic Modeling of Phosphate Adsorption on Ceria Nanoparticles, J. Phys. Chem. C, 2023, 127, 20183–20193 CrossRef CAS.
- F. Wei, C. J. Neal, T. S. Sakthivel, Y. Fu, M. Omer, A. Adhikary, S. Ward, K. M. Ta, S. Moxon, M. Molinari, J. Asiatico, M. Kinzel, S. N. Yarmolenko, V. San Cheong, N. Orlovskaya, R. Ghosh, S. Seal and M. Coathup, A novel approach for the prevention of ionizing radiation-induced bone loss using a designer multifunctional cerium oxide nanozyme, Bioact. Mater., 2023, 21, 547–565 CAS.
- M. Molinari, A. R. Symington, D. C. Sayle, T. S. Sakthivel, S. Seal and S. C. Parker, Computer-Aided Design of Nanoceria Structures as Enzyme Mimetic Agents: The Role of Bodily Electrolytes on Maximizing Their Activity, ACS Appl. Bio Mater., 2019, 2, 1098–1106 CrossRef CAS PubMed.
- Y. Fu, C. J. Neal, E. Kolanthai, S. Munir, K. M. Ta, M. Molinari and S. Seal, Effect of acetate ions and pH on the morphology of cerium oxide nanoparticles, Colloids Surf., A, 2023, 679, 132616 CrossRef CAS.
- Y. Zhang, M. Yang and X. Huang, Arsenic(V) removal with a Ce(IV)-doped iron oxide adsorbent, Chemosphere, 2003, 51, 945–952 CrossRef CAS.
- S. Dudek and D. Kołodyńska, Arsenic(V) removal on the lanthanum-modified ion exchanger with quaternary ammonium groups based on iron oxide, J. Mol. Liq., 2022, 347, 117985 CrossRef CAS.
- Y. Wang, G. Morin, G. Ona-Nguema, F. Juillot, F. Guyot, G. Calas and G. E. Brown, Jr., Evidence for Different Surface Speciation of Arsenite and Arsenate on Green Rust: An EXAFS and XANES Study, Environ. Sci. Technol., 2010, 44, 109–115 CrossRef CAS PubMed.
- A. L. Foster and C. S. Kim, Arsenic Speciation in Solids Using X-ray Absorption Spectroscopy, Rev. Mineral. Geochem., 2014, 79, 257–369 CrossRef.
- D. M. Sherman and S. R. Randall, Surface complexation of arsenic(V) to iron(III) (hydr)oxides: structural mechanism from ab initio molecular geometries and EXAFS spectroscopy, Geochim. Cosmochim. Acta, 2003, 67, 4223–4230 CrossRef CAS.
- K. Fukushi and D. A. Sverjensky, A predictive model (ETLM) for arsenate adsorption and surface speciation on oxides consistent with spectroscopic and theoretical molecular evidence, Geochim. Cosmochim. Acta, 2007, 71, 3717–3745 CrossRef CAS.
- R. J. Martínez, M. Villalobos, A. U. Loredo-Jasso, A. X. Cruz-Valladares, A. Mendoza-Flores, H. Salazar-Rivera and D. Cruz-Romero, Towards building a unified adsorption model for goethite based on direct measurements of crystal face compositions: I. Acidity behavior and As(V) adsorption, Geochim. Cosmochim. Acta, 2023, 354, 252–262 CrossRef.
- I. Römer, S. M. Briffa, Y. Arroyo Rojas Dasilva, D. Hapiuk, V. Trouillet, R. E. Palmer and E. Valsami-Jones, Impact of particle size, oxidation state and capping agent of different cerium dioxide nanoparticles on the phosphate-induced transformations at different pH and concentration, PLoS One, 2019, 14, e0217483 CrossRef PubMed.
- H. Liu and J. Liu, Self-limited Phosphatase-mimicking CeO2 Nanozymes, ChemNanoMat, 2020, 6, 947–952 CrossRef CAS.
- G. Kresse and J. Furthmüller, Efficient iterative schemes for ab initio total-energy calculations using a plane-wave basis set, Phys. Rev. B: Condens. Matter Mater. Phys., 1996, 54, 11169–11186 CrossRef CAS PubMed.
- G. Kresse and J. Hafner, Ab initio molecular dynamics for liquid metals, Phys. Rev. B: Condens. Matter Mater. Phys., 1993, 47, 558–561 CrossRef CAS PubMed.
- G. Kresse and J. Furthmüller, Efficiency of ab-initio total energy calculations for metals and semiconductors using a plane-wave basis set, Comput. Mater. Sci., 1996, 6, 15–50 CrossRef CAS.
- J. P. Perdew, J. A. Chevary, S. H. Vosko, K. A. Jackson, M. R. Pederson, D. J. Singh and C. Fiolhais, Erratum: Atoms, molecules, solids, and surfaces: Applications of the generalized gradient approximation for exchange and correlation, Phys. Rev. B: Condens. Matter Mater. Phys., 1993, 48, 4978–4978 CrossRef CAS PubMed.
- J. P. Perdew, K. Burke and M. Ernzerhof, Generalized Gradient Approximation Made Simple, Phys. Rev. Lett., 1996, 77, 3865–3868 CrossRef CAS.
- J. Heyd, G. E. Scuseria and M. Ernzerhof, Hybrid functionals based on a screened Coulomb potential, J. Chem. Phys., 2003, 118, 8207–8215 CrossRef CAS.
- J. Heyd, G. Scuseria and M. Ernzerhof, Erratum: “Hybrid Functionals Based on a Screened Coulomb Potential” [J. Chem. Phys.118, 8207 (2003)], J. Chem. Phys., 2006, 124, 9906 CrossRef.
- S. L. Dudarev, G. A. Botton, S. Y. Savrasov, C. J. Humphreys and A. P. Sutton, Electron-energy-loss spectra and the structural stability of nickel oxide: An LSDA+U study, Phys. Rev. B: Condens. Matter Mater. Phys., 1998, 57, 1505–1509 CrossRef CAS.
- U. Castanet, C. Feral-Martin, A. Demourgues, R. L. Neale, D. C. Sayle, F. Caddeo, J. M. Flitcroft, R. Caygill, B. J. Pointon, M. Molinari and J. Majimel, Controlling the {111}/{110} Surface Ratio of Cuboidal Ceria Nanoparticles, ACS Appl. Mater. Interfaces, 2019, 11, 11384–11390 CrossRef CAS PubMed.
- A. S. Pugazhendhi, C. J. Neal, K. M. Ta, M. Molinari, U. Kumar, F. Wei, E. Kolanthai, A. Ady, C. Drake, M. Hughes, S. Yooseph, S. Seal and M. J. Coathup, A neoteric antibacterial ceria-silver nanozyme for abiotic surfaces, Biomaterials, 2024, 307, 122527 CrossRef CAS PubMed.
- M. Molinari, S. C. Parker, D. C. Sayle and M. S. Islam, Water Adsorption and Its Effect on the Stability of Low Index Stoichiometric and Reduced Surfaces of Ceria, J. Phys. Chem. C, 2012, 116, 7073–7082 CrossRef CAS.
- S. Moxon, A. R. Symington, J. S. Tse, J. M. Flitcroft, J. M. Skelton, L. J. Gillie, D. J. Cooke, S. C. Parker and M. Molinari, Composition-dependent morphologies of CeO2 nanoparticles in the presence of Co-adsorbed H2O and CO2: a density functional theory study, Nanoscale, 2024, 16, 11232–11249 RSC.
- T. Smith, S. Moxon, J. S. Tse, J. M. Skelton, D. J. Cooke, L. J. Gillie, E. L. da Silva, R. M. Harker, M. T. Storr, S. C. Parker and M. Molinari, Structural dynamics of Schottky and Frenkel defects in CeO2: a density-functional theory study, JPhys Energy, 2023, 5, 025004 CrossRef.
- A. R. Symington, R. M. Harker, M. T. Storr, M. Molinari and S. C. Parker, Thermodynamic Evolution of Cerium Oxide Nanoparticle Morphology Using Carbon Dioxide, J. Phys. Chem. C, 2020, 124, 23210–23220 CrossRef CAS.
- A. R. Symington, M. Molinari, S. Moxon, J. M. Flitcroft, D. C. Sayle and S. C. Parker, Strongly Bound Surface Water Affects the Shape Evolution of Cerium Oxide Nanoparticles, J. Phys. Chem. C, 2020, 124, 3577–3588 Search PubMed.
- D. Prieur, W. Bonani, K. Popa, O. Walter, K. W. Kriegsman, M. H. Engelhard, X. Guo, R. Eloirdi, T. Gouder, A. Beck, T. Vitova, A. C. Scheinost, K. Kvashnina and P. Martin, Size Dependence of Lattice Parameter and Electronic Structure in CeO2 Nanoparticles, Inorg. Chem., 2020, 59, 5760–5767 CrossRef CAS.
- G. W. Watson, E. T. Kelsey, N. H. de Leeuw, D. J. Harris and S. C. Parker, Atomistic simulation of dislocations, surfaces and interfaces in MgO, J. Chem. Soc., Faraday Trans., 1996, 92, 433–438 RSC.
- K. Momma and F. Izumi, VESTA 3 for three-dimensional visualization of crystal, volumetric and morphology data, J. Appl. Crystallogr., 2011, 44, 1272–1276 CrossRef CAS.
- J. M. Skelton, L. A. Burton, A. J. Jackson, F. Oba, S. C. Parker and A. Walsh, Lattice dynamics of the tin sulphides SnS2, SnS and Sn2S3: vibrational spectra and thermal transport, Phys. Chem. Chem. Phys., 2017, 19, 12452–12465 RSC.
- A. Togo and I. Tanaka, First principles phonon calculations in materials science, Scr. Mater., 2015, 108, 1–5 CrossRef CAS.
- M. Gajdoš, K. Hummer, G. Kresse, J. Furthmüller and F. Bechstedt, Linear optical properties in the projector-augmented wave methodology, Phys. Rev. B: Condens. Matter Mater. Phys., 2006, 73, 045112 CrossRef.
- C. Schilling, A. Hofmann, C. Hess and M. V. Ganduglia-Pirovano, Raman Spectra of Polycrystalline CeO2: A Density Functional Theory Study, J. Phys. Chem. C, 2017, 121, 20834–20849 CrossRef CAS.
- W. Humphrey, A. Dalke and K. Schulten, VMD: visual molecular dynamics, J. Mol. Graphics, 1996, 14(33–38), 27–38 Search PubMed.
- A. C. Q. Ladeira, V. S. T. Ciminelli, H. A. Duarte, M. C. M. Alves and A. Y. Ramos, Mechanism of anion retention from EXAFS and density functional calculations: arsenic (V) adsorbed on gibbsite, Geochim. Cosmochim. Acta, 2001, 65, 1211–1217 CrossRef CAS.
- A. Pranudta, S. Patra, W. Klysubun, P. Amonpattaratkit, T. Thanh Nguyen, V. Hong Nguyen, M. Mohamed El-Moselhy and S. Padungthon, Insight into the molecular interaction of trace As (III) and As(V) onto the hybrid anion exchanger impregnated with Fe/Mn nanoparticles (HA502P-Fe/Mn), Chem. Eng. J., 2023, 454, 139991 CrossRef CAS.
- X. Dou, Y. Zhang, B. Zhao, X. Wu, Z. Wu and M. Yang, Arsenate adsorption on an Fe–Ce bimetal oxide adsorbent: EXAFS study and surface complexation modeling, Colloids Surf., A, 2011, 379, 109–115 CrossRef CAS.
- D. R. Mullins, The surface chemistry of cerium oxide, Surf. Sci. Rep., 2015, 70, 42–85 CrossRef CAS.
- T. X. Sayle, M. Molinari, S. Das, U. M. Bhatta, G. Möbus, S. C. Parker, S. Seal and D. C. Sayle, Environment-mediated Structure, Surface Redox Activity and Reactivity of Ceria Nanoparticles, Nanoscale, 2013, 5, 6063–6073 RSC.
- S. Mochizuki, Infrared optical properties of cerium dioxide, Phys. Status Solidi B, 1982, 114, 189–199 CrossRef CAS.
- A. Filtschew, K. Hofmann and C. Hess, Ceria and Its Defect Structure: New Insights from a Combined Spectroscopic Approach, J. Phys. Chem. C, 2016, 120, 6694–6703 CrossRef CAS.
- C. C. Pye, T. Chiome and B. L. Goodall, An ab initio study of the effect of hydration on the vibrational spectrum of hydrogen arsenate ion, Comput. Theor. Chem., 2022, 1215, 113838 CrossRef CAS.
- L. A. Sheludyakova, V. Afanasieva, N. V. Podberezskaya and Y. I. Mironov, Spectral and structural analysis of sodium hydrophosphates and hydroarsenates, J. Struct. Chem., 1999, 40, 869–872 CrossRef CAS.
- S. Goldberg and C. T. Johnston, Mechanisms of Arsenic Adsorption on Amorphous Oxides Evaluated Using Macroscopic Measurements, Vibrational Spectroscopy, and Surface Complexation Modeling, J. Colloid Interface Sci., 2001, 234, 204–216 CrossRef CAS.
- S. Bhasker-Ranganath, C. Zhao and Y. Xu, Theoretical analysis of the adsorption of phosphoric acid and model phosphate monoesters on CeO2(111), Surf. Sci., 2021, 705, 121776 CrossRef CAS.
- F. K. Vansant, B. J. Van Der Veken and H. O. Desseyn, Vibrational analysis of arsenic acid and its anions: I. Description of the Raman spectra, J. Mol. Struct., 1973, 15, 425–437 CrossRef CAS.
- M. Kanematsu, T. M. Young, K. Fukushi, P. G. Green and J. L. Darby, Arsenic(III, V) adsorption on a goethite-based adsorbent in the presence of major co-existing ions: Modeling competitive adsorption consistent with spectroscopic and molecular evidence, Geochim. Cosmochim. Acta, 2013, 106, 404–428 CrossRef CAS.
Footnote |
| † Electronic supplementary information (ESI) available: Adsorption energies in numerical form, raw data for the IR and Raman spectra, and full details of the IR and Raman signals. See DOI: https://doi.org/10.1039/d4en00894d |
| This journal is © The Royal Society of Chemistry 2025 |