
Nano-structural stiffness measure for soft biomaterials of heterogeneous elasticity†
Shu-wen W.
Chen
 *ab,
Jean-Marie
Teulon
a,
Harinderbir
Kaur
a,
Christian
Godon
c and
Jean-Luc
Pellequer
*a
*ab,
Jean-Marie
Teulon
a,
Harinderbir
Kaur
a,
Christian
Godon
c and
Jean-Luc
Pellequer
*a
aUniversité Grenoble Alpes, CEA, CNRS, IBS, F-38000 Grenoble, France. E-mail: cmft551@yahoo.com; jean-luc.pellequer@ibs.fr
bRue Cyprien Jullin, Vinay, 38470, France
cAix Marseille University, CEA, CNRS, BIAM, 13108 Saint Paul-Lez-Durance, Cadarache, France
First published on 24th October 2022
Abstract
Measuring the structural stiffness aims to reveal the impact of nanostructured components or various physiological circumstances on the elastic response of material to an external indentation. With a pyramidal tip at a nano-scale, we employed the atomic force microscopy (AFM) to indent the surfaces of two compositions of polyacrylamide gels with different softness and seedling roots of Arabidopsis thaliana. We found that the stiffness–depth curve derived from the measured force exhibits a heterogeneous character in elasticity. According to the tendency of stiffness–depth curve, we decomposed the responding force into depth-impact (FC), Hookean (FH) and tip-shape (FS) components, called trimechanic, where FS and its gradient should be offset at the surface or subsurfaces of the indented material. Thereby, trimechnic theory allows us to observe how the three restoring nanomechanics change with varied depth. Their strengths are represented by the respective spring constants (kC, kH, kS) of three parallel-connected spring (3PCS) analogs to differentiate restoring nanomechansims of indented materials. The effective Young's modulus Ê and the total stiffness kT (= kH + kS) globally unambiguously distinguish the softness between the two gel categories. Data fluctuations were observed in the elasticity parameters of individual samples, reflecting nanostructural variations in the gel matrix. Similar tendencies were found in the results from growing plant roots, though the data fluctuations are expectedly much more dramatic. The zone-wise representation of stiffness by the trimechanic-3PCS framework demonstrates a stiffness measure that reflects beneath nanostructures encountered by deepened depth. The trimechanic-3PCS framework can apply any mechanical model of power-law based force–depth relationship and is compatible with thin layer corrections. It provides a new paradigm for analyzing restoring nanomechanics of soft biomaterials in response to indenting forces.
New concepts“New concept brought by this research is the trimechanic theory, the very concept of composite nanomechanics underlying the restoring mechanism of material under an external compression. It provides a disentanglement of the linear and tip-shape related mechanical responses at various indentation depth. The novel aspects of this research are (1) define the never explored application criteria for the Sneddon's model to the study of depth-heterogeneous elasticity. (2) Design a three parallel-connected spring (3PCS) analogy for quantifying the strengths of responding nanomechanics, allowing us to differentiate circumstances exhibiting the same stiffness yet with different restoring nano-mechanisms. (3) Calculate the force–derived stiffness curve as the key element for analysis instead of the force values themselves, thereby the slope of stiffness curve essentially represents the intrinsic elasticity of the material. The trimechanic theory applies to all contact-based mechanical models with a power law force–depth relationship. The prospect of this research includes a standardization of the application of stiffness measure beyond model systems toward live or clinical tissues. Particularly, stiffness measure will not stay on a stage of global assessment but goes further to link elastic behaviors with substructure of the nanomaterial.” |
Introduction
Recently, mechanobiology has attracted a great deal of attention on how external forces can regulate the function of proteins, cells, and tissues.1,2 In particular, it remains elusive on how cells transduce mechanical stresses, ranging from Pascals to mega Pascals, into physiological processes and end up with serious physiopathological consequences.3 Many attempts have been made to accurately characterize elastic properties of these soft biomaterials, including micropipette aspiration,4 optical tweezers,5 deformability cytometry,6 Brillouin microscopy,7 and the most adopted strategy, atomic force microscopy (AFM).8 AFM indentation results have brought to evidence that certain diseases are subject to abnormal cellular mechanics, for example, a lowered stiffness measured for cancer cells compared to normal ones.9 Similar results were found in extracellular matrix10,11 and tissues during cancer progression.12,13In the instrumental setup of AFM for indentation, the tip attached beneath the micro-sized cantilever plays as an indenter to compress the surface of cells or tissues. In this process, cantilever deflections are recorded as the so-called force–displacement data,14,15 from which the Young's modulus is deduced.16 In assessment of the Young's modulus, Hertzian17 and Sneddon's models18 are widely used to analyze the force–depth data acquired by AFM. The latter delineates the relation between the responding force of material and the indented depth, which depends on the shape of AFM tip. Hence, various shapes of tip have been exploited to study the tip-shape effect on the magnitude of Young's modulus.19,20 Both Hertz and Sneddon models are restricted to sample systems of linear (homogeneous) elasticity with an infinite thickness (occupying the whole half space), and the employment of an axisymmetric punch to indent the material surface normally.21,22 The Hertz model, used for spherical probes, has some other constrains such as the indented depth must be within 10% of the sample thickness,23 relatively small compared to the spherical radius, and without adhesive interactions and frictions between the sample and the indenter upon contacting.22 These limitations have been attenuated by the so-called bottom-effect correction for spherical tips24 and conical tips;25 or using a thin layer correction26 that has been applied to two lipid layers.21 The case of adhesion has been tackled by JKR27 and DMT28 models using spherical tips.
The architecture of cells and tissues is by essence complex and non-homogeneous.29,30 The deformation of nano-structured component caused by external stresses depends on the bonding network and strengths of its chemical groups. Such a complication in stiffness measure brought by structural complexity makes conventional models difficult in interpretation of measured stiffness, especially in the study of soft biomaterials.31 Moreover, the substratum may impact the stiffening behaviors.21,32 It has been reported that stiffness difference can be detected from layered samples (separate elastic bodies) with different elasticity.33–35 Therefore, a full analysis over the entire indentation trajectory is needed for our understanding on the above-mentioned issues.
Here, we propose a robust strategy, coined trimechanic theory, to encompass elastic behaviors of soft- and bio-materials in various circumstances. The change in elastic behaviors implicates the change in the context of the material. Trimechanic theory allows us to quantify the difference of elastic responses through different combinations of three nanomechanical actions governed, respectively, by a constant, a linear and a non-linear forces.
In this article, we illustrate the concept and application of the trimechanic theory to the force–depth measurements from AFM indentation. Besides the pyramidal tip used in this work, trimechanic theory will be shown to accommodate Hertz and other Sneddon's force–depth relations for spherical tips as well.
Methodology
A. Theory and model
 | (1) |
 is explicitly a linear function of penetrated depth Z with a proportional constant RS, thus
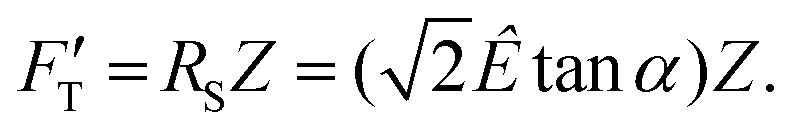 | (2) |
For a material of homogeneous elasticity, the stiffness curve derived from FT should be one single linear segment with one RS or Ê based on the force–depth relationship. Thereby, we exploited this property to explore elastic heterogeneity of material by examining the slope of stiffness–depth curve during an indenting process. The change in RS reflects a change in Ê as well as the restoring nanomechanics of material. From eqn (1) and (2), FT and  are both zero at Z = 0—initial boundary conditions for applying the Sneddon's model.
 | (3) |
 | (4) |
 . Removing FC and FH from the total force FT, the remaining force satisfies the initial boundary conditions for applying the Sneddon's model. We denote this force as FS to attribute it to the tip shape, from which the magnitude of Ê is deduced. The three force components govern three nanomechanics modes—this is trimechanic theory. Trimechanic theory is the very concept of composite nanomechanics underlying the restoring mechanism of material in the indentation trajectory. Various elastic responses are expressed as a linear combination of the three basis nanomechanics, whose strengths quantify the difference in the elastic behaviors.
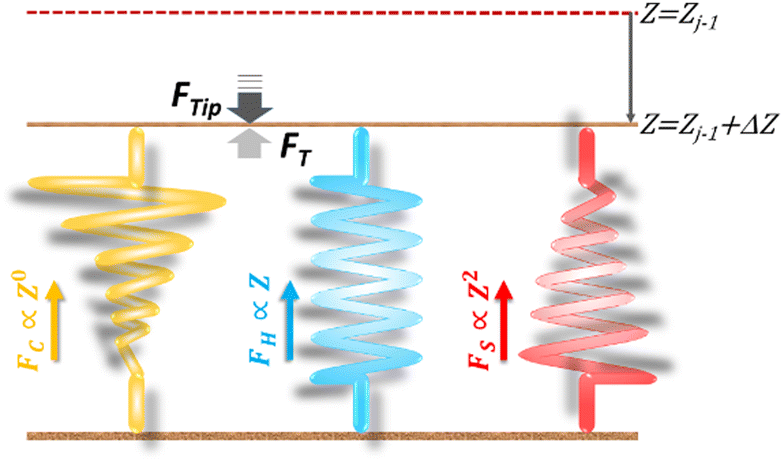 | ||
| Fig. 1 Analogy of three parallel-connected springs: the elastic response (FT) of a material to an applied force (FTip) is a composite action of three nanomechanics, respectively governed by FC, FH and FS, which compose FT. In the schematic diagram, the tip has arrived at the sub-surface of Zone j in the indentation trajectory, Zj−1, and continues to indent the material with an additional compression, ΔZ. During the indentation from Zj−1 to Zj−1 + ΔZ, the material exerts a restoring force FT against the applied force FTip to form, microscopically, a quasi-equilibrium. Except the FH-spring obeying the Hooke's law, the FC-curve is a zero-power function of Z, while the nonlinear FS function, in the diagram, has an exponent of 2 to exemplify the use of a pyramidal tip. The pseudo-stiffness function for the FC-spring is inversely proportional to the indented depth, picturized by a spring with non-linearly shrinking width. The stiffness function of FS-spring is proportional to Z, symbolized by a spring with linearly increasing width, and that of FH-spring is a constant, thus represented by a spring of constant width. According to this spring analogy, FT = k3PCS·ΔZ, where k3PCS = kC + kH + kS, the sum of the spring constants of the three spring devices. | ||
Among the 3PCS analogs, the FH-spring is the only one having a typical spring constant, 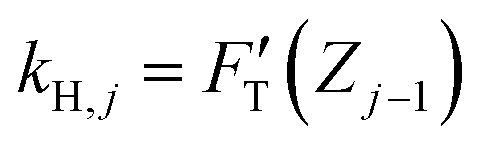 for zone j; it is essentially the total stiffness measured at the subsurface of the visited zone. Two other spring analogs for FC and FS do not have the standard spring constant, which will be represented by the average of their stiffness functions. As a constant, FC contributes none to stiffness measure. Were there a stiffness function corresponding to FC, it would be inversely proportional to the amount of compression to make up the force constant. Accordingly, FC would act like a force thresholder, forbidding the tip without sufficient applied force continuing to indent the material. However, averaging such a pseudo-stiffness function cannot yield a finite number, thus we took FT(Zj−1)/ΔZj as the spring constant of the FC-spring, kC,j, with ΔZj = Zj − Zj−1.
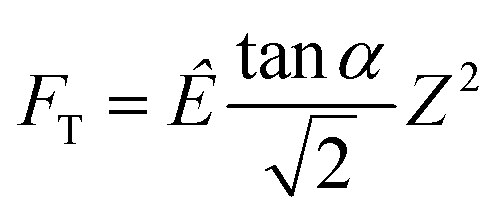
For the FS-spring, we averaged the corresponding stiffness function (eqn (2)) over the indented zone and obtained the spring constant:
kS,j = RS,j·ΔZj/2 or Êj·tan![[thin space (1/6-em)]](https://www.rsc.org/images/entities/char_2009.gif) α·ΔZj/√2. α·ΔZj/√2. | (5) |
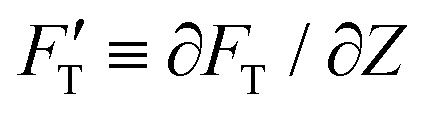
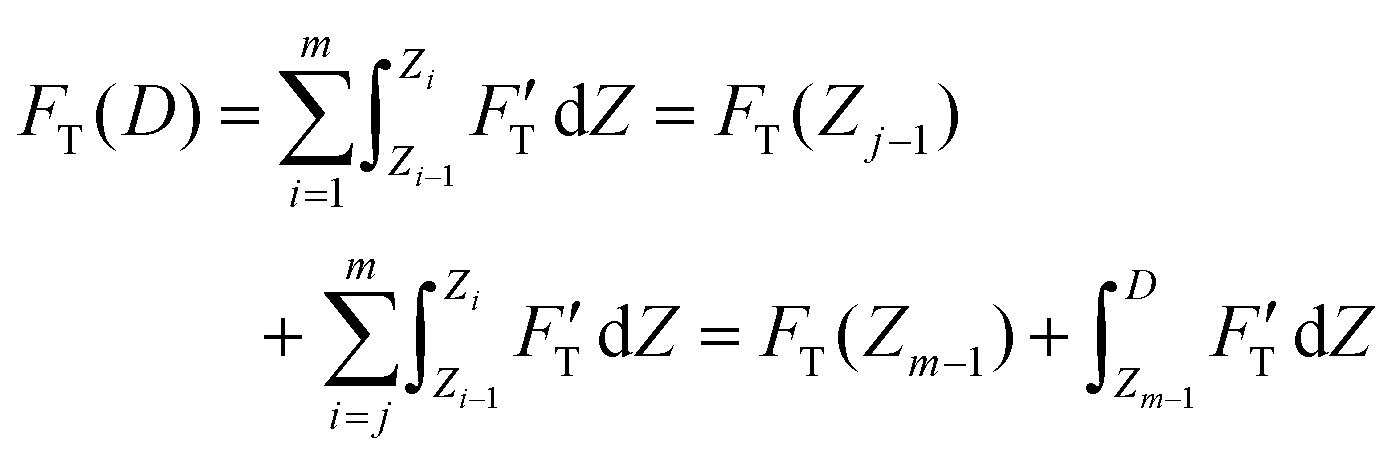
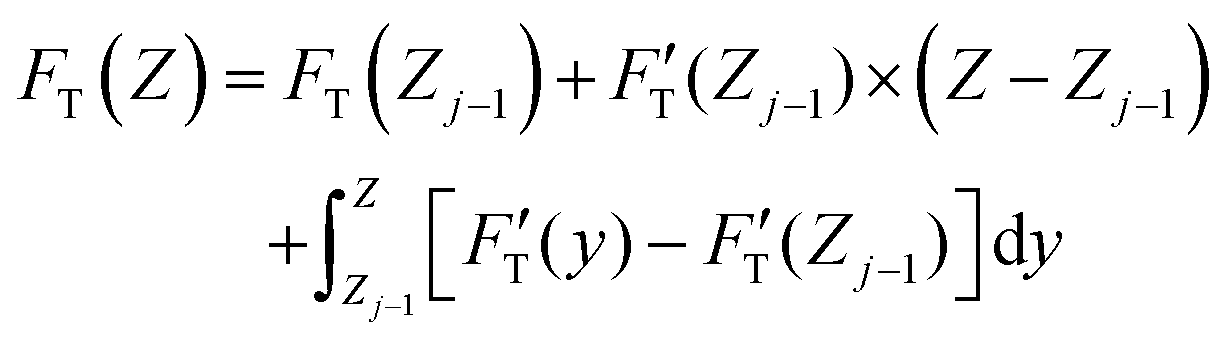
 curve, to the contrary of stiffness tomography that slices the FT–Z curve into segments (or layers for indentation depth) without care for the initial boundary conditions imposed on the nonlinear force and the contribution of Hookean nanomechanincs.37–39 As shown, the relative strengths of Hookean and tip-shape nanomechanics, rH,j and rS,j, are complementary to each other for rH,j = kH,j/kT,j and rS,j = 1 − rH,j. Taken together, an elastic response can be fully described by the trimechanic-3PCS framework in a quadruplet format: [ΔZj, kC,j, kT,j, rS,j], the necessary and sufficient parameters to rebuild the fitting curves for FT and three decomposed force components. Detailed calculations can be found in ESI.†
B. Material preparation and AFM instrumentation
System 2: the specimen is a 7.4% polyacrylamide gel of about 1.0 mm thickness. The same AFM instrumentation was used as for System 1. The 7.4% polyacrylamide gel was prepared by mixing with 176 μL of acrylamide solution, 210 μL of Bis-acrylamide, 1.5 μL of TEMED, and 10 μL of APS in 602 μL of ultrapure water. The two gel materials were made on the same day. A preparation protocol of polyacrylamide gels with tunable elastic properties can be found elsewhere.41
Experimental setups of AFM for System 1 and 2: we employed an AFM multimode 8 (Bruker, Santa Barbara, CA, USA) equipped with a J-scanner and nanoscope-V controller to perform indentations on gel specimen. The force–displacement measurements were acquired using the force volume mode of the Nanoscope 9.2 software, and the data were collected in a matrix fashion with 8 × 8 or 16 × 16 spots distributed over the material surface in a size of 2 × 2 μm2, and each data curve consists of 512 data points with a ramp size smaller than 2 μm.
Experimental setups of AFM for Systems 3 and 4: the data values were acquired with a Dimension 3100 AFM (Bruker, Santa Barbara, CA, USA) equipped with a hybrid scanner and a nanoscope V controller. We recorded the data in a standard approach of force–distance measurements with the picoforce mode of the Nanoscope 7.3 software. Each data curve composed of 4096 points with a ramp size of 3 μm. All the indentation experiments on plants were performed in a single day.
Results and discussion
A. Elastic behaviors of soft materials
We present the results of AFM indentation for two gel composites with different concentrations of acrylamide and bis-acrylamide cross-linker, yet with the same molar ratio of acrylamide to bis-acrylamide, 16:1 (see Methodology). The gel system of higher (10.4%) concentration is presumably stiffer than that of the lower (7.4%) one. The former is thus called hard gel while the latter soft. The indentation (FT–Z) and FT-derived stiffness–depth  curves for the two gel systems are presented in Fig. 2. The computational tasks of generating FT–Z and
  curves from force–distance (Fd–z) data as well as the FT decomposition into three components are described in the ESI.† In Fig. 2a, the
  curves of both systems rise up with deeper indented depth. However, the one of the hard gel rises up faster and reaches a greater magnitude than that of the soft at the same depth, giving the stiffer property to the hard gel. The two curves have two linear segments with distinguished RS values, indicating the entire indentation trajectory can be modeled as two depth-zones with different elasticity. We obtained RS,1 = 265 and RS,2 = 249 kPa for the hard gel. Similarly, RS,1 = 60.5 and RS,2 = 27.3 kPa for the soft gel. As seen later, the tendency of Ê would be closely related with that of RS.
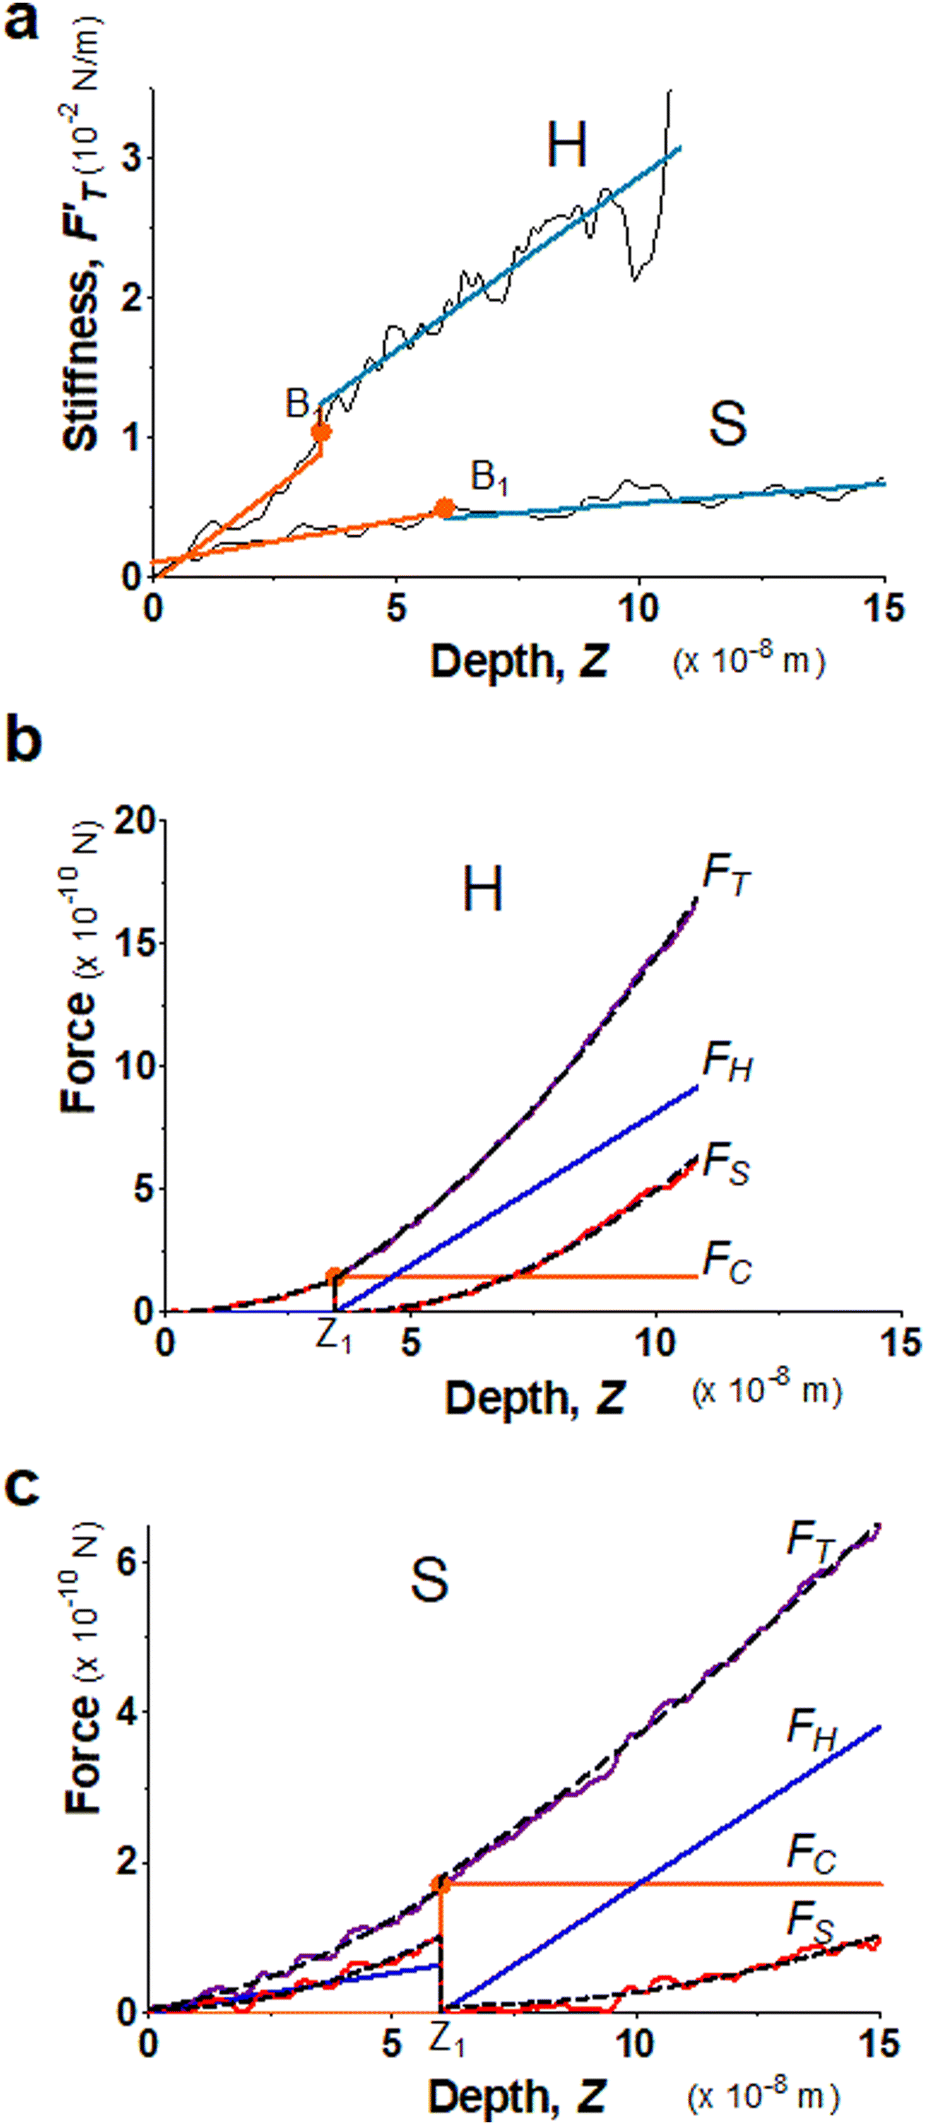 | ||
Fig. 2 Elastic behaviors of gel materials under the AFM indentation. (a) Stiffness–depth curves of two gel materials with different degrees of softness; “H” labels the hard gel while “S” labels the soft. The presenting graphs have been cut on the right for improving the clarity. In the full size, the total length of indented depth is 108 nm for the hard gel and 257.9 nm for the soft. The black solid lines present the FT-derived stiffness data values. B1 is the point breaking the  curve into two segments at a depth of Z1. Here, Z1 = 34.6 nm for “H” and Z1 = 59.9 nm for “S”. ΔZ1 = Z1 − Z0 = Z1, ΔZ2 = Z2 − Z1, while Z2 for both gels is the end of the indentation depth. Each stiffness segment was fitted to a linear function, drawn by an orange line for the first segment and in a light-blue color for the second one. (b) Decompose the restoring force of the hard gel (System 1) into three force components. FT, FC, FH and FS-curves are correspondingly presented by magenta, orange, blue and red lines, while fitting curves are drawn by black dashed lines. (c) Decompose the restoring force of the soft gel (System 2) into three force components. Similar to b, FT, FC, FH and FS are presented by magenta, orange, blue and red lines, respectively. The fitting results are drawn by black dashed lines. curve into two segments at a depth of Z1. Here, Z1 = 34.6 nm for “H” and Z1 = 59.9 nm for “S”. ΔZ1 = Z1 − Z0 = Z1, ΔZ2 = Z2 − Z1, while Z2 for both gels is the end of the indentation depth. Each stiffness segment was fitted to a linear function, drawn by an orange line for the first segment and in a light-blue color for the second one. (b) Decompose the restoring force of the hard gel (System 1) into three force components. FT, FC, FH and FS-curves are correspondingly presented by magenta, orange, blue and red lines, while fitting curves are drawn by black dashed lines. (c) Decompose the restoring force of the soft gel (System 2) into three force components. Similar to b, FT, FC, FH and FS are presented by magenta, orange, blue and red lines, respectively. The fitting results are drawn by black dashed lines. | ||
Fig. 2b and c present the curves of FT as well as the three force components for the two gel systems. We deduced the Ê values from FS-curves (Table 1) and shows that the hard gel has greater Ê's globally. We list the values of trimechanic-3PCS quadruplets in Table 1. We found that kT unambiguously distinguishes the softness between soft and hard gels. As shown for this hard gel sample, the kS dominates the total stiffness, kT, in the first depth-zone, while kH becomes greater than kS at the end. Similarly, kS is greater than kH for the soft gel during the first depth-zone indentation while kH is greater than to kS in the second depth-zone.
| Zone index | Hard | Soft | ||
|---|---|---|---|---|
| 1 | 2 | 1 | 2 | |
| r s is dimensionless throughout the paper. | ||||
| ΔZ (nm) | 34.6 | 73.6 | 59.9 | 198 |
| k C (mN m−1) | 0.00 | 1.92 | 0.00 | 0.86 |
| k T (mN m−1) | 3.92 | 20.0 | 2.66 | 6.52 |
| r S | 1.00 | 0.41 | 0.60 | 0.35 |
| Ê (kPa) | 230 | 236 | 54.4 | 23.4 |
| Zone index | System 3 | System 4 | ||||
|---|---|---|---|---|---|---|
| 1 | 1 | 2 | 3 | 4 | 5 | |
| ΔZ (nm) | 1000 | 74.8 | 76.0 | 94.2 | 92.9 | 62.0 |
| k C (mN m−1) | 0.00 | 0.00 | 3.64 | 14.3 | 55.1 | 241 |
| k T (mN m−1) | 27.2 | 3.93 | 13.9 | 39.4 | 105 | 182 |
| r S | 0.85 | 0.63 | 0.57 | 0.48 | 0.43 | 0.10 |
| Ê (kPa) | 45.2 | 67.5 | 211 | 403 | 984 | 611 |
Based on their nanomechanical types, kH and kS account for the resistances of material to surface displacement (non-bending action) and the extent of the surface penetrated, respectively. This behavior is illustrated by the change in rS value, a numerical quantification for penetration ease. It is closely related to rigidity or deformability of the material. For either system, kT steadily increases with deepened depth and accords with the tendency of  curve. The structure of gel material formed by polymerization of acrylamide and bis-acrylamide depends on many factors such as gel concentration, molar ratio, pH and temperature.45,46
The kH and kS or rS may provide detailed information on stiffening progresses of various indented spots of one gel or different gel composites. It is noteworthy that an effectively sharp tip should be employed instead of a large colloidal indenter for probing such a structural stiffness of material. For a nanostructured material, large spherical tips lead to a result averaged over heterogeneous elastic properties of the material. Consequently, stiffness variations attributed to different substructures and energetics on a nano-meter scale are often overlooked.
We compared the results from the trimechanic-3PCS model with the pyramid tip from AtomicJ software,47 which aims to obtain the best fit of the indentation curve to the Sneddon's solution with a single segment by varying the location of the contact point. The fitting results of responding force from our model and AtomicJ-pyramid are shown in Fig. S2a and b (ESI†). Regarding the fitting goodness, the trimechanic-3PCS model yields a perfect fit, whereas AtomicJ-pyramid performed a poor fitting, particularly on the beginning of the indentation curve. From the data of Ê and kT, it shows that the stiffness of material represented by AtomicJ-pyramid reflects an averaged value in contrast to the refined structural stiffness provided by the trimechanic-3PCS model. Moreover, the stiffness measure by trimechanic-3PCS model follows the tendency of the stiffness–depth curve accurately. It indicates that the trimechanic-3PCS model can be used to delineate the change in elasticity of the material in depth.
Beside the illustrating gel samples for the trimechanic-3PCS model shown in Fig. 2, we have applied this framework to 91 indentation curves of hard gel and 155 of soft gel; the results of kT and Ê are presented in a graph format (see Fig. S3, ESI†). It shows that local elastic behaviors of these gel samples are not necessarily identical. Globally, the category of hard gel (upper sections of Fig. S3a and b, ESI†) exhibits a shorter length of indentation trajectory (the horizontal coordinate) yet much stiffer (brighter colors in intensity) than that of soft gel. It reveals that the hard gel accelerates the stiffening process shortly in depth against the deeper indentation by the AFM tip. Subsequently, the variation in the number of depth-zone is somewhat related to elasticity change in the indentation trajectory.
B. Elastic behaviors of live tissues
Biological tissues are often composed of complex structures. The probed surface of seeding roots of A. thaliana is formed of the external epidermal cell wall, which is structured with complex intertwining of cellulose, hemicellulose, and pectin,48 including about 40% of water.49 Two seedling roots (System 3 and 4) were chosen particularly for illustrating the advantages of using the trimechanic-3PCS model for analyzing elastic responses of live tissues with similar turgor pressure in a condition of constant temperature and buffer medium. In Fig. 3a, System 3 exhibits only one linear segment for the stiffness–depth curve while the other five. For the latter system, the slope of FT-derive stiffness varies gradually and leads to a bent curve, unlike the former one that can be modeled by one straight line. These findings imply the impact of heterogeneous structure on the stiffness measure of plant root tissue, which cannot be modeled as one uniform shell structure.50 Although System 4 has numerous depth-zones, the total depth of indentation is much shorter than that of System 3, 400 nm vs. ∼1 μm. These depths indicate that the indentation was performed within the range of the external epidermal cell wall.51Fig. 3b and c show their corresponding force curves and the three force components.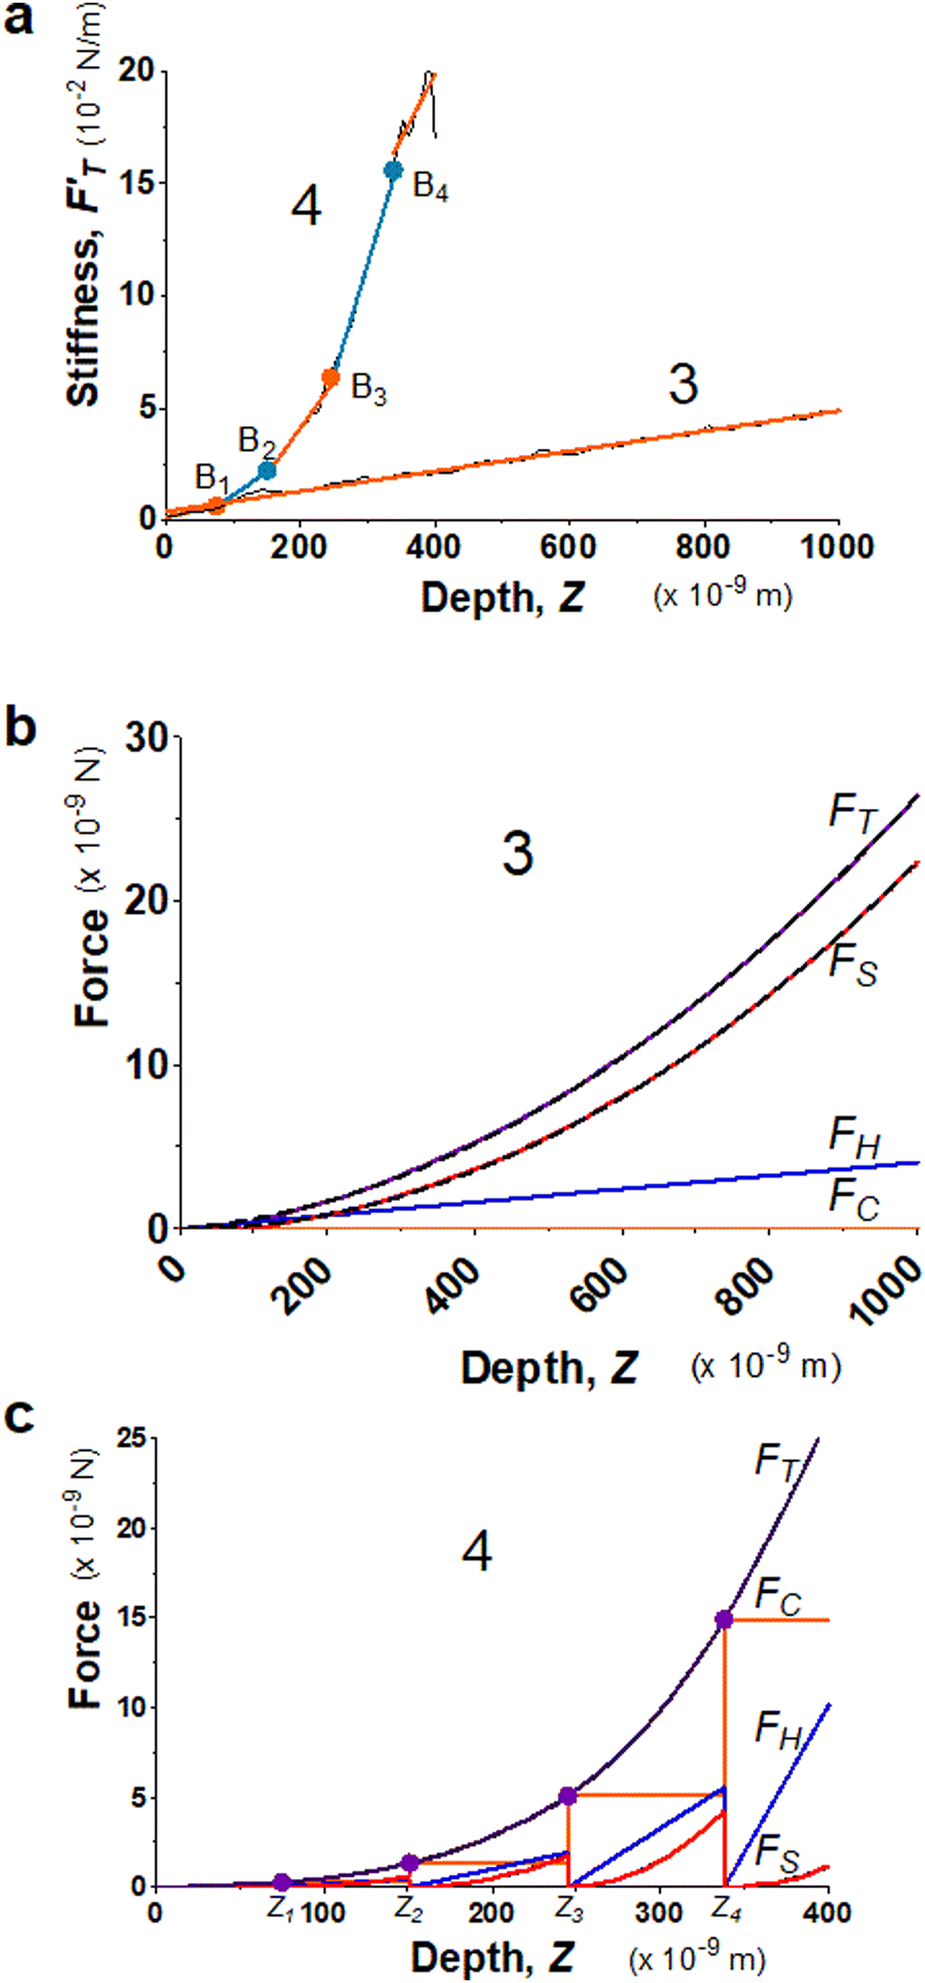 | ||
| Fig. 3 Elastic behaviors of two 4 day-old seedling roots from A. thaliana (System 3 and 4) under AFM indentations. (a) The stiffness–depth curves of the two root systems, and labeled by 3 and 4, respectively. The black solid line presents FT-derived stiffness curves, and the linear fitted segments are indicated by alternating colors, orange and light blue. The Z-coordinates of breaking points for System 4 are Z1 = 74.8, Z2 = 151, Z3 = 245 and Z4 = 338 nm. The single RS of System 3 equals 44.7 kPa, and for the sequential segments of System 4, RS,1 = 67.2, RS,2 = 209, RS,3 = 417, RS,4 = 989, and RS,5 = 570 kPa. (b) Application of trimechanic-3PCS model to System 3. The parameters of trimechanic-3PCS quadruplet are shown in Table 2. (c) Application of trimechanic-3PCS model to System 4. The trimechanic-3PCS quadruplets for the five depth-zones are listed in Table 2. All the plots of FT as well as FC, FH and FS against Z are respectively presented by magenta, orange, blue and red lines. The fitting results are delineated by black dashed lines. | ||
In comparison with AtomicJ-pyramid (Fig. S2c and d, ESI†), we found that when the contact point and force fittings from both models are in good agreement, the deduced effective Young's moduli are unsurprisingly comparable, 45.2 and 45.5 kPa respectively from the trimechanic-3PCS model and AtomicJ-pyramid for System 3. On the contrary, for System 4, the discrepancy becomes severe between the two models (Fig. S2d, ESI†). As mentioned previously, the FT-derived stiffness of this system cannot be modeled as one single linear segment, i.e. uniform elasticity. Nevertheless, the trimechanic-3PCS model reports the Ê values, ranging from 67.5 to 611 kPa, to describe the elasticity variation with depth. Results for the full plant datasets can be found graphically in Fig. S3c and d (ESI†).
For a live tissue of plant root, the magnitude and variation rate of stiffness with indented depth reflect the change of elastic properties through the thickness of the cell wall. In particular, the tip-shape nanomechanics (FS) was found to exert a lower impact on the total response in deeper depth-zones, reflected by a decreased value of rS or FS weight. Such deeper indentations render the surface of the material so stiff that the surface hardly deforms itself to accord with the tip shape. One should not naively attribute the discrepancy between the results of trimechanic-3PCS and AtomicJ-pyramid models solely to the different choice of the contact point. We show in Fig. S1a (ESI†) that even the contact points determined by the two approaches are close, one still obtains incomparable results.
Conclusions
Trimechanic theory is a straightforward outcome of extending the applicability of the Sneddon's pyramid model to the study of elastic heterogeneity. The three force/nanomechanics components, FC, FH and FS, carry information of the impact of hitherto indentation on the material. Analogous to the coordinates of a point in the three-dimensional space, (kC, kH, kS) can be referred to the coordinates of an elastic response in the nanomechanical space, which is spanned by the three modes of nanomechanics. Excellent fittings of FT curves by the trimechanic theory indicate that the best use of the Sneddon's model should be restricted to the FS component instead of the total force FT, and that the Hookean nanomechanics is substantial in the response. The stiffness-based approach to identification of same elasticity can extend to Hertz-spherical-tip model or a model whose force–depth relation follows the power law (a preliminary result for Hertz model is shown in Fig. S4, ESI†). The 3PCS quadruplet [ΔZ, kC, kT, rS] contains all information on characterizing the elastic response of material, from which the modeled forces along the indentation depth can be reconstructed: FT = (kC + kT)·ΔZ, kT itself is the extrinsic stiffness, and Ê can be derived from kT and rS. Moreover, the combinatory ratio of rS and rH alludes to bonding deformability of the composite material. With a nano-sized tip, AFM indentation combined with the trimechanic-3PCS framework provides us a technique to measure the structural stiffness of soft biomaterials, and to quantify the difference of restoring mechanisms from a variety of material conditions. The extended elasticity parameters bring a larger breadth on data comparison than one single parameter, leading to a finer differentiation between elastic properties of materials.Author contributions
S. W. C. and J. L. P. conceived the study. S. W. C. developed the theory and performed the computational analysis. J. M. T. designed and made the gels and performed their indentation. H. K. and C. G. designed and performed indentation on plant roots. S. W. C. and J. L. P. wrote the manuscript with the contributions of all authors.Conflicts of interest
There are no conflicts to declare.Acknowledgements
IBS acknowledges integration into the Interdisciplinary Research Institute of Grenoble (IRIG, CEA). This work acknowledges the AFM platform at the IBS. Dr Anne-Emmanuelle Foucher (IBS, group EPIGEN) is acknowledged for her contribution to polyacrylamide gels. Dr Thierry Desnos (CEA, BIAM) is acknowledged for his contribution to the Arabidopsis thaliana project. Prof. Felix Rico (INSERM, Marseille) and Alessandro Podesta (Univ. Milano) are acknowledged for their useful discussions. Acknowledgment to the ANR project BioPhyt-18-CE20-0023-03 and the support of the European Union's Horizon 2020 research and innovation programme under the Marie Skłodowska-Curie grant agreement No. 812772, Project Phys2BioMed.Notes and references
- J. H. Wang and B. P. Thampatty, Biomech. Model. Mechanobiol., 2006, 5, 1–16 CrossRef PubMed.
- V. Vogel, Annu. Rev. Physiol., 2018, 80, 353–387 CrossRef CAS PubMed.
- J. F. Stoltz and X. Wang, Biorheology, 2002, 39, 5–10 Search PubMed.
- R. M. Hochmuth, J. Biomech., 2000, 33, 15–22 CrossRef CAS.
- H. Zhang and K. K. Liu, J. R. Soc., Interface, 2008, 5, 671–690 CrossRef CAS PubMed.
- O. Otto, P. Rosendahl, A. Mietke, S. Golfier, C. Herold, D. Klaue, S. Girardo, S. Pagliara, A. Ekpenyong, A. Jacobi, M. Wobus, N. Topfner, U. F. Keyser, J. Mansfeld, E. Fischer-Friedrich and J. Guck, Nat. Methods, 2015, 12, 199–202 CrossRef CAS PubMed.
- R. Prevedel, A. Diz-Munoz, G. Ruocco and G. Antonacci, Nat. Methods, 2019, 16, 969–977 CrossRef CAS.
- M. Krieg, G. Flaschner, D. Alsteens, B. M. Gaub, W. H. Roos, G. J. L. Wuite, H. E. Gaub, C. Gerber, Y. F. Dufrene and D. J. Muller, Nat. Rev. Phys., 2019, 1, 41–57 CrossRef.
- M. Lekka, P. Laidler, D. Gil, J. Lekki, Z. Stachura and A. Z. Hrynkiewicz, Eur. Biophys. J., 1999, 28, 312–316 CrossRef CAS PubMed.
- I. Sokolov, in Cancer Nanotechnology, ed. H. S. Nalwa and T. Webster, American Scientific Publishers, 2007, ch. 1, pp. 1–17 Search PubMed.
- S. Kumar and V. M. Weaver, Cancer Metastasis Rev., 2009, 28, 113–127 CrossRef PubMed.
- M. Lekka, K. Pogoda, J. Gostek, O. Klymenko, S. Prauzner-Bechcicki, J. Wiltowska-Zuber, J. Jaczewska, J. Lekki and Z. Stachura, Micron, 2012, 43, 1259–1266 CrossRef PubMed.
- M. Plodinec, M. Loparic, C. A. Monnier, E. C. Obermann, R. Zanetti-Dallenbach, P. Oertle, J. T. Hyotyla, U. Aebi, M. Bentires-Alj, R. Y. Lim and C. A. Schoenenberger, Nat. Nanotechnol., 2012, 7, 757–765 CrossRef CAS PubMed.
- M. Radmacher, M. Fritz, C. M. Kacher, J. P. Cleveland and P. K. Hansma, Biophys. J., 1996, 70, 556–567 CrossRef CAS.
- M. Radmacher, Methods Cell Biol., 2007, 83, 347–372 CAS.
- P. Carl and H. Schillers, Pflugers Archiv., 2008, 457, 551–559 CrossRef CAS PubMed.
- H. Hertz, C. Vermischte Abhandlungen., 1882, pp. 449–464 Search PubMed.
- I. N. Sneddon, Int. J. Eng. Sci., 1965, 3, 47–57 CrossRef.
- F. Rico, P. Roca-Cusachs, N. Gavara, R. Farre, M. Rotger and D. Navajas, Phys. Rev. E: Stat., Nonlinear, Soft Matter Phys., 2005, 72, 021914 CrossRef.
- J. Zemla, J. Bobrowska, A. Kubiak, T. Zielinski, J. Pabijan, K. Pogoda, P. Bobrowski and M. Lekka, Eur. Biophys. J., 2020, 49, 485–495 CrossRef CAS PubMed.
- S. Chiodini, S. Ruiz-Rincon, P. D. Garcia, S. Martin, K. Kettelhoit, I. Armenia, D. B. Werz and P. Cea, Small, 2020, 16, e2000269 CrossRef.
- S. V. Kontomaris and A. Malamou, Eur. J. Phys., 2022, 43, 015010 CrossRef.
- G. Persch, C. Born and B. Utesch, Microelectron. Eng., 1994, 24, 113–121 CrossRef CAS.
- E. K. Dimitriadis, F. Horkay, J. Maresca, B. Kachar and R. S. Chadwick, Biophys. J., 2002, 82, 2798–2810 CrossRef CAS PubMed.
- N. Gavara and R. S. Chadwick, Nat. Nanotechnol., 2012, 7, 733–736 CrossRef CAS PubMed.
- P. D. Garcia and R. Garcia, Biophys. J., 2018, 114, 2923–2932 CrossRef CAS PubMed.
- K. L. Johnson, K. Kendall and A. D. Roberts, Proc. R. Soc. London, Ser. A, 1971, 324, 301–313 CAS.
- B. V. Derjaguin, V. M. Muller and Y. P. Toporov, J. Colloid Interface Sci., 1975, 53, 314–326 CrossRef CAS.
- S. Kasas, X. Wang, H. Hirling, R. Marsault, B. Huni, A. Yersin, R. Regazzi, G. Grenningloh, B. Riederer, L. Forro, G. Dietler and S. Catsicas, Cell Motil. Cytoskeleton, 2005, 62, 124–132 CrossRef CAS PubMed.
- S. Digiuni, A. Berne-Dedieu, C. Martinez-Torres, J. Szecsi, M. Bendahmane, A. Arneodo and F. Argoul, Biophys. J., 2015, 108, 2235–2248 CrossRef CAS PubMed.
- D. C. Lin, D. I. Shreiber, E. K. Dimitriadis and F. Horkay, Biomech. Model. Mechanobiol., 2009, 8, 345–358 CrossRef.
- A. J. Engler, S. Sen, H. L. Sweeney and D. E. Discher, Cell, 2006, 126, 677–689 CrossRef CAS PubMed.
- G. Kaushik, A. Fuhrmann, A. Cammarato and A. J. Engler, Biophys. J., 2011, 101, 2629–2637 CrossRef CAS.
- B. L. Doss, K. Rahmani Eliato, K. H. Lin and R. Ros, Soft Matter, 2019, 15, 1776–1784 RSC.
- V. G. Gisbert and R. Garcia, ACS Nano, 2021, 15, 20574–20581 CrossRef CAS PubMed.
- J. Boussinesq, Application des potentiels à l'étude de l'équilibre et du mouvement des solides élastiques, avec des notes étendues sur divers points de physique mathématique et d'analyse, Gauthier-Villars Imprimeur-Libraire, Paris, 1885 Search PubMed.
- C. Roduit, S. Sekatski, G. Dietler, S. Catsicas, F. Lafont and S. Kasas, Biophys. J., 2009, 97, 674–677 CrossRef CAS PubMed.
- A. C. Dumitru, M. A. Poncin, L. Conrard, Y. F. Dufrene, D. Tyteca and D. Alsteens, Nanoscale Horiz., 2018, 3, 293–304 RSC.
- S. Janel, M. Popoff, N. Barois, E. Werkmeister, S. Divoux, F. Perez and F. Lafont, Nanoscale, 2019, 11, 10320–10328 RSC.
- H. Schillers, C. Rianna, J. Schäpe, T. Luque, H. Doschke, M. Wälte, J. J. Uriarte, N. Campillo, G. P. Michanetzis, J. Bobrowska, A. Dumitru, E. T. Herruzo, S. Bovio, P. Parot, M. Galluzzi, A. Podestà, L. Puricelli, S. Scheuring, Y. Missirlis, R. Garcia, M. Odorico, J. M. Teulon, F. Lafont, M. Lekka, F. Rico, A. Rigato, J.-L. Pellequer, H. Oberleithner, D. Navajas and M. Radmacher, Sci. Rep., 2017, 7, 5117 CrossRef.
- J. R. Tse and A. J. Engler, Current Protocols in Cell Biology, 2010, ch. 10, pp. 10–16 Search PubMed.
- C. Balzergue, T. Dartevelle, C. Godon, E. Laugier, C. Meisrimler, J.-M. Teulon, A. Creff, M. Bissler, C. Brouchoud, A. Hagège, J. Müller, S. Chiarenza, H. Javot, N. Becuwe-Linka, P. David, B. Péret, E. Delannoy, M.-C. Thibaud, J. Armengaud, S. Abel, J.-L. Pellequer, L. Nussaume and T. Desnos, Nat. Commun., 2017, 8, 15300 CrossRef CAS PubMed.
- H. Kaur, C. Godon, J.-M. Teulon, T. Desnos and J.-L. Pellequer, in Mechanics of Cells and Tissues in Diseases, ed. M. Lekka, D. Navajas, M. Radmacher and A. Podestà, Walter de Gruyter GmbH, Berlin/Boston, 2023, vol. 2, pp. 125–138 Search PubMed.
- T. Murashige and F. Skoog, Physiol. Plant., 1962, 15, 473–497 CrossRef CAS.
- D. P. Blattler, F. Garner, K. van Slyke and A. Bradley, J. Chromatogr., 1972, 64, 147–155 CrossRef CAS.
- A. Rath, F. Cunningham and C. M. Deber, Proc. Natl. Acad. Sci. U. S. A., 2013, 110, 15668–15673 CrossRef CAS.
- P. Hermanowicz, M. Sarna, K. Burda and H. Gabrys, Rev. Sci. Instrum., 2014, 85, 063703 CrossRef PubMed.
- P. Albersheim, A. Darvill, K. Roberts, R. Sederoff and A. Staehelin, Plant cell walls. From chemitry to biology, Garland Science, Taylor & Francis Group, LLC, New York, NY, USA, 2011 Search PubMed.
- D. Gaff and D. Carr, Aust. J. Biol. Sci., 1961, 14, 299–311 CrossRef.
- S. Tsugawa, Y. Yamasaki, S. Horiguchi, T. Zhang, T. Muto, Y. Nakaso, K. Ito, R. Takebayashi, K. Okano, E. Akita, R. Yasukuni, T. Demura, T. Mimura, K. Kawaguchi and Y. Hosokawa, Sci. Rep., 2022, 12, 13044 CrossRef CAS.
- P. Derbyshire, K. Findlay, M. C. McCann and K. Roberts, J. Exp. Bot., 2007, 58, 2079–2089 CrossRef CAS.
Footnote |
| † Electronic supplementary information (ESI) available. See DOI: https://doi.org/10.1039/d2nh00390b |
| This journal is © The Royal Society of Chemistry 2023 |