The manipulation of natural mineral chalcopyrite CuFeS2via mechanochemistry: properties and thermoelectric potential†
Peter
Baláž
 a,
Erika
Dutková
 *a,
Matej
Baláž
 a,
Nina
Daneu
b,
Lenka
Findoráková
a,
Jiří
Hejtmánek
a,
Nina
Daneu
b,
Lenka
Findoráková
a,
Jiří
Hejtmánek
 c,
Petr
Levinský
 c,
Karel
Knížek
 c,
Mária
Bali Hudáková
 a,
Róbert
Džunda
d,
Radovan
Bureš
 d and
Viktor
Puchý
d
aInstitute of Geotechnics, Slovak Academy of Sciences, Watsonova 45, 04001 Košice, Slovakia. E-mail: balaz@saske.sk; dutkova@saske.sk; balazm@saske.sk; findorakova@saske.sk; krulakova@saske.sk
bJozef Stefan Institute, Jamova cesta 3, S1-1000 Ljubljana, Slovenia. E-mail: nina.daneu@ijs.si
cInstitute of Physics of the Czech Academy of Sciences, Cukrovarnická 10/112, 16200 Prague, Czech Republic. E-mail: hejtman@fzu.cz; levinsky@fzu.cz; knizek@fzu.cz
dInstitute of Materials Research, Slovak Academy of Sciences, Watsonova 47, 04001 Košice, Slovakia. E-mail: rdzunda@saske.sk; rbures@saske.sk; vpuchy@saske.sk
First published on 10th November 2023
Abstract
In this study, the properties of the natural mineral chalcopyrite CuFeS2 after mechanical activation in a planetary mill were studied. The intensity of mechanical activation was controlled by changing the revolutions of the mill in the range 100–600 min−1. A series of characterization techniques, such as XRD, SEM, TEM, TA (DTA, TG, and DTG), particle size analysis, and UV-vis spectroscopy was applied and reactivity studies were also performed. Several new features were revealed for the mechanically activated chalcopyrite, e.g. the poly-modal distribution of produced nanoparticles on the micrometer scale, agglomeration effects by prolonged milling, possibility to modify the shape of the particles, X-ray amorphization and a shift from a non-cubic (tetragonal) structure to pseudo-cubic structure. The thermoelectric response was evaluated on the “softly” compacted powder via the spark plasma sintering method (very short holding time, low sintering temperature, and moderate pressure) by measuring the Seebeck coefficient and electrical and thermal conductivity above room temperature. The milling process produced samples with lower resistivity compared to the original non-activated sample. The Seebeck data close to zero confirmed the “compensated” character of natural chalcopyrite, reflecting its close-to stoichiometric composition with low concentration of both n- and p-type charge carriers. Alternatively, an evident correlation between thermal conductivity and energy supply by milling was observed with the possibility of band gap manipulation, which is associated with the energy delivered by the milling procedure.
1 Introduction
There are numerous potential, cost-effective natural minerals for application as advanced materials, e.g. energy materials. The tetrahedrite–tennantite series of natural minerals can serve as a good example.1 Among these minerals, chalcopyrite CuFeS2 is a good candidate owing to its unique optical, electrical, magnetic, and thermal properties.2,3 Chalcopyrite obtained from a deep-sea hydrothermal vent was reported to be a suitable thermoelectric energy material.4Chalcopyrite has a tetrahedral coordination with respect to sulphur and different long-range ordering. This mineral is an n-type semiconductor, which crystallizes in a tetragonal system, where CuS4 and FeS4 tetrahedrals form a double-sphalerite structure.5 The structural information for natural tetrahedral chalcopyrite (α-CuFeS2) was first described in 1917.6 Subsequently, other forms of chalcopyrite were revealed, namely the stable cubic form (β-CuFeS2−x) and unstable tetragonal form (γ-CuFeS2).7 Between them, the β-form has less sulphur with the exact formula of CuFeS1.82, which is sometimes replaced with talnakhite Cu17.6Fe17.6S32.8 β-CuFeS2−x shows good chemical reactivity (see Fig. S1 in the ESI†) and can be synthesized at high temperatures2 and/or by high-energy milling.9 To date, the relationship between both the synthetic forms in terms of their chemical reactivity10 and thermoelectric performance8,11–13 has been widely studied.
Herein, our aim was to conduct a systematic study of natural chalcopyrite samples prepared via mechanical activation in a planetary mill. Mechanical activation7,14 was applied as an effective tool for the manipulation of synthetic chalcopyrite several times.15–17 Synthetic chalcopyrite was previously obtained by mechanochemical synthesis;15,18 however, in this case, parasitic sulphidic phases, such as pyrite FeS2 and bornite Cu5FeS4, were also obtained.
Herein, several advanced characterization techniques were applied to obtain information on the changes in physical and chemical properties, reactivity in (s)–(l) and (s)–(s) reactions as well as thermoelectric characteristics of this potential natural energy material.
Moreover, several new facts are elucidated, including the prospective application of the natural mineral together with its synthetic counterpart, the possibility of band gap manipulation by milling, and the quantitative correlation between thermal conductivity and energy supply by milling as representative examples. Furthermore, changes in the milling process from the classical dependence on milling time to dependence on revolution of milling can contribute to the production of energy from the friction to impact mode.
2 Materials and methods
2.1 Materials
Natural chalcopyrite CuFeS2 (deposit Zhezkazgan, Kazakhstan) containing an admixture of 0.95% SiO2 and 2.82% insoluble residue was used.19 The chalcopyrite sample was sieved to a specific particle size (200 μm), and then treated by mechanical activation. The sample with a particle size of less than 35 μm served as a reference (non-activated) substance.2.2 Methods
![[thin space (1/6-em)]](https://www.rsc.org/images/entities/char_2009.gif) :
:![[thin space (1/6-em)]](https://www.rsc.org/images/entities/char_2009.gif) 1.
1.
2.3 Characterization techniques
For the determination of the crystalline phase content of CuFeS2, the relative method proposed by Ohlberg and Strickler was used.20 The effect of mechanical activation can be evaluated based on the mass fraction of the crystalline phase (crystallinity) in the activated sample, X, compared with the reference (non-activated) phase, assuming that it corresponds to 100% crystallinity. Thus it holds that
 | (1) |
In this work, the complementary value to crystallinity, X, was called amorphization, A (sometimes this value is called X-ray amorphization). The values of A were calculated using the following equation:
| A = 100 − X (%) | (2) |
 | (3) |
The band gap energy (Eg) can be determined by utilizing the Tauc eqn (4), as follows:
| (αhν)1/n = A(hν − Eg) | (4) |
2.4 Reactivity
| CuFeS2 + 4HCl → CuCl2 + FeCl2 + 2H2S | (5) |
2.5 Thermoelectricity
The SPS sintered material in the form of pellets exhibited a low density (84% for the milled samples and 63% for the non-milled sample) due to the very “soft” sintering conditions. A diamond wire saw was used to shape the samples for characterization. The electrical resistivity and Seebeck coefficient were measured on about 2 × 2 × 8 mm3 bars under a nitrogen flow in the temperature range of 300 to 620 K via the four-probe method using a custom-made instrument.23 Thermal conductivity was calculated as a product of thermal diffusivity, heat capacity and density. The first two properties were measured on graphite-coated discs (about 1.5 mm high and 10 mm in diameter) under nitrogen flow between 163 and 673 K using a Netzsch LFA 467 instrument and Pyroceram 9606 as the standard for heat capacity. The density was determined at room temperature from the dimensions and mass of the sample and considered temperature independent.3 Results and discussion
3.1 Properties of mechanically activated chalcopyrite CuFeS2
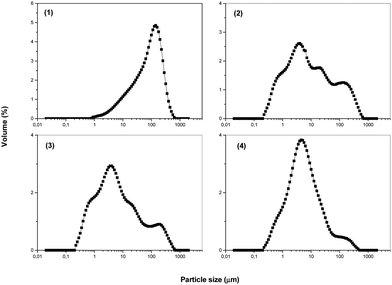 | ||
| Fig. 1 Particle size analysis for mechanically activated chalcopyrite CuFeS2: (1) non-milled sample and samples milled at revolutions of 400 min−1 (2), 500 min−1 (3) and 600 min−1 (4). | ||
From a phenomenological point of view, the following conclusions can be formulated:
– Milling in a planetary mill can be applied to prepare nanosize particles. The application of particles with the desired size and nanoscale dimensions was tested from 90-ties, and later elaborated based on the concept of nano-structuring.27–29 In this case, the positive influence on thermoelectric performance was verified and can also be expected in our case (see the results on thermoelectric performance in Section 3.2 of this work).
– Milling can be also applied to manipulate the nanoparticle distribution. The separate contribution of the three particle sizes (smaller than 5 nm, 5–100 nm and 100–1000 nm) on the lattice thermal conductivity was studied in the literature for PbTe.30
It was demonstrated in our study that a broad distribution of CuFeS2 particles sizes (0.1–600 μm) can be achieved by mechanical activation and it is possible to manipulate this distribution by changing the milling conditions (Fig. 1).
This is a new effect of milling, where a polymodal distribution is obtained. The particle size distribution was measured in triplicate. The dependence was obtained by granulometric analysis and the values of the granulometric specific surface area, Sg, were calculated statistically from the obtained data.
For the chalcopyrite CuFeS2 mechanically activated at various mill revolutions (100–600 min−1), their corresponding surface area values are presented in Fig. 2. The trend for the dependence of the Sa and Sg values on the milling energy represented by the increased revolutions of the mill, n, is the same. After a sharp increase at the beginning of milling (0–200 min−1), a slow decrease was observed. The increase is a result of the formation of fine particles. Subsequently, a plethora of crystallites is formed with developed grain boundaries and a new internal surface area among them, which is characterized by the presence of inner pores. However, the effect of agglomeration also started to be evident at a higher n.
 | ||
| Fig. 2 The adsorption specific surface area Sa (1) and granulometric specific surface area Sg (2) for chalcopyrite CuFeS2 milled at various revolutions n. | ||
The peculiarity of planetary milling is the possibility of changing the milling conditions depending on the supply of milling energy. At the beginning, the impact mode of the balls is dominant, while at higher energies, it is combined with the shear mode (attrition).
In our case, at up to 200 min−1, the dominant comminution of the chalcopyrite particles by the impact mode occurred with the production of a fresh surface. Subsequently, at a higher milling energy (200–600 min−1), the impact mode is combined with the shear mode.24,31–34 In this case, the formation of the new surface area slowed down because of the intervention of chalcopyrite particle agglomeration. The parallel decrease in the Sa and Sg values illustrates this phenomenon, where the chalcopyrite particles are so tightly compressed due to their agglomeration that the nitrogen applied in the adsorption measurements cannot penetrate the inner surfaces and/or pores between crystallites.24 The particles are larger in this case.26
The effects of porosity on the thermoelectric performance are obvious. The numerous boundaries and interfaces produced by mechanical activation have an impact on the behavior of phonons, which are highly scattered, thus reducing the thermal conductivity more than the electrical conductivity.14,29 When nanoscale particles are formed (evidence shown later), quantum-confined effects occur, which enhance the power factor, S2σ.29 A comprehensive study of the thermoelectric properties as a result of the surface morphology and structural changes35 induced by mechanical activation is needed (see results in Section 3.2).
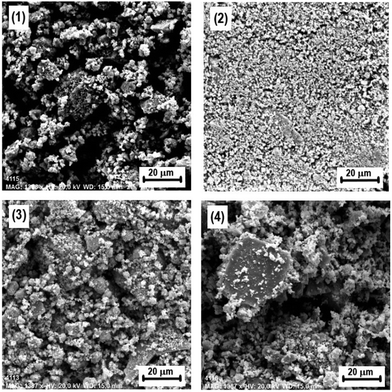 | ||
| Fig. 3 Scanning electron micrographs (SEM) of chalcopyrite CuFeS2 mechanically activated at various mill revolutions of (1) 0 min−1, (2) 200 min−1, (3) 400 min−1, and (4) 600 min−1. | ||
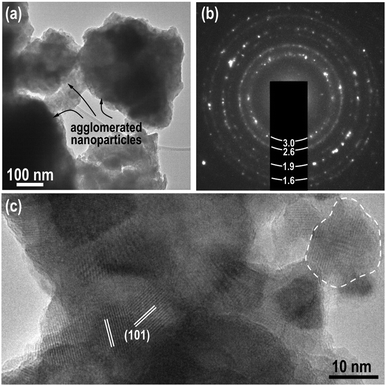
The high-resolution TEM image for the sample mechanically activated at 400 min−1 is shown in Fig. 4. The low-magnification image (Fig. 4(a)) and selected area electron diffraction SAED (Fig. 4(b)) confirm that the sample is composed of agglomerated fine crystallites. Furthermore, the d-values of the most intense diffraction rings match the values of chalcopyrite.
The high-resolution TEM image (Fig. 4(c)) shows that the sample on the TEM grid contained small crystallites with a diameter of 10–20 nm, which matches the average crystallite size determined by XRD (see Fig. 1). The (101) lattice planes (0.47134 nm) are resolved in crystallites with a suitable orientation. The randomly oriented nanoparticles were tightly agglomerated, and therefore nanoparticles with different orientations overlapped in the viewing direction. Consequently, the exact differentiation of individual nanoparticles was impeded. In a few cases, mainly in the thinnest parts of the agglomerates at the very edges, some nanoparticles were better resolved and one of these nanocrystallites is circled in Fig. 4(c).
 | ||
| Fig. 5 Powder X-ray diffraction patterns of mechanically activated chalcopyrite CuFeS2 (revolutions of mill are depicted on the patterns). | ||
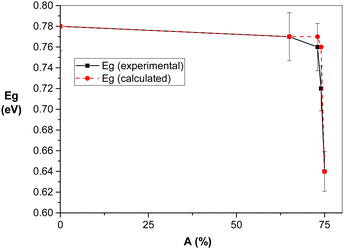
Fig. 6 shows the dependence of amorphization A on the revolutions of the mill n together with the value of the experimentally determined energy gap Eg. Amorphization represents an integral value incorporating both size reduction and defect formation. The amorphization value for the mechanically activated chalcopyrite reached more than 70% for the most intensively treated sample. The patterns also show that the increase in A is sharp at the beginning of milling, and then decreased, showing the same trend in surface area in Fig. 2. This indicates that in both cases, bulk and surface defects are formed during milling. Quantitatively, an increase in specific surface area, Sa, from 0.51 m2 g−1 to 4.5 m2 g−1 for the non-activated sample and sample milled at 600 min−1, respectively, was determined. In parallel, for the same samples, an increase in amorphization, A, from 0 (100% crystallinity) to 71% (29% crystallinity) was calculated.
 | ||
| Fig. 6 Amorphization A (1) and band gap Eg (2) vs. revolutions of mill n for mechanically activated chalcopyrite CuFeS2. | ||
Thus, according to the results from these experiments, high-energy milling can be applied to prepare strongly defect particles. The concept of defect engineering plays an important role in the thermoelectric performance.38–40 In principle, it can influence the thermoelectric properties via two basic strategies, i.e., band engineering by tuning the electronic band structure, and thus enhancing the power factor, if relevant with respect to doping and bandgap value, and/or phonon engineering by stimulating phonon scattering, and thus reducing the lattice thermal conductivity.38 During mechanical activation, various microstructural defects can be formed including zero-, one- and two-dimensional defects, which can selectively influence the scattering of low-, mid- and high-frequency phonons.41 Thus, band engineering and phonon engineering can effectively contribute to the thermoelectric efficiency of materials.42–44 In our case, the samples were not optimized with respect to doping, and thus their electronic properties were essentially impacted by the mechanical activation by the defect and particle size control, which play key roles in thermal transport (see Thermoelectric performance section).
To evaluate the chemical reactivity of the mechanically activated chalcopyrite, copper and iron leaching in HCl lixiviant was proposed (see eqn (2)). The results are depicted in Fig. 7.
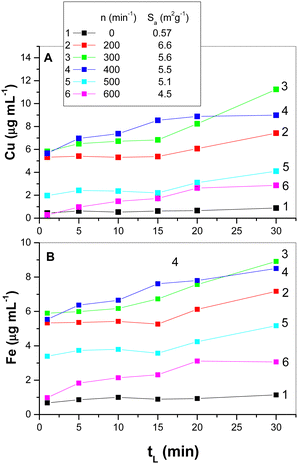 | ||
| Fig. 7 Cu (A) and Fe (B) leached from mechanically activated chalcopyrite CuFeS2; tL is the leaching time and n is the number of mill revolutions. (The inset in A shows the values of adsorption specific area SA from Fig. 2.) | ||
In this case, both metals dissolve from chalcopyrite as chlorides in a liquid form and hydrogen sulphide is formed as a gas product. For comparison, the results for the non-activated chalcopyrite are also shown.
Leaching of mechanically activated chalcopyrite belongs to the surface-sensitive reactions.45 Consistent with this statement, the values of the specific surface area, Sa, for the mechanically activated samples are presented in the inset of Fig. 7(A). For all the mechanically activated samples, a more significant increase in leached metals started at tL = 15 min (with the exception of the sample activated at 400 min−1, where this phenomenon was already observed at tL = 10 min). Mechanical activation by milling at revolutions of n = 300–400 min−1 gave the best results for metals recovery. The application of higher revolutions at n = 500–600 min−1 was not as effective, and thus the metal recoveries were lower. The beginning of the agglomeration phenomena discussed in the previous paragraph (Section 3.1) corresponds to a decrease in the specific surface area, Sa (see inset in Fig. 7(A)). In this case, the effect of agglomeration (see also Fig. 3 in part 3) prevailed over the positive effect of the increasing milling energy and played a decisive role in the chemical reactivity of the mechanically activated CuFeS2. Moreover, the regime of ball movement in the mill changed with an increase in the revolutions of the mill from the most effective cascading regime to the cataracting and centrifugal ones. It is known that two last regimes are less effective at transferring the milling energy to solids.34,46
The improved leaching observed after 15 min is related to the chemical changes of the partly leached species, namely, it is a result of the shortening and weakening of the Cu–S and Fe–S bonds in the sub-surface layers of the activated chalcopyrite. Here, the rupture of the chemical bonds and rearrangement of the surface are expected. The explanation for what happened to the partly leached chalcopyrite before and after the breaking point on the leaching curves is a rather speculative. The literature describes the chemical reactivity of the α- and β-forms of chalcopyrite10 (see Fig. S1 in the ESI†). The shape of the leaching curves for the β-form of chalcopyrite in this case is identical with our results obtained for the mechanically activated samples. Moreover, the flat shape of the leaching curves for the non-activated chalcopyrite (α-form) is also identical.
However, we do not have experimental support to explain what is responsible for this effect. The applied method of X-ray diffractometry in our study could not discriminate between the α- and β-forms of chalcopyrite. The reason for this is that the peaks in the XRD patterns (Fig. 5) of the mechanically activated chalcopyrite are broad, and thus give information related to the induced strain and size of the nanocrystals (see also Section 3.2 in the next paragraph). However, it is not possible to clearly distinguish individual phases (see also Fig. S3 in the ESI†).
Recently, the concept of forming pseudocubic (or cubic-like) species from non-cubic (tetragonal) α-chalcopyrite CuFeS2 was elaborated.12 The properties of the corresponding (cubic) β- chalcopyrite CuFeS1.82 (also known as talnakhite Cu17.6Fe17.6S32) were described in detail.13 From the perspective of thermoelectric performance, cubic or cubic-like chalcopyrite shows ultralow thermal conductivity in comparison with its tetragonal form.8
The DTA curves illustrating the α → β transformation are shown in Fig. 8. In addition to this information, the DTG curves were also recorded (not shown here) to illustrate the weight loss Δm in the mechanically activated chalcopyrite. The DTA curves show a shift in the temperature, Tm, for the formation of β-chalcopyrite to lower values. Namely, the temperature decreased from 503.4 °C to 490.5 °C for the non-activated and mechanically activated (n = 500 min−1) samples, respectively.
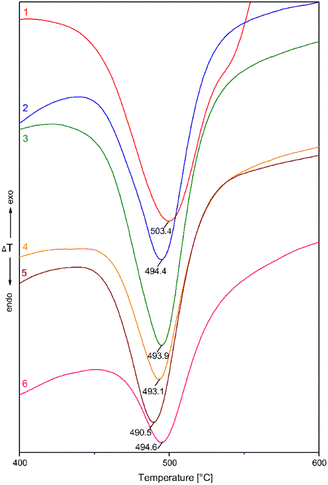 | ||
| Fig. 8 DTA curves of the mechanically activated chalcopyrite at mill revolutions (n) of (1) 0 min−1, (2) 200 min−1, (3) 300 min−1, (4) 400 min−1, (5) 500 min−1 and (6) 600 min−1. | ||
The change in both thermoanalytical parameters (Tm and Δm) was dependent on the revolutions of the mill, n, by which mechanical energy was supplied to the samples. Fig. 9 shows a summary of both quantitative measures, where the decrease in the peak temperature, Tm, for the formation of β-chalcopyrite from the α-form (non-activated sample) is evident. However, an irregularity was detected in the region of n = 400–600 min−1, where the highest energy input was applied. The weight loss, Δm, values also changed with an increase in energy. In this case, Δm of ∼25% was detected for the non-activated sample in comparison with that of ∼6–12% for the mechanically activated samples. According to these results, the loss in sulphur corresponding to the formation of CuFeS2−x (β-chalcopyrite) from the non-activated CuFeS2 was 25%, in comparison with all the mechanically activated samples, where this value was only 6–12%. This provides proof that partial decomposition occurred during milling.
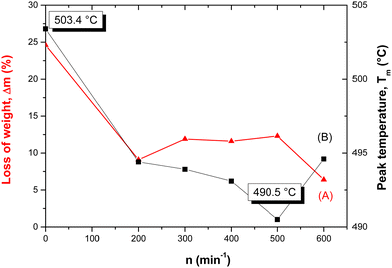 | ||
| Fig. 9 The loss of weight Δm (A) and peak temperature Tm (B) of mechanically activated chalcopyrite CuFeS2vs. mill revolutions n. | ||
Usually the reactivity in solid-state reactions influenced by mechanical intervention corresponds to the delivered mechanical energy. In some cases, when the supply of energy is not optimized, the reactivity can be hampered by relaxation processes51 such as agglomeration.50 In our case, agglomeration was detected at higher energies (see Fig. 2, 3 and 6). However, in the thermal analysis of the mechanically activated samples, the weight loss weight, Δm, the big jump in the region of n = 0–200 min−1 was substantially reduced at n > 200 min−1. This is because in the region of n > 200 min−1, the transformation of α-chalcopyrite is hampered by the presence of non-identified species. The presence of pseudo-cubic chalcopyrite (see also Section 3.2) can serve as a speculative explanation. In the sample with n = 0 min−1 (non-activated tetragonal chalcopyrite), the β-form is absent. However, its previously formed species in the mechanically activated chalcopyrite can explain the low values of Δm for n > 200 min−1.
The first paper showing a possibility of band gap manipulation for several semiconductors was published in 1967.57 In this case, the impact of temperature variation was studied. The following equation satisfactorily representing the experimental data for various species such as C (diamond), Si, Ge, 6H-SiC, GaAs, InP and InAs was derived
| Eg = E0 − αT2/(T + β) | (6) |
According to the dependence of optical band gap, Eg, on the mill revolutions, n, in Fig. 6, the decrease in Eg value with an increase in the milling energy (manifested by an increase in mill revolutions) is evident. However, the decrease in the band gap was not monotonous, where the most intense change was observed for n = 400–600 min−1, which is simultaneously a critical region for other properties, such as thermal and chemical reactivity. Fig. 10 presents the dependence of bandgap, Eg, on the amorphization, A, of chalcopyrite. Strong sensitivity was documented for the highly disordered species, where A > 73% corresponds to the mill revolutions of n > 400 min−1.
In our previous work, the possibility of band gap tuning in high-energy milled chalcopyrite was evidenced for the first time,61 where the same trend as that observed in the present study was documented. In the cited paper, the mechanical activation was performed by the traditional procedure, i.e., by changing the milling time. The mechanism of supplying mechanical energy to CuFeS2via ball milling was the same during the whole milling event. Thus, the impact-to-shear ratio was constant.
In the present study, changes in the revolutions of the mill in the range of 200–600 min−1 (by constant milling time of 60 min) instead of changes caused by just changing the milling time to 60–240 min in the previous study (by constant mill revolutions of 550 min−1) were applied.61 According to,34 the impact-to-shear ratio of the milling balls is not constant in this case because the regime of ball movement changes.
The dependence of band gap, Eg, on the amorphization, A, of chalcopyrite in Fig. 10 is similar to the dependence of the band gap on temperature in Varshni's work (see Fig. S4 in the ESI†). The linear-quadratic relation was derived for the experimental data in Fig. 10, as follows:
| Eg = E0 − [γA2/(100 − δ)2] | (7) |
![[thin space (1/6-em)]](https://www.rsc.org/images/entities/char_2009.gif) min/Eg (experimental) × 100 (%) and Eg
min/Eg (experimental) × 100 (%) and Eg![[thin space (1/6-em)]](https://www.rsc.org/images/entities/char_2009.gif) min = 0.64 eV is the minimum band gap for non-activated CuFeS2.
min = 0.64 eV is the minimum band gap for non-activated CuFeS2.
Besides the solid-state synthesis studied herein, the wet synthesis of CuFeS2 and its band gap tunability was also studied.62Eg spanned in the range of 0.5–2.0 eV, which also includes the range 0.64–0.78 eV observed in our study.
This tunability offers the possibility to tune the properties of thermoelectric materials, namely, their efficiency. The properties such as lattice modification, bond length and influence of strain (among others) play an important role.63 Usually the lattice displacement induced by phonon vibration causes a change in the band energy.64
In summary, high-energy milling, as a non-equilibrium process, can be also used in addition to temperature, pressure and doping as an effective tool for band gap engineering.
3.2 Properties of mechanically activated chalcopyrite CuFeS2 after spark plasma sintering
The production of CuFeS2 powder and modification of its properties by mechanical activation is documented as a gold clue herein. However, any thermoelectric application requires a densified form of samples (pellets), which can be prepared from powder by several non-equilibrium methods such as hot pressing (HP) and/or spark plasma sintering (SPS).14 This compaction process eliminates porosity (usually more than 90% of the theoretical density is required for compact pellets). In our case, the very soft and fast process using SPS technology was applied, as shown in Section 2.2.2. | ||
| Fig. 11 Dependence of lattice parameters a (1) and c (2) and volume of the elemental cell V (3) vs. mill revolutions n for mechanically activated and sintered chalcopyrite CuFeS2. | ||
The dependence of the lattice parameters of chalcopyrite on the mechanical energy supply (modified by varying the mill revolutions) is presented in Fig. 11, where their tendency to decrease for n = 0–400 min−1 is clearly manifested. In this region, the pure tetragonal structure was preserved, and its lattice parameter was in the range of a = 5.2887–5.2832 Å. In this range, the value of a = 5.2851 Å for pure tetragonal chalcopyrite was documented.13 However, for n ≥ 400 min−1, the opposite trend expected for a cubic structure was observed, but the values for the lattice parameter still indicated a tetrahedral structure. In this range, the concept of tetragonal “pseudo-cubic” structure of chalcopyrite CuFeS2 is acceptable.
The irregular behavior of the chalcopyrite nanoparticles was also manifested by the evolution of their crystallite size, as shown in Fig. 12. The general trend of particle comminution from 56 nm for n = 200 min−1 to 28 nm, and finally 18–20 nm by higher energy supply is documented. As described previously (Fig. 1–3), the agglomeration phenomena started to be effective, and it seems that despite the intense SPS, the powder “remembered” its history.
 | ||
| Fig. 13 The thermal conductivity of chalcopyrite CuFeS2 as a function of temperature T (1) and mill revolutions n (2). | ||
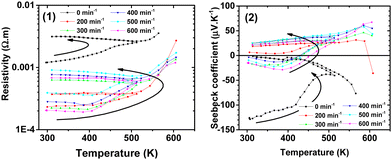 | ||
| Fig. 14 The electrical resistivity ρ (1) and Seebeck coefficient S (2) of chalcopyrite CuFeS2 as a function of temperature T. | ||
Nonetheless, compiling our results and comparing the discussed literature data, we can unambiguously confirm the decrease in thermal conductivity with an increase in mill revolutions (Fig. 13), where we depict the temperature dependence of the thermal conductivity of the prepared samples above 160 K. The positive role of milling in the decrease in the thermal conductivity is evidenced in the second panel in Fig. 13, where the absolute value of the thermal conductivity at ambient temperature and 573 K is shown to be dependent on the mill revolutions. The significant loss of sulphur due to milling, and as a result lower thermal conductivity can be excluded given that the electric transport data for all the samples confirm their p- and n-type conductivity behaviour, which is unrealistic for significant sulphur non-stoichiometry.11
In the case of the reference sample (non-milled), its low relative density of ∼60% due to the soft sintering conditions is responsible for its low thermal conductivity maximum of only ∼5 W m−1 K−1 (see Fig. 13). It should be noted that the thermal conductivity cycling (not shown) between 163 ≥ 673 ≥ 300 K was not a reproducible process for any of the studied samples, where the thermal conductivity further decreased during the cooling run from 673 K to 300 K. As a tentative explanation for this process, we propose a minor grain-surface loss of sulphur emerging at ∼500 K, and simultaneously a small, but systematic modification of the chemical composition of the grains. Due to the contamination of the material by the determined parasitic iron-based phases of Fe2(SO4)3·2(OH)6·H2O, FeSO4·H2O and FeSO4·(H2O)4 (see also ref. 18), the chalcopyrite matrix is iron depleted, which favors the chalcopyrite copper-rich phase exhibiting p-type conductivity.65 Moreover, at close to 500 K, we observed anomalies in the electrical resistivity, which may not reflect the “bulk” change in sulphur concentration inside the agglomerate-grains but more realistically, the chemical modification of the interfacial properties between grains. Consequently, we present the thermal and electric transport data for temperatures only up to 600 K, where if cycled between 300 ≥ 600 ≥ 300 K, thermoelectric transport data only showed a minor change in the charge carrier character of the cycled sample. Specifically, the thermoelectric power slightly tended to small positive values and the increase in electrical resistivity was moderate. Temperature cycling above 600 K simultaneously led to a substantial increase in resistivity at 300 K when cooled and the compensated low-doped character of all the samples (understand p- and n-type charge carriers simultaneously led to S ≈ 0 μV K−1) was modified to clearly p-type semiconductor (S > +100 μV K−1) with two orders higher resistivity with respect to their pristine value.
Further, we comment on the disagreement between the previously published19 and current data, which are both based on mechanically activated identical chalcopyrite samples. This difference is due to the fact that in the previous paper, sintering was performed using the hot press technique, which simultaneously led to: (i) an increase in the crystalline size, (ii) essentially more dense samples and (iii) due to the higher sintering temperature and much longer sintering time, a modified stoichiometry, where partial sulphur deficiency with robust n-type conductivity was straightforward, as reported by Li et al.11 Alternatively, extremely soft sintering via SPS preserved the ideal CuFeS2 stoichiometry without necessary doping. The electrical properties did not vary much with respect to the milling procedure, where the electrical resistivity is high because of the low doping, low compactness of the samples and contamination of the material by oxy-, hydroxy- and iron-based phases, which could complicate the charge carrier percolation.
4 Conclusions
The properties of the natural mineral chalcopyrite CuFeS2 after mechanical activation in a planetary mill were studied. The intensity of mechanical activation was modified by changing revolutions of the mill in the range of 100–600 min−1. Several new effects were revealed and described for the mechanically activated chalcopyrite, as follows:– Poly-modal distribution of produced nanoparticles in the micrometer range. This effect was complicated by the agglomeration upon the supply of higher milling energy.
– The agglomeration effects were confirmed by the change in the specific surface area values and SEM analysis.
– The possibility to modify the shape of particles, X-ray amorphization and tendency of XRD to peak broadening as a result of microstructural defects and nanosizing was also identified.
– The shift from a non-cubic (tetragonal) structure to pseudo-cubic (or cubic-like) structure seemed to be an explanation for the described effects in the mechanically activated species. The thermoanalytical studies documented the formation of cubic chalcopyrite by heating the tetragonal form in an inert atmosphere.
– The possibility of band gap manipulation and correlation between thermal conductivity and energy supply by milling were also revealed.
– The decrease in thermal conductivity due to nano-structuring, while preserving the electric transport characteristics.
Author contributions
Conceptualization: Peter Baláž. Funding acquisition: Peter Baláž, Matej Baláž. Investigation: Erika Dutková, Matej Baláž, Nina Daneu. Methodology: Peter Baláž, Erika Dutková, Mária Bali Hudáková. Project administration: Peter Baláž, Erika Dutková. Resources: Peter Baláž, Matej Baláž. Supervision: Peter Baláž. Validation: Peter Baláž. Visualization: Erika Dutková, Nina Daneu, Nina Daneu, Lenka Findoráková, Jiří Hejtmánek, Petr Levinský, Mária Bali Hudáková, Róbert Džunda. Writing – original draft: Peter Baláž. Writing – review & editing: Peter Baláž, Erika Dutková, Matej Baláž, Nina Daneu, Lenka Findoráková, Jiří Hejtmánek, Petr Levinský, Karel Knížek, Mária Bali Hudáková, Róbert Džunda, Radovan Bureš, Viktor Puchý.Conflicts of interest
The authors declare no conflict of interest.Acknowledgements
This work was supported by the Slovak Research and Development Agency APVV (project APVV-18-0357). The support through the Slovak Grant Agency VEGA (project 2/0112/22) is also acknowledged. P. L. and J. H. acknowledge the financial support of the Operational Program Research, Development and Education financed by European Structural and Investment Funds and the Czech Ministry of Education, Youth and Sports (project no. SOLID21 CZ.02.1.01/0.0/0.0/16_019/0000760).References
- X. Lu, D. T. Morelli, Y. Xia, F. Zhou, V. Ozolins, H. Chi, X. Y. Zhou and C. Uher, Adv. Energy Mater., 2013, 3, 342–348 CrossRef CAS.
- F. Habashi, Chalcopyrite, Its Chemistry and Metallurgy, McGraw-Hill, New York, 1978 Search PubMed.
- B. S. Shah, J. B. Raval, D. Kumar, S. H. Chaki and M. P. Deshpande, J. Alloys Compd., 2023, 938, 168566 CrossRef CAS.
- R. Ang, A. U. Khan, N. Tsujii, K. Takai, R. Nakamura and T. Mori, Angew. Chem., Int. Ed., 2015, 54, 12909–12913 CrossRef CAS PubMed.
- A. V. Powell, J. Appl. Phys., 2019, 126, 100901 CrossRef.
- C. L. Burdick and J. H. Ellis, J. Am. Chem. Soc., 1917, 39, 2518–2525 CrossRef CAS.
- P. Baláž, Extractive Metallurgy of Activated Minerals, Elsevier, Amsterdam, 2000 Search PubMed.
- H. Y. Xie, X. L. Su, X. M. Zhang, S. Q. Hao, T. P. Bailey, C. C. Stoumpos, A. P. Douvalis, X. B. Hu, C. Wolverton, V. P. Dravid, C. Uher, X. F. Tang and M. G. Kanatzidis, J. Am. Chem. Soc., 2019, 141, 10905–10914 CrossRef CAS PubMed.
- E. Gock, Erzmetall, 1978, 31, 282–288 CAS (in German).
- R. C. H. Ferreira and A. R. Burkin, Inst. Min. Metall., 1975, 54–66 CAS.
- J. H. Li, Q. Tan and J. F. Li, J. Alloys Compd., 2013, 551, 143–149 CrossRef CAS.
- J. W. Zhang, R. H. Liu, N. A. Cheng, Y. B. Zhang, J. H. Yang, C. Uher, X. Shi, L. D. Chen and W. Q. Zhang, Adv. Mater., 2014, 26, 3848–3853 CrossRef CAS PubMed.
- D. Zhang, B. Zhang, Z. Z. Zhou, K. L. Peng, H. Wu, H. Y. Wang, G. W. Wang, G. Han, G. Y. Wang, X. Y. Zhou and X. Lu, Chem. Mater., 2021, 33, 9795–9802 CrossRef CAS.
- Y. C. Lan, A. J. Minnich, G. Chen and Z. F. Ren, Adv. Funct. Mater., 2010, 20, 357–376 CrossRef CAS.
- E. Dutkova, Z. Bujnakova, J. Kovac, I. Skorvanek, M. J. Sayagues, A. Zorkovska, J. Kovac and P. Balaz, Adv. Powder Technol., 2018, 29, 1820–1826 CrossRef CAS.
- P. Balaz, M. Balaz, E. Dutkova, M. Hegedus, M. Rajnak, K. Knizek, J. Hejtmanek, J. Navratil, M. Achimovicova and J. Briancin, Acta Phys. Pol., A, 2020, 137, 647–649 CrossRef CAS.
- Y. Li, N. Kawashima, J. Li, A. P. Chandra and A. R. Gerson, Adv. Colloid Interface Sci., 2013, 197, 1–32 Search PubMed.
- S. K. Pradhan, B. Ghosh and L. K. Samanta, Phys. E, 2006, 33, 144–146 CrossRef CAS.
- P. Balaz, E. Dutkova, P. Levinsky, N. Daneu, L. Kubickova, K. Knizek, M. Balaz, J. Navratil, J. Kasparova, V. Ksenofontov, A. Moller and J. Hejtmanek, Mater. Lett., 2020, 275, 128107 CrossRef CAS.
- S. M. Ohlberg and D. W. Strickler, J. Am. Ceram. Soc., 1962, 45, 170–171 CrossRef CAS.
- T. Allen, Particle Size Measurement, Chapman and Hall, London, 1981 Search PubMed.
- S. Palaniandy, Int. J. Miner. Process., 2015, 136, 56–65 CrossRef CAS.
- K. Knizek, J. Hejtmanek, Z. Jirak, C. Martin, M. Hervieu, B. Raveau, G. Andre and F. Bouree, Chem. Mater., 2004, 16, 1104–1110 CrossRef CAS.
- K. Tkáčová, Mechanical Activation of Minerals, Elsevier, Amsterdam, 1989 Search PubMed.
- M. S. Bafghi, A. H. Emami, A. Zakeri and J. V. Khaki, Powder Technol., 2010, 197, 87–90 CrossRef CAS.
- S. X. Zhao, G. R. Wang, H. Y. Yang, G. B. Chen and X. M. Qiu, Trans. Nonferrous Met. Soc. China, 2021, 31, 1465–1474 CrossRef CAS.
- L. D. Hicks and M. S. Dresselhaus, Phys. Rev. B: Condens. Matter Mater. Phys., 1993, 47, 12727–12731 CrossRef CAS PubMed.
- L. D. Hicks and M. S. Dresselhaus, Phys. Rev. B: Condens. Matter Mater. Phys., 1993, 47, 16631–16634 CrossRef CAS PubMed.
- M. S. Dresselhaus, G. Chen, M. Y. Tang, R. G. Yang, H. Lee, D. Z. Wang, Z. F. Ren, J. P. Fleurial and P. Gogna, Adv. Mater., 2007, 19, 1043–1053 CrossRef CAS.
- Z. T. Tian, K. Esfarjani, J. Shiomi, A. S. Henry and G. Chen, Appl. Phys. Lett., 2011, 99, 053122 CrossRef.
- G. Heinicke, Tribochemistry, Akademie Verlag, Berlin, 1984 Search PubMed.
- Q.-Q. Zhao, S. Yamada and G. Jimbo, KONA, 1989, 29–36 CrossRef.
- P. Baláž, Mechanochemistry in Nanoscience and Minerals Engineering, Springer, Berlin Heidelberg, 2008 Search PubMed.
- C. F. Burmeister and A. Kwade, Chem. Soc. Rev., 2013, 42, 7660–7667 RSC.
- D. Kojda, R. Mitdank, S. Weidemann, A. Mogilatenko, Z. Wang, J. Ruhhammer, M. Kroener, W. Tollner, P. Woias, K. Nielsch and S. F. Fischer, Phys. Status Solidi A, 2016, 213, 557–570 CrossRef CAS.
- Q. W. Zhang and F. Saito, Adv. Powder Technol., 2012, 23, 523–531 CrossRef CAS.
- T. Ungar, Scr. Mater., 2014, 57, 777–781 Search PubMed.
- Z. Li, C. Xiao, H. Zhu and Y. Xie, J. Am. Chem. Soc., 2016, 138, 14810–14819 CrossRef CAS PubMed.
- J. He and T. M. Tritt, Science, 2017, 357, eaak9997 CrossRef PubMed.
- Y. Zheng, T. J. Slade, L. Hu, X. Y. Tan, Y. B. Luo, Z. Z. Luo, J. W. Xu, Q. Y. Yan and M. G. Kanatzidis, Chem. Soc. Rev., 2021, 50, 9022–9054 RSC.
- N. Jia, X. Y. Tan, J. W. Xu, Q. Y. Yan and M. G. Kanatzidis, Acc. Mater. Res., 2022, 3, 237–246 CrossRef CAS.
- Y. X. Wu, Z. W. Chen, P. F. Nan, F. Xiong, S. Q. Lin, X. Y. Zhang, Y. Chen, L. D. Chen, B. H. Ge and Y. Z. Pei, Joule, 2019, 3, 1276–1288 CrossRef CAS.
- S. Tippireddy, F. Azough, Vikram, F. T. Tompkins, A. Bhui, R. Freer, R. Grau-Crespo, K. Biswas, P. Vaqueiro and A. V. Powell, Chem. Mater., 2022, 34, 5860–5873 CrossRef CAS PubMed.
- T. Ghosh, M. Dutta, D. Sarkar and K. Biswas, J. Am. Chem. Soc., 2022, 144, 10099–10118 CrossRef CAS PubMed.
- Z. Bujnakova, M. Balaz, M. Zduriencikova, J. Sedlak, M. Caplovicova, L. Caplovic, E. Dutkova, A. Zorkovska, E. Turianicova, P. Balaz, O. Shpotyuk and S. Andrejko, Mater. Sci. Eng., C, 2017, 71, 541–551 CrossRef CAS PubMed.
- S. Bernotat and K. Schonert, Size Reduction, Ullmann`s Encyclopedia of Industrial Chemistry, VCH Verlagsgeselschaft, Wienheim, 1998, vol. B2, pp. 5.1.395–395.5.39 Search PubMed.
- J. E. Hiller and K. Probsthain, Z. Kristallogr., 1956, 108, 108–129 CrossRef CAS.
- A. Lenchev, Z. Chem., 1978, 18, 417–418 CrossRef CAS.
- H. Shima, J. Jpn. Assoc. Mineral., Petrol. Econ. Geol., 1962, 47, 123 CrossRef CAS.
- P. Balaz, K. Tkacova and E. G. Avvakumov, J. Therm. Anal. Calorim., 1989, 35, 1325–1330 CrossRef CAS.
- A. Z. Juhasz and B. Kollath, Acta Chim. Hung., 1993, 130, 725 CAS.
- L. F. Yang, L. D. Dai, H. P. Li, H. Y. Hu, M. L. Hong, X. Y. Zhang and P. F. Liu, Geosci. Front., 2021, 12, 1031–1037 CrossRef CAS.
- R. A. Susilo, Y. Liu, H. W. Sheng, H. L. Dong, R. Sereika, B. Kim, Z. X. Hu, S. J. Li, M. Z. Yuan, C. Petrovic and B. Chen, J. Mater. Chem. C, 2022, 10, 1825–1832 RSC.
- J. J. Feng, C. Li, W. Deng, B. C. Lin, W. H. Liu, R. A. Susilo, H. L. Dong, Z. Q. Chen, N. Zhou, X. L. Yi, X. Z. Xing, F. Ke, Z. X. Liu, H. W. Sheng, Z. X. Shi and B. Chen, J. Phys. Chem. Lett., 2022, 13, 1123–1130 CrossRef PubMed.
- M. Maczka, S. Sobczak, P. Ratajczyk, F. F. Leite, W. Paraguassu, F. Dybala, A. P. Herman, R. Kudrawiec and A. Katrusiak, Chem. Mater., 2022, 34, 7867–7877 CrossRef CAS.
- Z. M. Gibbs, H. Kim, H. Wang, R. L. White, F. Drymiotis, M. Kaviany and G. J. Snyder, Appl. Phys. Lett., 2013, 103, 262109 CrossRef.
- Y. O. Varshni, Physica, 1967, 34, 149–154 CrossRef CAS.
- I. A. Vainshtein, A. F. Zatsepin and V. S. Kortov, Phys. Solid State, 1999, 41, 905–908 CrossRef CAS.
- W. He, Z. X. Wang, T. Zheng, L. Y. Wang and S. W. Zheng, J. Electron. Mater., 2021, 50, 3856–3861 CrossRef CAS.
- P. Shyni and P. P. Pradyumnan, RSC Adv., 2021, 11, 4539–4546 RSC.
- P. Balaz, E. Dutkova, M. Balaz, R. Dzunda, J. Navratil, K. Knizek, P. Levinsky and J. Hejtmanek, ChemistryOpen, 2021, 10, 806–814 CrossRef CAS PubMed.
- B. Bhattacharyya and A. Pandey, J. Am. Chem. Soc., 2016, 138, 10207–10213 CrossRef CAS PubMed.
- W. G. Zeier, A. Zevalkink, Z. M. Gibbs, G. Hautier, M. G. Kanatzidis and G. J. Snyder, Angew. Chem., Int. Ed., 2016, 55, 6826–6841 CrossRef CAS PubMed.
- N. Jia, J. Cao, X. Y. Tan, J. F. Dong, H. F. Liu, C. K. I. Tan, J. W. Xu, Q. Y. Yan, X. J. Loh and A. Suwardi, Mater. Today Phys., 2021, 21, 100519 CrossRef CAS.
- H. Y. Xie, X. L. Su, Y. G. Yan, W. Liu, L. J. Chen, J. F. Fu, J. H. Yang, C. Uher and X. F. Tang, NPG Asia Mater., 2017, 9, e390 CrossRef CAS.
Footnote |
| † Electronic supplementary information (ESI) available. See DOI: https://doi.org/10.1039/d3cp01788e |
| This journal is © the Owner Societies 2023 |

