Conversion of fructose into 5-HMF: a study on the behaviour of heterogeneous cerium-based catalysts and their stability in aqueous media under mild conditions
Angela Dibenedetto*ab,
Michele Arestab,
Carlo Pastore†
b,
Luigi di Bitontob,
Antonella Angeliniab and
Eugenio Quarantaa
aUniversity of Bari, Department of Chemistry, Via Orabona n. 4, 70126 Bari, Italy. E-mail: angela.dibenedetto@uniba.it; Fax: +39 0805443606; Tel: +39 0805443606
bCIRCC, Via Celso Ulpiani n. 27, 70126 Bari, Italy
First published on 6th March 2015
Abstract
In this paper, we present the results of a study on 5-HMF production from fructose by means of heterogeneous catalysts in aqueous media. Mild conditions were used, setting the temperature between 393 K and 443 K. Cerium(IV) phosphates, different from other metal(IV)-phosphates, such as titanium and zirconium, have been characterized only recently. Ce-phosphates are quite complex structures as they show several arrangements. They undergo leaching of the phosphate group as phosphoric acid with consequent slow de-activation of the catalysts. The leaching rate depends on the nature and on the temperature of the calcination of the original phosphates. This opened the question whether the conversion was driven by the heterogeneous catalysts or by the soluble phosphoric acid. A specific test has demonstrated that the solid catalysts are responsible for the conversion of fructose into 5-HMF, more than the liquid phase. We have also demonstrated that the leached phosphate is substituted by fructose on the solid catalyst. A best yield of 52% with selectivity of 93% in batch and 24% in a flow reactor at 443 K (single pass) with a selectivity also >95% were obtained.
1. Introduction
The growing use of fossil-carbon (oil-, coal-, and gas) and its derivatives that result in increasing emissions of CO2 and progressive reduction of natural fossil-C resources, is pushing the interest towards the use of renewables, implementing a biorefinery approach.1–4 A new area of chemistry is growing that aims at developing innovative catalytic reactions able to transform renewable feedstock into chemicals and fuels that may substitute those actually obtained from fossil carbon.5–8 An important intermediate obtainable from cellulosic biomass is 5-hydroxymethylfurfural (5-HMF) that can be prepared by dehydratation of fructose. 5-HMF is defined as a “platform molecule” for the production of chemicals and materials,9–13 and has also been proposed as a key intermediate for fuels.14–16 Example of useful derivatives are: 2,5-furandicarboxylic acid17–19 that may replace terephthalic acid as a monomer in the preparation of plastics, 5-hydroxymethylfuroic acid,20 bishydroxymethylfuran,21,22 2,5-dimethylfuran,23 alkoxymethylfurfurals24 and the diether of 5-HMF that finds application in the production of fuels and polymers. Some important non-furanic compounds can also be produced from 5-HMF: levulinic acid,25 adipic acid,26 1,6-hexanediol27 and caprolactone.28 The most convenient synthetic method of 5-HMF is based on the isomerization of glucose to fructose followed by dehydration of the latter in aqueous media (Fig. 1).The first step is base catalyzed. The triple dehydration of fructose is the way to 5-HMF and requires acid catalysts. Several types of catalysts have been used in such process, such as: mineral acids,29–32 ion exchange resins33,34 and H-form zeolites.35,36
Mineral acids show a low selectivity in the production of 5-HMF (55–63%) due to the formation in water of humins derived from secondary reactions of 5-HMF.29–32 The addition of metal chlorides (Cr(III) or Al(III)) to the acid catalyzed dehydration system, improves the selectivity towards 5-HMF,37,38 but further steps are required to purify the final products at the end of the reaction, with energy loss. The use of exchange resins limits the formation of side-products through the selective absorption of 5-HMF during the reaction (selectivity > 70%), however long reaction times are necessary as low temperatures are used with such catalysts (24–48 h, 363 K).39 Silica nanoparticles40 functionalized with acid (SO3H) and base (NH2) groups are used as catalysts in the one-pot conversion of cellulose to HMF. A yield of 19.2% is obtained after 3 h of reaction (393 K) but the reaction requires the use of ionic liquids as reaction media (e.g. [EMIM]Cl). Heterogeneous acid catalysts offer the advantage of their very easy separation from the reaction products and potentiality of recycling, thus appearing the most suitable catalysts for exploitation in potential industrial processes. Several lanthanide(III) chlorides (DyCl3, YbCl3, LaCl3, NdCl3 and EuCl3) have been tested in water in presence of ionic liquids.41 These catalysts are preferred to other transition metals for the lower toxicity and cost, although they produce humins and other secondary products. TiO2 and ZrO2 have been used as dehydration catalysts in the synthesis of 5-HMF from glucose and fructose.42,43 Good conversion yields were obtained (60–80%), but the selectivity of such process was very low (10–30%). A novel approach to deconstructing cellulose into HMF integrating a sequential enzyme cascade technique in an aqueous system with solid acid catalysis in an organic solvent system was developed,44 but requires additional costs for the management of the plants used. Zirconium and titanium phosphates are very active catalysts in the dehydration of fructose for 5-HMF synthesis:45–47 such systems were used in aqueous media and no appreciable subsequent rehydration to levulinic and formic acids occurred (selectivity = 65–70%). Although there is an abundant amount of literature available on the production of 5-HMF, the conversion of fructose into 5-HMF with heterogeneous catalysts is not fully understood and questions are open about the life of the catalysts. An issue is their stability towards leaching that can deactivate the catalytic materials and shorten their life. The direct conversion of cellulose into 5-HMF is possible working at high temperature (520 K) and using water as solvent, but the harsh conditions required and the low stability of starting and final organic matter, lower the yield because of high loss of material. Our aim is to understand the behavior of catalysts in the C6 to 5-HMF conversion in order to design more stable ones, working under real heterogeneous catalysis in water, in the mildest possible conditions limiting the loss of C6 units as humins or any other by-products. In this paper we present the results of a study on newly synthesized Ce-phosphate used in the dehydration of fructose for the synthesis of 5-HMF.
2. Experimental section
2.1. Materials
Cerium ammonium nitrate ≥98% (by titration); potassium phosphate tribasic monohydrate ≥95%; cerium(IV) oxide fused, pieces, 3–6 mm, 99.9% trace metals basis; phosphoric acid 85% wt in H2O, 99.99% trace metals basis; iron(III) nitrate nonahydrate ≥98%; fructose ≥99%; glucose were ACS grade reagents purchased from Sigma Aldrich.2.2. Catalysts preparation
![[thin space (1/6-em)]](https://www.rsc.org/images/entities/char_2009.gif) :
:![[thin space (1/6-em)]](https://www.rsc.org/images/entities/char_2009.gif) Ce = 3 molar ratio; 5.66 g, 22.67 mmol, in 50 mL of distilled water) was added. The precipitate was isolated and washed 6 times with water (10 mL each). The wet residue was then dried in an oven at 403 K. 4 g of cerium phosphates were finally isolated as an orange-yellow powder. Elemental analysis: P calculated for Ce3(PO4)4: 15.5%; found: 15.4%. When the solid was calcined, its color changed to gray-green (823 K) and white (1173 K).
Ce = 3 molar ratio; 5.66 g, 22.67 mmol, in 50 mL of distilled water) was added. The precipitate was isolated and washed 6 times with water (10 mL each). The wet residue was then dried in an oven at 403 K. 4 g of cerium phosphates were finally isolated as an orange-yellow powder. Elemental analysis: P calculated for Ce3(PO4)4: 15.5%; found: 15.4%. When the solid was calcined, its color changed to gray-green (823 K) and white (1173 K).![[thin space (1/6-em)]](https://www.rsc.org/images/entities/char_2009.gif) :
:![[thin space (1/6-em)]](https://www.rsc.org/images/entities/char_2009.gif) Ce of 2.4. 2.58 g of CeO2 were mixed with 15 mL of a 1.96 M H3PO4 solution. The pale yellow suspension was heated in an iron steel autoclave at 473 K for 5 h. The resulting light yellow product was filtered off, washed five times with distilled water (10 mL) and dried in a N2 flow (1.98 g). Elemental analysis: P calculated for [(Ce(PO4)(HPO4)0.5(H2O)0.5)]: 16.0%; found: 15.8%. The calcined solid was gray at 823 K and white at 1173 K.
Ce of 2.4. 2.58 g of CeO2 were mixed with 15 mL of a 1.96 M H3PO4 solution. The pale yellow suspension was heated in an iron steel autoclave at 473 K for 5 h. The resulting light yellow product was filtered off, washed five times with distilled water (10 mL) and dried in a N2 flow (1.98 g). Elemental analysis: P calculated for [(Ce(PO4)(HPO4)0.5(H2O)0.5)]: 16.0%; found: 15.8%. The calcined solid was gray at 823 K and white at 1173 K.2.3. Catalytic tests
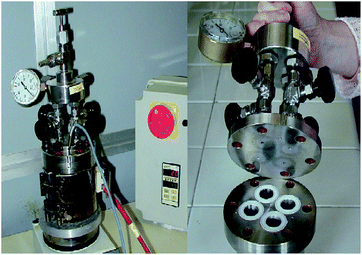
In order to avoid the presence of oxygen during the catalytic tests, all operation were carried out under nitrogen. The kinetics of conversion of fructose into 5-HMF at a fixed temperature (in the range 393–443 K), was studied in a 100 mL steel reactor equipped with a withdrawal valve and an electrical heating jacket. 3.2 g of fructose were dissolved in 64 mL of distilled water in a glass reactor, in which 0.5 g of the catalyst under study and a magnetic stirrer were placed. The glass-reactor was then transferred into the steel reactor, that was closed and heated to the reaction temperature. At fixed intervals of time, 0.5 mL of the solution were withdrawn through the sampling valve and analyzed.For comparing the activity of the different catalysts under study, a 4x-parallel stainless steel autoclave (Fig. 2)52,53 was used. One position of the reactor was always used for a control made of 0.1 g of fructose and 2 mL of distilled water. In the three other positions, samples containing a variable amount of fructose, 2 mL of distilled water and the studied catalyst were loaded.
2.4. Analytical methods
5-HMF was analyzed by using a Jasco HPLC with an UV detector at 284 nm and a ion-exclusion column Phenomenex Rezex RHM-Monosaccharide H+ (8% cross-linked sulfonated styrene–divinylbenzene) 300 × 7.8 mm at 343 K. A 0.005 N solution of sulphuric acid was used as the mobile phase. The flow rate was 0.6 mL min−1. The concentration of fructose, glucose and other by-products were determined using a RI detector.FTIR-DRIFT spectra were recorded with a Shimadzu Prestige 21 instrument equipped with the Shimadzu DRS-8000 basic apparatus modified for our purposes.54 Elemental analysis were carried out on mineralized samples. 31P NMR analysis were made using a 400 MHz Varian NMR spectrometer at 162.0 MHz. The surface characterization was carried out by using the Pulse ChemiSorb 2750 Micromeritics instrument. The analyses of the acid sites were carried out using NH3 as probe-gas using 100 mg of catalyst. The samples were pre-treated under N2 (30 mL min−1) flow and 373 K. The Pulse Chemisorb was performed with NH3 gas using He as carrier gas (30 mL min−1). The TPD were performed under He flow at 30 mL min−1.
13C cross-polarization magic angle scanning (CP-MAS) measurements on the freshly prepared and used catalysts were performed at 151 MHz on a Bruker AVANCE 600 apparatus equipped with a MAS II Pneumatic Unit. The solid sample was packed in a 4 mm zirconia rotor with a Kel-F cap and spinned at 7 kHz during the analysis (delay time = 4 s, determined through an inversion-recovery experiment on the proton that allows to measure longitudinal and spin–lattice T1 relaxation times).
3. Results and discussion
3.1. Catalytic activity of cerium(IV) phosphates in the dehydration of fructose for the synthesis of HMF
Different cerium phosphates (namely, Ce3(PO4)4, [(Ce(PO4) (HPO4)0.5(H2O)0.5)] and [(Ce(PO4)1.5(H2O)(H3O)0.5(H2O)0.5)], labeled as CeP1, CeP2 and CeP3 through the test, respectively) were tested in the dehydration of fructose to 5-HMF. The kinetics of reaction (Fig. 3) carried out at 423 K shows that cerium phosphates accelerate the reaction: in 3 h 30 min the same amount of product was obtained as in 9 h by pure thermal reaction and higher selectivity. | ||
| Fig. 3 Catalytic tests of the three different cerium phosphates in the dehydration of fructose. Reaction conditions: 3.2 g of fructose, 0.5 g of catalyst, 64 mL of water, temperature = 423 K. | ||
The three different phosphates show a different activity under such conditions, and differ for their stability. The reaction profiles show that after 5 h 30 min of reaction a plateau is reached corresponding to a yield of ca. 43–52% 5-HMF. It is worth to emphasize that although in absence of catalysts the HMF yield increased as the reaction time increased the selectivity is very low. After 24 h the conversion of fructose may be as high as 30% but the selectivity is lower than 30%.
Such trend of reaction, is similar to that of zirconium and titanium phosphates reported in the literature,45–47 indicating Ce-phosphates as new candidates for the production of 5-HMF.
A fully surface characterization has been carried out: CeP1, CeP2, CeP3 show about the same surface area (Table 1).
| Entry | Catalysts | BET surface area (m2 g−1) |
|---|---|---|
| 1 | CeP1 | 16.7 |
| 2 | CeP2 | 16.2 |
| 3 | CeP3 | 18.9 |
Fig. 4a shows the TPD profiles for NH3 release from CeP1, CeP2, CeP3. It is evident that CeP1 and CeP3 are richer in strong sites, while CeP2 is richer in medium strength sites.
 | ||
| Fig. 4 TPD profiles for NH3 release from CeP1, CeP2, CeP3 and the correlation of the total number of acid sites and strong acid sites to the formation of 5-HMF. | ||
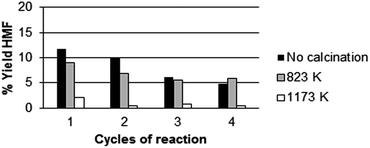
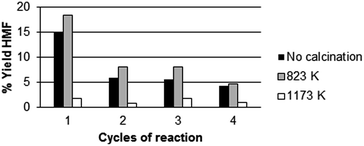
Fig. 4b shows that there is a parallel trend between the yield in 5-HMF and the total number of acid sites. Fig. 4c shows the correlation of strong acid sites to the production of 5-HMF. Apparently, both medium and strong sites play a role in 5-HMF production. Noteworthy, analyzing the fructose conversion vs. HMF formation, we found that the selectivity towards 5-HMF decreases from 79% to 68% after 6 h of reaction. Simultaneously, we have investigated the effect of calcination of the three catalysts listed above at two different temperatures: 823 K and 1173 K. The catalytic activity was measured at 408 K for 3 h using the 4x reactor (Fig. 2). At the end of each reaction cycle, the solutions were separated and analyzed by HPLC, while the residual solid was recovered, washed with water and used for a new catalytic cycle using a fresh solution of fructose (Fig. 5–7).
The experimental data reported in Fig. 5–7 clearly show that the calcination at 823 K improves the resistance of the catalyst (compare the percentage of HMF formed in the different calcination conditions). In particular, in the first run CeP2 and CeP3 calcined at 823 K are also more active than the non-calcined materials. The catalytic activity of CeP3 calcined at 823 K is always higher than that of the non-calcined sample in the four consecutive runs. CeP2 shows a variation of the activity depending on the number of runs: at the fourth run, it is more active than the non-calcined sample. Conversely, after the calcination at 1173 K, the three cerium phosphates become less active than the non calcined samples and the samples calcined at 823 K, also if their activity remains quite constant through the four consecutive runs.
Fig. 3–7 clearly show that:
• for all catalysts, calcined and non-calcined, there is a substantial reduction of activity after the first cycle;
• catalysts calcined at 823 K maintain their activity for longer time than others;
• the activity of the catalysts is in the order CeP3 > CeP1 > CeP2;
• CeP2 decreases its activity at any cycle;
• CeP1 reaches a plateau after the first run, and then maintains its activity;
• catalysts calcined at 1173 K maintain their activity quite constant during the three cycles, but are less active.
In order to gather information on possible changes occurring to the catalysts during the runs, the IR-DRIFT spectra were registered. At the end of each recycling test, the residual catalysts were recovered, washed with distilled water for three times (3 mL) and dried under a nitrogen flow.
The results are reported in Fig. 8 and 9 which show that the calcination at 1173 K affords less modifiable catalysts than the calcination at 823 K. The most significant changes increasing the calcination temperature from 823 K to 1173 K consist in the strong modification of the IR spectrum in the region where the ν(OH) is observed. The position and the intensity of bands at 3500 cm−1 is strongly modified upon calcination and upon reaction.
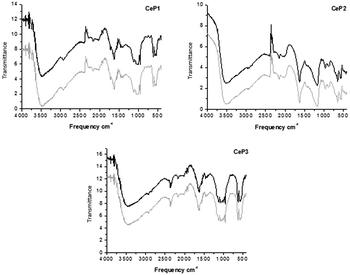 | ||
| Fig. 8 Comparison of the IR-DRIFT spectra of cerium phosphates calcined at 823 K before (black) and after (grey) their use in catalysis. | ||
The higher calcination temperature leads to almost complete loss of water as demonstrated by the strong reduction of the intensity of the above-mentioned band.
Both CeP1 and CeP2 calcined at 823 K show a deep change in the region 3500–3000 and 1250–1000 cm−1, where the ν(OH) and δ(OH) occur. CeP3 shows less important change after use in catalysis, most probably due to its peculiar structure. Its higher stability is joint to a higher activity after the first run as discussed above.
When the sample calcined at 1173 K are considered, one can say that CeP1 and CeP2 are less hydrated than the same samples calcined at 823 K, are more stable during catalytic runs, but, as demonstrated by the XPS spectra,55 the reduction of the cerium atoms from Ce(IV) to Ce(III) occurs: the Ce(III) component at 885.7 and 903.3 eV is quite evident in the XPS spectra. Indeed, after calcination at 1173 K, the samples appear a white-grey powder while they are yellow when not calcined and grey when calcined at 872 K. The thermal treatment at 1173 K may produce a mixture of Ce(III)–Ce(IV) compounds, as demonstrated by XPS analysis that shows a composition 75% of CePO4 and 25% of Ce(P3O9). This is in line with what reported by Nazaraly et al.,56 who used TGA for following the reduction of Ce(IV) to Ce(III). These figures suggest that upon the use in catalysis there is a modification of the structure and the composition of the Ce-phosphate. In order to shade light on such modification the catalytic materials were analyzed for their P-content. The catalyst recovered after the fourth run were isolated by filtration, washed with water and dried under a nitrogen flow as discussed above. The samples were mineralized with concentrated nitric acid and the solution worked up as described in the literature for the colorimetric determination of phosphorus.57 The results of the elemental analysis shown in Table 2 confirm the loss of phosphate during the catalytic runs: so the nature of the catalysts after their use in the dehydration of fructose significantly changes.
| Catalysts | Experimental P (%) | % Loss after 5 runs | |
|---|---|---|---|
| Starting catalyst | After 1st and 5th run | ||
| CeP1 | 15.4 | 11.6–9.8 | 36.4 |
| CeP2 | 15.8 | 7.2–5.9 | 62.6 |
| CeP3 | 14.5 | 11.6–11.0 | 24.1 |
Noteworthy, CeP3, undergoes the less significant change, while CeP2 is the species that is most affected. It was, thus, extremely important to define if the real active sites were on the solid catalysts or in solution, and to characterize the nature of the leached P-species.
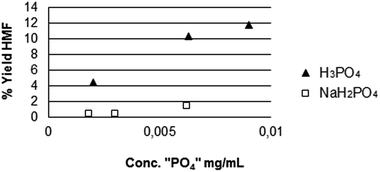
To answer this question, the activity of two phosphates that are putative species formed in solution upon release of P from the catalysts were investigated, namely: H3PO4 and NaH2PO4. The dependence of the activity of such species on their concentration in solution is shown in Fig. 10, working at 408 K. This confirms that the dehydration of fructose is promoted by Bronsted acidity and strong acids are more effective than weak acids. In fact, the dissociation constant for the first and second dissociation of phosphoric acid is Kα1,H3PO4 = 7.1 × 10⁻³ and Kα2,H2PO4− = 7.1 × 10⁻⁸ at 298 K. The low value of the pH of the solution after catalysis (ca. 2.5) suggests that H3PO4 is formed in solution more than H2PO4−, that is in line with the fact that the dehydration is acid-catalysed.
Noteworthy, the pH of a solution of 0.01 g of H3PO4 in 4 mL of water is 1.69 (very close to the value found for the solution formed upon leaching of phosphate, entry 4, Table 3) while the pH of a solution of 0.01 g of NaH2PO4 in 4 mL of water is 4.18, that does not match any of the values found for the solution of the leached phosphate.
| E | Catalyst | System | Time zero | After heating | 31P signal ppm | ||
|---|---|---|---|---|---|---|---|
| Amount of PO4 (mg) | pH | Amount of PO4 (mg) | pH | ||||
| 1 | No catalyst | Only water | — | 5.06 | — | 3.88 | — |
| 2 | No catalyst | Fructose solution | — | 5.10 | — | 3.97 | — |
| 3 | CeP3 | Only water | 1.47 | 2.50 | 2.51 | 2.10 | 0.12 |
| 4 | CeP3 | Fructose solution | 1.48 | 2.30 | 14.54 | 1.71 | 0.09 |
Fig. 10 shows a clear difference of activity for the two putative phosphate-species formed in solution upon release of P from the catalysts. H3PO4 is much more active than its conjugated base H2PO4−.
The presence of H3PO4 was confirmed also by HPLC and 31P NMR (see Table 3). The 31P signals also show that H3PO4 is formed. In fact, NaH2PO4 shows the 31P resonance at −3.5 ppm in water.58 Another interesting information given by Table 3 is that the release of H3PO4 is enhanced in presence of fructose (14.54 mg) with respect to pure water (2.51 mg).
Clearly, the polyol interacts with the catalyst and favours the release of phosphate through a linkage to the Ce-atoms. In order to gain further insight into the role in catalysis of the released acids and the solid, the solution was separated from the solid catalyst after the first run, and catalytic tests were made using separately the solution and the solid (408 K, 0.1 g of fructose, 3 h reaction time, the total volume was adjusted with water at 2 mL). The results are listed in Table 4 that shows that the solid is more active than the solution in producing 5-HMF (>85%), the released phosphates afford only marginal production of 5-HMF.
| Catalysts | 5-HMF production yield (%) | |
|---|---|---|
| Solution | Residual solid | |
| CeP1 | 1.1 | 6.4 |
| CeP2 | 1.2 | 8.2 |
| CeP3 | 0.8 | 11.5 |
Anyway, the catalysts undergo a structural change that is quite important during run 1, and remains quite constant during runs 2–4, that is in agreement with the yield of HMF in the same runs. As Table 3 shows, the presence of fructose enhances the release of phosphoric acid (compare entries 3 and 4). In order to confirm such finding in non-catalytic conditions, CeP2 was heated in a fructose aqueous solution at 373 K (at such temperature no conversion of fructose is observed) for 3 h. Again we found that the amount of leached phosphate in presence of fructose is five times that leached when only water was used. In order to ascertain whether fructose may link to the catalyst, we have carried out CP-MAS spectra of the solid catalysts before and after use in catalysis. The presence of the organic matter linked to the catalysts surface has been demonstrated by solid state 13C CPMAS NMR spectrum. The spectrum of the catalyst recovered after the first run and washed with water shows two broad signals centred at about 68 and 118 ppm that have to be compared with the sharp signals of solid fructose at 68, 71.7, 74.1 ppm and 102.35 ppm. The broad shape of the NMR signals of the catalyst after the catalytic run maybe due to the high dispersion of the organic matter and to its low amount. It is worth to note that the catalyst itself does not show any signal in the range reported above after an acquisition time equal to that of the catalyst after catalysis.
The deactivation of the catalyst is, thus, due to the loss of phosphate and to the insurgence of bonds of the organic species with Ce in a new mixed inorganic–organic compound. The nature of such modified catalysts is still under investigation in our laboratory.
In conclusion, it is clear that the catalysts used leach phosphoric acid during their use in the dehydration of fructose and the latter enhances the leaching of phosphorus as H3PO4. Concurrently, fructose modifies the original phosphate into an inorganic–organic species containing less phosphate: most probably, the C6 species is bonded to the surface causing a lower activity. Such changes take place mostly during the first run and is not as much important in consecutive runs. In fact, increasing the number of the catalytic runs, the leaching of phosphate continues, but at much lower extent, until reaching a maximum after five runs. The reduction of the activity of the catalysts depends on the nature of the original species and on the temperature of calcination. The temperature of 823 K seems to be the most correct, reaching a good compromise of structure stabilization and activity. Higher temperature might affect the oxidation state of Ce, reducing the original Ce(IV) to Ce(III) much less active in catalysis.
3.2. Catalytic activity of cerium(IV) phosphotungstate
The catalytic activity of Ce3(PW12O40)4 was also tested working at 423 K: after 3 h only 10% of HMF was formed (Fig. 11) with a low selectivity of 33% ca.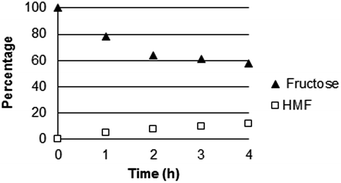 | ||
| Fig. 11 Kinetic study using Ce(IV) phosphotungstate in the dehydration of fructose. Reaction conditions: 3.2 g of fructose, 0.5 g of catalyst, 64 mL of water, temperature = 423 K. | ||
3.3. Test in a flow reactor
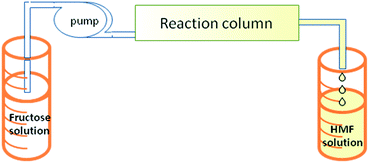
Having identified CeP3 as the most active and resistant catalyst using the batch process, a flow-reactor was used for the production of HMF from fructose. Such study contributed to find the best operative conditions for converting fructose into HMF. The apparatus is represented in Fig. 12.Both the reservoir containing the fructose solution and the cylinder where the reaction solution was collected were graduated so that it was easy to make a (volume)mass-balance.
The pump used allowed to work with a very precise flow (<0.1 mL min−1). The reaction column was filled with cerium phosphates (ca. one gram mixed with glass micro-beads), and heated with an electric jacket. The reaction solution was collected in several fractions of 10 mL and analyzed using HPLC. Table 5 shows that below 443 K there is no conversion of fructose. The best operative conditions are 443 K with a flow rate is 0.20 mL min−1 (entry 5).
| E | T (K) | Starting fructose (mg mL−1) | Flow (mL min−1) | Fractions | HMF yield% | HMF selectivity% |
|---|---|---|---|---|---|---|
| 1 | 403 | 10 | 0.20 | 1–3 | 0.00 | 0.00 |
| 2 | 423 | 10 | 0.20 | 1–4 | 0.00 | 0.00 |
| 3 | 443 | 10 | 0.10 | 1 | 4.14 | 95 |
| 4 | 443 | 10 | 0.15 | 1 | 2.28 | 93 |
| 2 | 8.9 | 96 | ||||
| 5 | 443 | 10 | 0.20 | 1 | 13.90 | 93 |
| 2–4 | 23.9 | 95 | ||||
| 6 | 443 | 10 | 0.30 | 1 | 3.67 | 94 |
| 2–4 | 2.62 | 93 |
Increasing the reaction flow, the yield of HMF decreased, but selectivity of the process grew up, with a lower formation of humins and other co-products. Increasing the starting concentration by 5 times, the conversion yield did not improve: the overall conversion yield remained in the range 14–16% in the best cases, while a reduction of selectivity was again verified.
4. Conclusions
In this work, the possibility of developing a process to manufacture 5-HMF in water under convenient conditions was investigated, using cerium phosphates as catalysts. The kinetics of reaction show that after 5 h 30 min of reaction a plateau in the production of HMF is reached with a yield of 43–52% and a selectivity of 93%.The possibility of reusing a catalyst like cerium(IV) phosphates is linked to the leaching of phosphates. Tests on the recoverability of the catalyst and their use in consecutive runs, show that CeP3 is the most stable catalyst showing a decent activity in the dehydratation of fructose, undergoing the less significant changes. Finally, catalytic tests using CeP3 in a flow reactor afforded a best yield of 23–24% at 443 K (single pass) with a selectivity over 93–96%. Further studies are in progress in order to increase the reaction yield and characterize the materials after the consecutive runs.
Acknowledgements
This work was carried out within the Projects MIUR-PON 01966 Enerbiochem (synthesis and characterization of catalysts) and CTN01_00063_49393 Cluster Project REBIOCHEM (development of the flow reactor).Notes and references
- Biorefinery: from biomass to chemicals and fuels, Refinery of the future: feedstock, processes, products, ed. M. Aresta, A. Dibenedetto and F. Dumeignil, De Gruyter, 2012, pp. 19–48 Search PubMed.
- J. V. Mitchell and B. Mitchell, Energy Policy, 2014, 64, 36 CrossRef PubMed.
- R. F. Aguilera, Energy Policy, 2014, 64, 134 CrossRef PubMed.
- C. McGlade, J. Speirs and S. Sorrel, Energy, 2013, 55, 571 CrossRef PubMed.
- R. A. Sheldon, Green Chem., 2014, 16, 950 RSC.
- M. J. Climent, A. Corma and S. Iborra, Green Chem., 2014, 16, 516 RSC.
- S. Perathoner and G. Centi, Energy, 2014, 61, 719 CAS.
- R. Schlögl, ChemSusChem, 2010, 3, 209 CrossRef PubMed.
- S. P. Teong, G. Yi and Y. Zhang, Green Chem., 2014, 16, 2015 RSC.
- L. Nishita, R. K. Narasimha, S. N. Atul, K. Ganesh and C. Satyanarayana, J. Chem. Sci., 2014, 126, 403 CrossRef PubMed.
- S. Dutta and S. Pal, Biomass Bioenergy, 2014, 62, 182 CrossRef CAS PubMed.
- A. Corma, S. Iborra and A. Velty, Chem. Rev., 2007, 107, 2411 CrossRef CAS PubMed.
- X. Tong, Y. Ma and Y. Li, Appl. Catal., A, 2010, 385, 1 CrossRef CAS PubMed.
- D. Liu and E. Y. X. Chen, ACS Catal., 2014, 4, 1302 CrossRef CAS.
- H. Cai, C. Li, A. Wang and T. Zhang, Catal. Today, 2014, 234, 59 CrossRef CAS PubMed.
- C. V. McNeff and D. T. Nowlan, US Pat. 8697893 B2, 2014.
- S. Siankevich, G. Savoglidis, Z. Fei, G. Laurenczy, D. T. L. Alexander, N. Yan and P. J. Dyson, J. Catal., 2014, 315, 67 CrossRef CAS PubMed.
- A. Villa, M. Schiavoni, S. Campisi, G. Veith and L. Prati, ChemSusChem, 2013, 6, 609 CrossRef CAS PubMed.
- L. Lu, C. Tianming and Z. Junping, Faming Zhuanli Shenging, CN 101891719 A, 2010.
- J. J. Pachemo and M. E. Davis, Proc. Natl. Acad. Sci. U. S. A., 2014, 111, 8363 CrossRef PubMed.
- J. Ohyama, A. Esaki, Y. Yamamoto, S. Arai and A. Satsuma, RSC Adv., 2013, 3, 1033 RSC.
- M. Balakrishnan, E. R. Sacia and A. T. Bell, Green Chem., 2012, 14, 1626 RSC.
- S. Nishimura, N. Ikeda and K. Ebitani, Catal. Today, 2014, 232, 89 CrossRef CAS PubMed.
- Y. Roman-Leshkov, C. J. Barrett, Z. Y. Liu and J. A. Dumesic, Nature, 2007, 447, 982 CrossRef CAS PubMed.
- B. D. Mullen, C. M. Leibig, L. A. Kapicak, D. L. Bunning, S. M. Strand, D. J. Brunelle, D. M. Rodwogin, R. P. Shirtum, A. J. Louwagie and D. J. Yontz, PCT Int. Appl. WO 2013078391 A1, 2013.
- T. R. Boussie, E. L. Dias, Z. M. Fresco, V. J. Murphy, J. Shoemaker, R. Archer and H. Jiang, US Pat. 8669397 B2, 2014.
- J. Tuteja, H. Choudhary, S. Nishimura and K. Ebitani, ChemSusChem, 2014, 7, 96 CrossRef CAS PubMed.
- T. Buntara, S. Noel, P. H. Phua, I. Melián-Cabrera, J. G. de Vries and H. J. Heeres, Angew. Chem., Int. Ed., 2011, 50, 7083 CrossRef CAS PubMed.
- M. Watanabe, K. Yashiro and T. Nishi, PCT Int. Appl., WO 2013146085 A1, 2013.
- Q. Wai, H. Renliang, S. Rongxin and H. Zhimin, Faming Zhuanli Shenging, CN 101724664 A, 2010.
- S. T. Hansen, J. M. Woodley and A. Riisager, Carbohydr. Res., 2009, 344, 2568 CrossRef PubMed.
- Z. Zhao, C. Li, Z. Zhang and Y. Du, Faming Zhuanli Shenqing, CN 101386611 A, 2009.
- J. Pérez-Maqueda, I. Arenas-Ligioiz, Ó. López and J. Fernández-Bolaños, Chem. Eng. Sci., 2014, 109, 244 CrossRef PubMed.
- X. Qi, M. Watanabe, T. M. Aida and R. L. Smith, Green Chem., 2008, 10, 799 RSC.
- H. Suqin, C. Feipeng, J. Fuqiang, L. Yan, W. Jianmei and Y. Gai, Faming Zhuanli Shenging, CN 102212047 A, 2011.
- Y. Du, Q. Liu, H. Cao and C. Bai, Faming Zhuanli Shenging, CN 101434589 A, 2009.
- H. Xianglin, D. Tiansheng and Z. Yulei, Faming Zhuanli Shenqing, CN 101941957 A, 2011.
- S. De, S. Dutta and B. Saha, Green Chem., 2011, 13, 2859 RSC.
- H. E. Vandam, A. P. G. Kieboom and H. Vanbekkum, Starch, 1986, 38, 95 CrossRef CAS.
- W.-H. Peng, Y.-Y. Lee, C. Wu and K. C.-W. Wu, J. Mater. Chem., 2012, 22, 23181 RSC.
- T. Ståhlberg, M. G. Sørensen and A. Riisager, Green Chem., 2010, 12, 321 RSC.
- X. Qi, M. Watanabe, T. M. Aida and R. L. Smith Jr, Catal. Commun., 2008, 9, 2244 CrossRef CAS PubMed.
- I.-J. Kuo, N. Suzuki, Y. Yamauchi and K. C.-W. Wu, RSC Adv., 2013, 3, 2028 RSC.
- Y.-C. Lee, S. Dutta and K. C.-W. Wu, ChemSusChem, 2014, 7, 3241 CrossRef CAS PubMed.
- V. Ordomsky, J. Van der Schaaf, J. C. Schouten and T. A. Nijhuis, ChemSusChem, 2013, 6, 1697 CrossRef CAS PubMed.
- Y. Hiroyuki and A. F. Salak, Jpn. Kokai Tokkyo Koho, JP 2007196174 A 20070809, 2007.
- F. Benvenuti, C. Carlini, P. Patrono, A. M. R. Galletti, G. Sbrana, M. A. Massucci and P. Gallic, Appl. Catal., A, 2000, 194, 147 CrossRef.
- M. Nazaraly, G. Wallez, C. Chanéac, E. Tronc, F. Ribot, M. Quarton and J.-P. Jolivet, J. Phys. Chem. Solids, 2006, 67, 1075 CrossRef CAS PubMed.
- M. Nazaraly, C. Chanéac, F. Ribot, G. Wallez, M. Quarton and J.-P. Jolivet, J. Phys. Chem. Solids, 2007, 68, 795 CrossRef CAS PubMed.
- K. Shimizu, R. Uozumi and A. Satsuma, Catal. Commun., 2009, 10, 1849 CrossRef CAS PubMed.
- D.-L. Long, R. Tsunashima and L. Cronin, Angew. Chem., Int. Ed., 2010, 49, 1736 CrossRef CAS PubMed.
- A. Dibenedetto, A. Angelini, L. di Bitonto, E. De Giglio, S. Cometa and M. Aresta, ChemSusChem, 2014, 7, 1115 CrossRef PubMed.
- M. Aresta, A. Dibenedetto, L. di Bitonto and A. Angelini, Patent MI2013A001136, 2013.
- M. Aresta, A. Dibenedetto, C. Pastore, A. Angelini, B. Aresta and I. Pápai, J. Catal., 2010, 44–52, 269 Search PubMed.
- M. Aresta, A. Dibenedetto, C. Pastore, C. Cuocci, B. Aresta, S. Cometa and E. De Giglio, Catal. Today, 2008, 137, 125 CrossRef CAS PubMed.
- M. Nazaraly, G. Wallez, C. Chanéac, E. Tronc, F. Ribot, M. Quarton and J.-P. Jolivet, Angew. Chem., 2005, 117, 5837 CrossRef.
- C. H. Fiske and Y. Subbarow, J. Biol. Chem., 1925, 66, 375 CAS.
- A. Aldrey, A. Macías, R. Bastida, G. Zaragoza, G. Rama and M. V. López, Org. Biomol. Chem., 2012, 10, 5379 CAS.
Footnote |
| † Present Addresses: Water Research Institute (IRSA-CNR), National Research Council, Via de Blasio 5, 70132 Bari, Italy. |
| This journal is © The Royal Society of Chemistry 2015 |


