 Open Access Article
Circular dichroism and circularly polarized luminescence of ligand-protected molecular metal clusters: insights into structure–chiroptical property relationships
Krishnadas
Kumaranchira Ramankutty

School of Chemistry, Indian Institute of Science Education and Research Thiruvananthapuram, Maruthamala P. O., Vithura, Thiruvananthapuram, 69551, India. E-mail: krishnadas@iisertvm.ac.in
First published on 14th May 2024
Abstract
Molecular noble metal clusters are an emerging class of circularly polarized luminescent (CPL) nanomaterials. Many of the ligand-protected metal clusters exhibit discrete electronic absorption bands, which are assigned to their structural components such as metal core, ligands and metal–ligand interfaces. This implies the suitability of the chiroptical spectroscopic approach to unravel the structure–chiroptical property relationships in molecular metal clusters. Due to the tremendous developments in computational methods for investigating chiroptical properties, along with circular dichroism (CD) and CPL spectroscopy, understanding of the structure–chiroptical properties of these clusters is rapidly progressing. This review discusses various strategies such as the use of chiral ligands, metal atom substitution, ligand exchange, co-crystallization with chiral ligands, etc., for inducing and enhancing the CPL of such metal clusters. This review demonstrates the potential of combined CD-CPL spectroscopic investigations and theoretical calculations to unravel the origins of photoluminescence and CPL activity of chiral metal clusters.
Introduction
Differential emission of left and right circularly polarized light, known as circularly polarized luminescence (CPL), is one of the most fascinating properties of chiral fluorophores.1,2 Small organic molecules, their assemblies,3–5 and rare earth metal complexes6,7 were the materials of interest in the early years of CPL spectroscopy. CPL from chiral nanomaterials of various dimensions has been reported in the recent past.8–13 Among these, atomically precise ligand-protected noble metal clusters are a special class because of their well-defined composition and molecule-like spectroscopic characteristics.14–16 Circular dichroism (CD), which is the differential absorption of left- and right-circularly polarized light, and CPL are complementary techniques as they provide insights into the ground-state and emissive excited-state geometries, respectively, of chiral fluorophores. CD and CPL spectroscopies have been employed extensively to understand the origin of electronic transitions and chirality in small organic molecules.17 The molecular characteristics (precise molecular formula, known crystal structures, and discrete electronic absorption bands assignable to distinct structural components) of ligand-protected metal clusters imply the potential of combined CD-CPL investigations to understand the origin of photoluminescence and chirality in these clusters.18 Such investigations are expected to provide the structure–chiroptical property relationships of these clusters, which is one of the important goals in cluster chemistry. Theoretical calculations have also contributed tremendously in this regard. We discuss these aspects taking some of the recently reported CPL-active, ligand-protected noble metal clusters as examples. A better understanding of the structure–chiroptical properties of these clusters could accelerate their use in applications such as anti-counterfeiting, optical displays, etc.4,19This review also discusses various approaches, such as substitution of metal atoms, ligand exchange of achiral ligands with chiral ligands, co-crystallization with chiral ligands, etc., for inducing and enhancing CPL activity in ligand-protected noble metal clusters. The review is structured in the following manner. We first briefly present the basic principles of CD and CPL spectroscopies and define the dissymmetry factors (g factors) for absorption (gabs) and emission (glum). Then, the complementarity of the CD and CPL techniques, which enables probing the nature of ground and emissive excited states, respectively, of organic molecules, is illustrated with the examples of camphor and camphorquinone, which are among the most thoroughly investigated molecules in chiroptical spectroscopy. The molecular nature of atomically precise noble metal clusters is then briefly explained. Different geometrical origins of chirality in ligand-protected metal clusters are then briefly discussed. Then we discuss some of the reported CPL-active, ligand-protected noble metal clusters in detail. We compare the signs of the CD bands (especially of the band at the longest wavelength) and the signs of the CPL bands as it is generally performed in cases of small organic molecules. The nature of various molecular orbitals (MOs) (as obtained from theoretical calculations), especially those associated with lower energy electronic transitions, is analyzed in terms of the contributions of various atoms in the metal core, at metal–ligand interfaces and in the tail groups of the ligands. This analysis provides insight into the role of distinct structural components in the origin of photoluminescence and chirality in these clusters. Many chiral metal clusters have been reported so far, and there are several review articles and accounts available that summarize the developments in the chirality20–24 and photoluminescence25 of metal clusters in general. This review focuses on the CPL-active ligand-protected noble metal clusters. Though not a noble metal cluster, a Cu4I4-based CPL-active material is also discussed because of its interesting circularly polarized thermally activated delayed fluorescence (CP TADF). References to achiral and/or CPL-inactive metal clusters are provided wherever necessary.
Chiroptical spectroscopy: a brief introduction
Spectroscopy addresses light–matter interactions of molecules and materials. Chiroptical spectroscopy is a special branch of spectroscopy that deals with the interaction of chiral molecules and materials with polarized light. Two major branches of chiroptical spectroscopy are CD and CPL.CD is a special form of electronic absorption (Ultraviolet/Visible, UV/Vis) spectroscopy: in the former, the sample is irradiated alternately with left- and right-circularly polarized light (CP light) at a particular frequency, and, in the latter, the sample is irradiated with unpolarized light. In CD spectroscopy, a chiral molecule or material absorbs left- and right-CP light to different extents and this differential absorption of left- and right-CP light is referred to as CD. Depending on the wavelength range used, we can have electronic CD (ECD) and vibrational CD (VCD). ECD probes the chirality related to electronic states of molecules while VCD probes the chiral vibrational modes. ECD has been one of the most commonly adopted techniques to probe the secondary structures of proteins, DNA, polymers, etc.26 VCD is also of immense utility in probing the chiral conformations of biomolecules, peptides, etc. A variant of chiroptical spectroscopy that probes vibrational optical activity is Raman optical activity (ROA).27 Transient CD spectroscopy can be used to understand the chiroptical properties of excited states in molecules.28
Unless otherwise specified, “CD” generally implies ECD, which is the convention followed in this review, too. The degree of differential absorption of the left and right circularly polarized light (i.e., CD) is quantified using a parameter called the dissymmetry factor for absorption (gabs), which is defined as
| gabs = 2(εL − εR)/(εL + εR) | (1) |
Just as CD is a special form of electronic absorption spectroscopy, CPL spectroscopy is a special form of photoluminescence spectroscopy. In conventional photoluminescence spectroscopy, the sample emits unpolarized light, i.e., the intensities of left- and right-CP light components are equal in the emitted light. In CPL spectroscopy, a chiral molecule or material will emit right- or left-CP light with different intensities. This differential emission of left- or right-CP light is referred to as CPL. Similarly, the degree of circular polarization in the emitted light (i.e., degree of CPL activity) is quantified using a parameter called the dissymmetry factor for emission or luminescence (glum), which is defined as
| glum = 2(IL − IR)/(IL + IR) | (2) |
A chiral molecule or material will exhibit a CD band only if its ground state geometry is chiral. Similarly, a molecule will exhibit CPL activity only if the geometry of the emissive excited state is chiral. Therefore, a combined CD-CPL spectroscopic investigation can provide insights into the structural differences between the geometries of the ground and excited states of chiral molecules and materials.
Kasha's rule states that photoluminescence occurs, in a large majority of molecules, from the lowest electronic excited states. According to the Franck–Condon principle, electronic absorption takes place so fast that the atomic nuclei do not have sufficient time to reorganize. This indicates that molecular geometries of the ground and excited states do not differ significantly. This also implies that the chiroptical properties of the ground and excited states do not differ significantly. As a consequence of Kasha's rule, in a large majority of molecules, CPL spectra consist of a monosignate band with its sign being the same as that of the CD band at the longest wavelength. This implies that (i) the fluorescence and CPL originate from the same electronic excitation as that in the absorption and CD, and that (ii) the geometries (and hence, the relative orientation between the electric and magnetic transition dipole moment vectors) of the ground and emissive excited states are not significantly different. A difference in the sign of the CPL and the CD bands at the longest wavelength implies a significant structural difference in the geometries of the ground and excited states. Apart from the structural differences, the presence of electron withdrawing or donating substituent groups also determines the signs and magnitudes of the CPL bands.4,29 This is because the presence of such groups can alter the electron charge distributions of the chromophore, which in turn alter the magnitudes and/or the relative orientations of the electric and magnetic transition dipole moment vectors (see eqn (3) below).
The intensities of the CD and CPL bands are dictated by the quantity called rotational strength or rotatory strength, which is, approximately, the product of the magnitudes of the electric (μ) and magnetic (m) transition dipole moment vectors and the angle (θ) between these two vectorial quantities.17 An approximate relationship between these parameters is given by the equation,
R = |μ|·|m|cos![[thin space (1/6-em)]](https://www.rsc.org/images/entities/char_2009.gif) θ. θ. | (3) |
If these two transition dipole moment vectors are orthogonal (θ = 90°), no CPL activity is observed. The signs and the magnitudes of gabs and glum values provide insights into the structural differences between the ground-state and the emissive excited-state geometries of molecules.30,31
Illustration of the CD-CPL approach: the examples of camphor and camphorquinone
The general principles mentioned above are illustrated with the examples of R-/S-camphor and R-/S-camphorquinone, which are among the most thoroughly studied molecules in chiroptical spectroscopy. Fig. 1 presents the superimposed CD and CPL spectra of R- and S-camphor and R-/S-camphorquinone. CPL spectra of camphor (Fig. 1A) show two bands with opposite signs. The sign of the CPL band at longer wavelength is negative while the sign of the longest wavelength CD band is positive. The origin of the two CPL bands with opposite signs and the difference in the signs of the CD and CPL bands of camphor are attributed to the presence of two possible excited states with significantly different geometries.32 These two geometries differ in the orientation of the carbonyl group with respect to the methylene bridge.32 However, the CPL spectrum of camphorquinone (Fig. 1B) shows only one band and its sign is the same as that of the CD band at the longest wavelength. This is attributed to the more rigid structure of camphorquinone (because of the presence of two carbonyl groups) when compared with camphor (which has only one carbonyl group).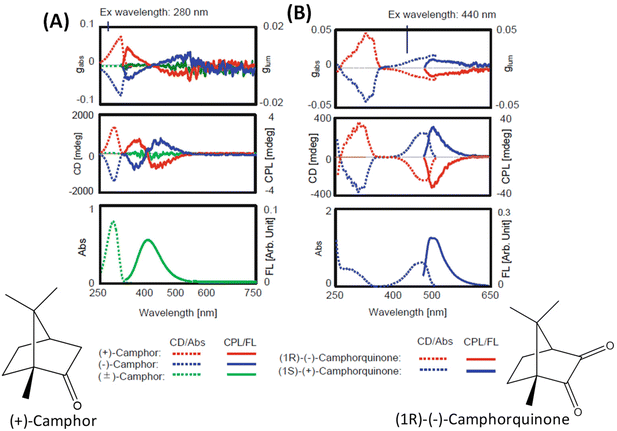 | ||
| Fig. 1 Experimental CD, CPL, absorption and emission spectra of camphor (A) and camphorquinone (B) (reproduced from ref. 4 with permission from Springer Nature, Copyright 2020). | ||
The discussion presented above shows that a combined CD-CPL approach is promising to unravel the structural differences between the ground-state and emissive excited-state geometries of small organic molecules. Now we discuss molecule-like structural and spectroscopic features of atomically precise, ligand-protected noble metal clusters before discussing the CD and CPL spectroscopy of such clusters.
Molecular characteristics of ligand-protected noble metal clusters
Molecule-like properties of ligand-protected noble metal clusters have been well-established using mass spectrometry33 and various spectroscopic techniques.34 This is illustrated with the example of Au25(SR)18 (SR = alkyl/arylthiolate), one of the most thoroughly studied clusters of this family. Though this cluster is achiral, we chose this example because of its simpler structure compared to other clusters. Au25(SR)18 consists of an Au13 icosahedral core protected by six Au2(SR)3 units referred to as staple units as presented in Fig. 2A. As shown in Fig. 2B and C, discrete electronic absorption bands can be assigned to distinct transitions among various MOs.34b Contributions of various atoms in the icosahedral core, at the metal–ligand interface and in tail groups of ligands to various MOs are also shown in Fig. 2B. It is also shown that the discrete electronic transitions shown in Fig. 2B can be assigned as being due to transitions localized or delocalized to the icosahedral core or the ligands, as shown in Fig. 2C. DFT calculations have also shown that the photoluminescence in Au25(SR)18 is due to transitions localized in the icosahedral core and that the involvement of ligands is not significant.34b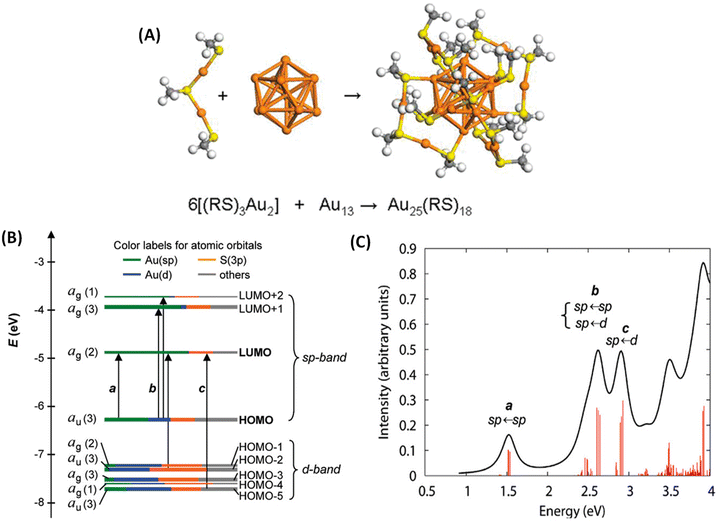 | ||
| Fig. 2 (A) Schematic of the crystal structure of Au25(SR)18 (–SR = alkyl/aryl thiolate), which consists of six Au2(SR)3 staple motifs protecting an Au13 icosahedral core. Color code: orange (Au) and yellow (S). (B) Kohn–Sham orbital energy level diagram for Au25(SH)18−. The energies are in units of eV. Each KS orbital is drawn to indicate the relative contributions (line length with color labels) of the atomic orbitals of Au (6sp) in green, Au (5d) in blue, S (3p) in yellow, and others in gray (those unspecified atomic orbitals, each with a <1% contribution). The left-hand column of the KS orbitals shows the orbital symmetry (g, u) and degeneracy (in parentheses); the right-hand column shows the HOMO and LUMO sets. (C) The theoretical absorption spectrum of Au25(SH)18−. Peak assignments: peak a corresponds to 1.8 eV observed, peak b corresponds to 2.75 eV (observed), and peak c corresponds to 3.1 eV (observed). (A is reproduced from ref. 34a with permission from the American Chemical Society, Copyright 2008; B and C are reproduced from ref. 34b with permission from the American Chemical Society, Copyright 2008). | ||
Chirality in ligand-protected noble metal clusters
Chirality in metal clusters can arise due to several factors. One of the straightforward ways to induce chirality in metal clusters is to incorporate inherently chiral ligands into achiral metal clusters using the ligand exchange strategy.35 Alternatively, metal clusters can be inherently chiral even without the presence of a chiral ligand. Among these, some of the clusters consist of chiral arrangements of achiral ligands at the metal–ligand interfaces.36–39 There are also clusters with inherently chiral arrangements of metal atoms in the core.40 Further details on the origin of chirality in metal clusters can be found in several review and account articles.20–24 Specific examples of each of these cases will be discussed in the following sections in the light of their CPL activity.CPL from ligand-protected noble metal clusters
The first report of CPL from ligand-protected noble metal clusters was by Kumar et al.41 They suggested, based on previous reports, that Ag29(DHLA)12 (DHLA = dihydroxylipoic acid) could be a likely composition for these clusters. The sign of the CPL band was the same as that of the longest wavelength CD band (see Fig. 3), which indicates that the CD and CPL arise from the same electronic transitions. The CPL activity of these clusters was attributed to the chirality in the ligand staples. However, transitions involving the ligands are, in general, expected to occur in the higher energy region, not in the lower energy region. Furthermore, theoretical calculations suggest that the photoluminescence of this cluster is more likely to originate from the metal-core-centred electronic excitations.43 Therefore, further experiments are required to confirm the origin of the CPL activity in Ag29 clusters. The observed gabs and glum values were 1.5 × 10⁻³ (at 500 nm) and 2 × 10⁻³ (at 660 nm), respectively. It is worth noting that the gabs and glum values are comparable to those of small organic molecules. This also suggests that the electronic transitions corresponding to the CD band at around 500 nm (which correspond to the core-based excitations) might be the transitions responsible for the CPL activity in these clusters.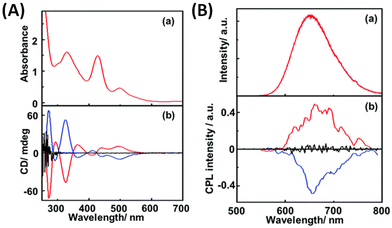 | ||
| Fig. 3 (A) Absorption (a) and CD spectra (b) of R- (red lines), S- (blue line) and rac-Ag29(DHLA)12 NCs (black line) and (B) emission (a) and CPL spectra (b) of R- (red lines), S- (blue line) and rac-NCs (black line). (Reproduced from ref. 41 with permission from the Royal Society of Chemistry, Copyright 2017). DHLA is α-dihydroxylipoic acid. | ||
Interestingly, Yoshida et al. have shown that Ag29(S2R) (S2R = dithiolate ligand) clusters are inherently chiral,42i.e., even in the absence of a chiral ligand such as DHLA. To the best of our knowledge, CPL from these inherently chiral Ag29 clusters has not been reported so far (despite the successful separation of their enantiomers).
Han et al. reported strongly CPL-active enantiomers of octahedral Ag6(L6/D6) where L/D corresponds to the chiral non-emissive ligand namely, (S)-/(R)-4-isopropylthiazolidine-2-thione (Fig. 4A).44 The HOMO of these clusters is mostly localized on the Ag, S and N atoms while the LUMO is localized on the central Ag atoms. The lowest energy band is attributed mainly to the HOMO–LUMO transitions (see Fig. 5C and D). Therefore, DFT calculations indicate that the CPL activity of these silver clusters originates from ligand-to-metal–metal charge transfer transitions. The observed glum value was 4.42 × 10⁻³. The gabs values were not reported for these clusters. The sign of the CPL band of Ag6L6 is the same as that of the CD band at the longest wavelength (Fig. 5A and B). These clusters exhibited an exceptionally high quantum yield (QY) of 95% and photophysical measurements indicate that thermally activated delayed fluorescence (TADF) is responsible for the observed CPL activity and high QY.
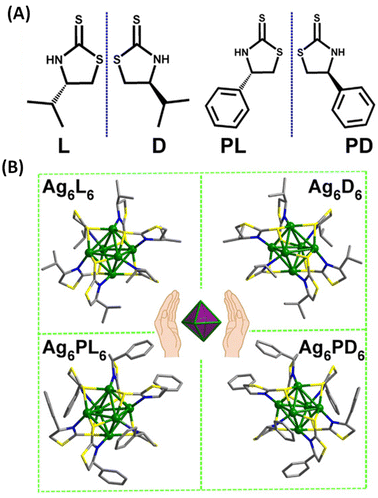 | ||
| Fig. 4 (A) Structures of (S)-/(R)-4-isopropylthiazolidine-2-thione (L/D) and (S)-/(R)-4-phenylthiazolidine-2-thione (PL/PD) ligands. (B) Ball-and-stick representation of the enantiomers of Ag6L6/D6 and Ag6PL6/PD6. Inset: schematic of the Ag6 octahedron core in these enantiomers. (Reproduced from ref. 44 with permission from the American Association for the Advancement of Science, Copyright 2020). | ||
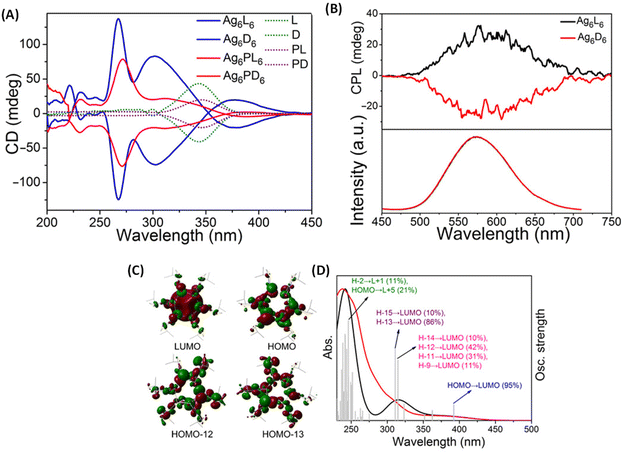 | ||
| Fig. 5 (A) CD spectra of clusters Ag6L6/D6 and Ag6PL6/PD6, together with ligands L/D and PL/PD in CH2Cl2 in the wavelength range of 200 to 450 nm. (B) CPL spectra (top) and the corresponding emission spectra (bottom) of Ag6L6 and Ag6D6 in CH2Cl2. (C) Selected frontier molecular orbital representations of Ag6L6 in optimized structures of S0. (D) Experimental optical absorption spectrum (red) of Ag6L6 in CH2Cl2 compared to the calculated spectrum (black). Gray bars show the individual transitions (delta function-like peaks showing the relative oscillator strengths). (Reproduced from ref. 44 with permission from the American Association for the Advancement of Science, Copyright 2020). | ||
Zhang et al. synthesized enantiomeric [Ag17(R/S-NYA)12](NO3)3 (denoted as R/S-Ag17) clusters, where R-/S-NYA is N-((R/S)-1-(naphthalen-4-yl)ethyl)prop-2-yn-1-amine (Fig. 6A).46 The maximum glum value of R/S-Ag17 at 745 nm was found to be ∼ ± 1.2 × 10⁻³. The CPL bands remained almost unchanged when excitation wavelengths were changed from 360 to 500 nm, except for slight changes in the intensities, as shown in Fig. 6C. DFT calculations indicated that electronic transitions above 300 nm were attributed to the transition between the S and P superatomic HOMO and LUMO orbitals. Contributions from the Ag atoms dominate the HOMO (66.4% Ag, 16.64% –C![[triple bond, length as m-dash]](https://www.rsc.org/images/entities/char_e002.gif) C and 7.14% N) and LUMO (66.85% Ag, 3.65% –C
C and 7.14% N) and LUMO (66.85% Ag, 3.65% –C![[triple bond, length as m-dash]](https://www.rsc.org/images/entities/char_e002.gif) C and 22.77% N) of these clusters while contributions from the –C
C and 22.77% N) of these clusters while contributions from the –C![[triple bond, length as m-dash]](https://www.rsc.org/images/entities/char_e002.gif) C groups and N atoms were also considerable. Therefore, electronic transitions responsible for CPL are delocalized across both the ligands and the core Ag atoms. It is worth noting that the sign of the CD band (at around 538 nm, at the longest wavelength) and that of the CPL band are opposite (see Fig. 6B and C). In general, such a sign change indicates significant structural changes between the ground-state and emissive excited-state geometries (see the example of camphor and camphorquinone discussed earlier). Details of such excited-state changes in geometries have not yet been the focus of current studies on such clusters.
C groups and N atoms were also considerable. Therefore, electronic transitions responsible for CPL are delocalized across both the ligands and the core Ag atoms. It is worth noting that the sign of the CD band (at around 538 nm, at the longest wavelength) and that of the CPL band are opposite (see Fig. 6B and C). In general, such a sign change indicates significant structural changes between the ground-state and emissive excited-state geometries (see the example of camphor and camphorquinone discussed earlier). Details of such excited-state changes in geometries have not yet been the focus of current studies on such clusters.
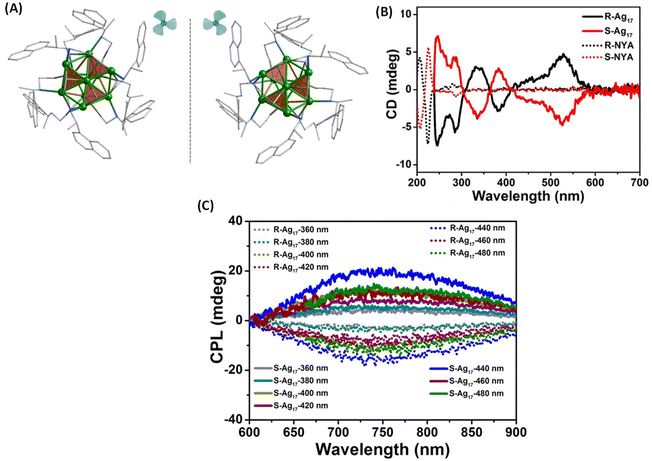 | ||
| Fig. 6 (A) The aromatic moieties of the ligands resemble a triblade fan when viewed parallel to the C3 axis. Color code: Ag, green; N, blue; C, gray. All hydrogen atoms have been omitted for clarity. (B) CD spectra of R/S-Ag17 (solid trace) and ligands R/S-NYA (dotted trace) in solution and (C) CPL spectra of R/S-Ag17 at different excitation wavelengths in the solid state. (Reproduced from ref. 46 with permission from the American Chemical Society, Copyright 2021). | ||
Binaphthalene-based chiral ligands have been extensively used for inducing chiroptical properties in metal clusters.18 Tang et al. reported CPL activity from a three-atom gold cluster, Au3[(R/S)-Tol-BINAP]3Cl, where (R/S)-Tol-BINAP, namely (R)- or (S)-2,2′-bis(di-p-tolylphosphino)-1,1′-binaphthyl, is a chiral ligand (Fig. 7).45 These clusters are soluble in dichloromethane and exhibit distinct CD bands (Fig. 7B); however, they do not exhibit any photoluminescence in pure dichloromethane. When hexane is added, these clusters exhibit luminescence and, more interestingly, CPL activity. The maximum glum value observed for these clusters is ∼7 × 10⁻³. It is noted that the signs of the longest wavelength CD band and that of the CPL band are the same (Fig. 7B and C). The emergence of photoluminescence is attributed to the strong C–H⋯π interactions between the ligands of the clusters in the aggregated form, which reduced the non-radiative relaxation pathways. This example demonstrates the importance of solvent effects in understanding chiroptical properties, especially CPL, of ligand-protected noble metal clusters.
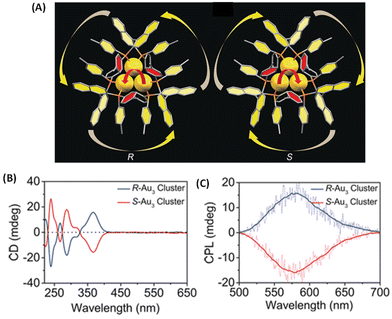 | ||
| Fig. 7 (A) The overall structures of R/S-Au3. Color codes: Au, yellow; P, orange; C, gray. (B) CD spectra of Au3[(R)-Tol-BINAP]3Cl and Au3[(S)-Tol-BINAP]3Cl clusters in DCM. (C) CPL spectra of R-Au3 and S-Au3 assemblies in 70% n-hexane. (Reproduced from ref. 45 with permission from John Wiley and Sons, Copyright 2017). | ||
Tsukuda et al. synthesized an enantiomeric pair of superatomic clusters, i.e. [IrAu12((R,R)-DIPAMP)5Cl2]+ and [IrAu12((S,S)-DIPAMP)5Cl2]+ (referred to as IrAu12-R/S), where DIPAMP is 1,2-bis[(2-methoxyphenyl)phenylphosphino]ethane (see Fig. 8).47 These are interesting systems for studying the origin of CPL activity because such clusters consist of a symmetric icosahedral IrAu12 core and the effect of metal-atom substitution can be investigated. Single-crystal X-ray diffraction analysis revealed that the icosahedral Ir@Au12 core of IrAu12-R/S is more twisted along the Cl–Au–Ir–Au–Cl axis compared with the Au13 core of Au13-R/S, leading to larger gabs values. The gabs values are ∼3 × 10⁻³ at 365 nm and ∼4 × 10⁻³ at 475 nm, respectively, at 300 K. The |glum| values for IrAu12-R/S at 300 K are 3 × 10⁻³ and ∼2 × 10⁻³, respectively. The difference in the |glum| values between IrAu12-R and IrAu12-S was attributed to the limited sensitivity of the CPL spectrometer. The sign of the longest wavelength CD band (at ∼530 nm) was the same as that of the CPL band (Fig. 8B and C). The magnitudes of the glum and gabs values were close to each other. DFT calculations suggest that the low-energy transitions of this cluster are due to the HOMO–LUMO transitions mostly being localized on the IrAu12 core48 and hence, the CPL of these clusters is likely to have originated from core-localized electronic transitions.
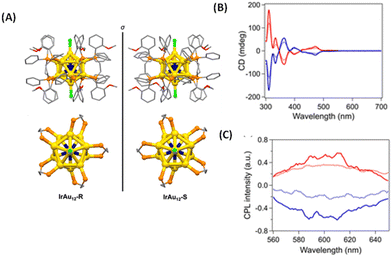 | ||
| Fig. 8 (A) Crystal structures of IrAu12-R (left) and IrAu12-S (right). Phenyl rings, ethylene bridges, and methoxy groups are shown as sticks, while hydrogen atoms have been omitted for simplicity. Top view (bottom) of the core structures of IrAu12-R (left) and IrAu12-S (right). Phenyl rings and methoxy groups have been omitted for simplicity. Color code: yellow, Au; dark blue, Ir; orange, P; light green, Cl; red, O; and gray, C. (B) CD spectra of IrAu12-R (red) and IrAu12-S (blue) in MeTHF. (C) CPL spectra of IrAu12-R (red) and IrAu12-S (blue) in MeTHF. (Reproduced from ref. 47 with permission from the Royal Society of Chemistry, Copyright 2023). | ||
Metal-atom substitution is known to enhance the emission characteristics of several metal clusters. Along this direction, Mak et al. reported an exciting example of generating CPL by substituting the Ag12 core of an Ag12Ag32 cluster for an Au12 core (Fig. 9).49 The Au-substituted clusters were synthesized using a co-reduction strategy using Ag and Au salts in the synthesis. They employed a chiral ligand, (R/S)-binaphthyldithiophosphoric acid (abbreviated as R/S-PS). The overall symmetry of both cluster systems remained the same because of the high thermodynamic preference for Au atoms to occupy the inner icosahedral sites as presented in Fig. 9A. The resulting R/S-[S2−@Ag12@S8@Ag32(PS)24]2+ (R/S-Ag12Ag32) clusters did not show any noticeable luminescence (and hence, no CPL) while the R/S-[S2−@Au12@S8@Ag32(PS)24]2+ (R/S-Au12Ag32) exhibited CPL. The maximum gabs value for R/S-Ag12Ag32 (at 520 nm) and R/S-Au12Ag32 (at 390 nm) was approximately ±3.5 × 10⁻³. The maximum glum value for R/S-Au12Ag32 was ∼6 × 10⁻³. The sign of the longest wavelength CD band (at 390 nm) was the same (positive) as that of the CPL band (at 626 nm), as shown in Fig. 9B and C. DFT calculations show that the HOMO of this cluster is mainly localized at the core of S2−@M12@S8, as presented in Fig. 9D and E. The LUMO spans over the Au12/Ag12 and Ag32 shells. The ligand's tail groups do not contribute significantly to HOMO and LUMO. These calculations indicate that the CPL originated from the HOMO–LUMO transitions. This example shows that chiroptical properties such as the CPL of ligand-protected metal clusters can be modulated by metal-atom substitution.
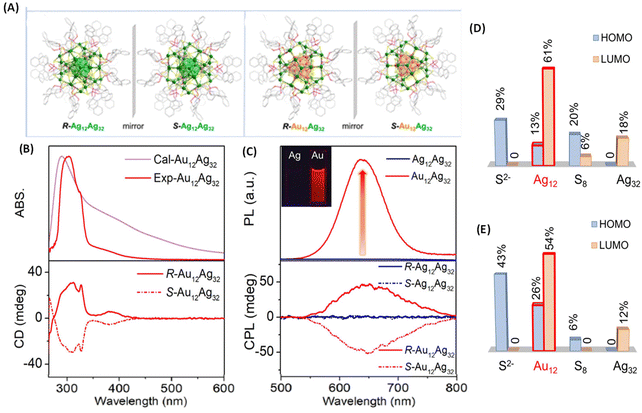 | ||
| Fig. 9 (A) Ball-and-stick representation of the enantiomers of R/S-Ag12Ag32 and R/S-Au12Ag32. For clarity, H atoms have been omitted. Color codes for atoms: green, Ag; orange, Au; yellow, S; pink, P; red, O; gray, C. (B) Experimental and calculated absorption (top) and CD spectra (bottom) of R/S-Au12Ag32 enantiomers in DMAc. (C) Luminescence (top) and CPL spectra (bottom) of Ag12Ag32 and Au12Ag32 in DMAc. (D & E) Histograms showing the contributions of the different shells and central S2− to the HOMO and LUMO for the Ag12Ag32 and Au12Ag32 clusters. (Because of the negligible contributions of the ligands, they are not listed in this histogram.) (Reproduced from ref. 49 with permission from the American Chemical Society, Copyright 2022). | ||
One of the earliest attempts to employ combined CD-CPL investigations of ligand-protected noble metal clusters was by the author,18 with the aim of understanding the origin of PL in an originally achiral cluster, Ag24Au1(DMBT)18 (DMBT = 2,4-dimethylbenzenethiolate). Achiral DMBT ligands were partially exchanged with a chiral bidentate ligand, R/S-1,1′-[binaphthalene]-2,2′-dithiol (R/S-BINAS), and a series of clusters with mixed ligand composition of Ag24Au1(R/S-BINAS)x(DMBT)18–2x (x = number of BINAS ligands) were synthesized. These clusters containing 0–3, 2–5, 3–5, and 4–7 BINAS ligands will be referred to as groups I, II, III, and IV, respectively, for convenience. Here we note that the sign (positive) of the CD band at 645 nm matches with that of the CPL band (see Fig. 10). According to DFT calculations, photoluminescence and CPL activity can be assigned to an excitation transfer from the 632 nm band to its neighbouring low-energy excited states (LUMO/LUMO+1) (see Fig. 10D), which should become the leading decay channel in luminescence and CPL. This suggests that the luminescence and CPL activity of Ag24Au1(R/S-BINAS)x(DMBT)18–2x clusters could originate from these low-lying excited states (LUMO and LUMO+1), where the contribution of the ligand's tail groups (C and H atoms) is lower compared to that in the higher excited states (LUMO+2 and LUMO+3). The nature of the LUMO and LUMO+1 also explains the low values of CPL, as chiral bands are lost in the evolution of these excited states in which electrons reside in the less chiral Ag24Au1S18 framework of the cluster. As the CD response of the bands predicted at longer wavelengths is very weak, we expect a very low CPL signal, in agreement with the experiment. The estimated glum value was 1.5 × 10⁻⁴. Analysis of the trends in the UV/vis, CD, luminescence and CPL spectroscopic changes, in conjunction with DFT calculations, indicates that the photoluminescence in Ag24Au1(DMBT)18 and its chirally functionalized derivatives originates from transitions involving the whole Ag24Au1S18 framework, not merely from the icosahedral Ag12Au1 core. Therefore, these results indicate that the photoluminescence in this cluster system cannot be solely attributed to any one of the structural components, such as the metal core or the protective metal–ligand oligomeric units. This example demonstrates that the ligand-exchange strategy can be a promising way to probe the origin of chiroptical properties of metal clusters.
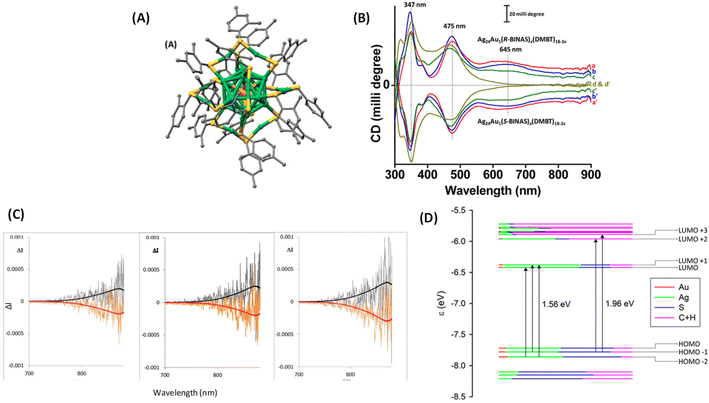 | ||
| Fig. 10 (A) Schematic of the crystal structure of Ag24Au1(DMBT)18. Color codes of atoms in (A): silver (green), gold (orange), sulfur (yellow), and carbon (gray). The H atoms have been omitted for clarity. The structure in (A) was created using the coordinates reported in ref. 50. (B) The CD spectra of the Ag24Au1(R/S-BINAS)x(DMBT)18–2x groups of clusters I (a and a′), II (b and b′), III (c and c′), and IV (d and d′). Traces a–d and a′–d′ correspond to the Ag24Au1(BINAS)x(DMBT)18–2x clusters containing 0–3, 2–5, 3–5 and 4–7 R- and S-BINAS, respectively. Traces a–c (and a′–c′) have been shifted upward (downward) for the sake of clarity. (C) Original CPL spectra of the Ag24Au1(R/S-BINAS)x(DMBT)18−2x group of clusters I (left), II (middle) and III (right). The superimposed black and red traces correspond to the fluorescence spectra recorded on the same instrument: (R) black trace and (S) red trace. (D) Molecular orbital (energy levels) diagram showing the leading contributions to the two lowest transitions at 1.56 eV (795 nm) and 1.96 eV (632 nm). Orbital characteristics in terms of Mulliken analysis of Ag, Au, S, and C + H contributions are given in terms of colors of the level, according to the inset legend. HOMO and LUMO are at −7.60 and −6.33 eV, respectively. (Reproduced from ref. 18 with permission from the American Chemical Society, Copyright 2020). | ||
In another approach involving the use of chiral ligands, Feng et al. used D- and L-tartaric acid (TrA) for enhancing the emission and inducing CPL in Ag9(MBA)9 (MBA = 2-mercaptobenzoic acid). The emission from Ag9(MBA)9 clusters in solution was too weak to be observed at room temperature; however, emission was enhanced after co-crystallization with TrA. Interestingly, the resultant co-crystals exhibited circularly polarized phosphorescence (CPP) (Fig. 11).53 These Ag9 clusters consist of a core of nine Ag(I) ions as revealed by single-crystal X-ray diffraction. These co-crystals showed high glum values of the order of 10−2. This is one of the highest glum values reported for a noble metal cluster; typically such clusters exhibit glum values of the order of 10−3. It is interesting to note that the sign of the CD band at the longest wavelength is negative (for crystals with D-TrA), while the sign of the CPL band is positive. Theoretical calculations were not available for this system. This work shows that co-crystallization involving chiral molecules could be a potential way to generate CPL from metal clusters.
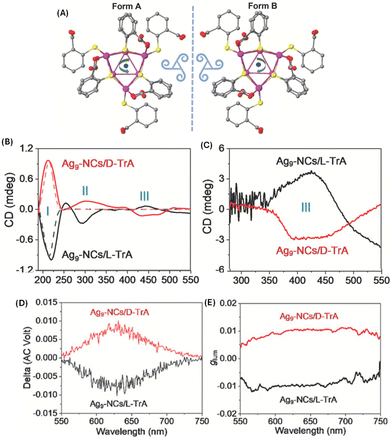 | ||
| Fig. 11 (A) Top view of Ag9-NCs. The peripheral ligands are arranged with a specific direction of rotation, which yields two forms of configuration when viewed from different sides. Insets are drawings of two triskelions. Color labels: purple, Ag; yellow, S; gray, C; and red, O. The hydrogen atoms have been omitted for clarity. The CD spectra of the suspended crystals (B) and dried suspensions (C). The CD spectra of D- and L-TrA (50 mmol L−1 in water) are also given (dotted traces in (B)) for comparison. The CPL spectra (D) and corresponding glum factors (E). (Reproduced from ref. 53 with permission from John Wiley and Sons, Copyright 2022). | ||
It is interesting to note that the CD spectra recorded for the suspended crystals and dried crystals are dramatically different (see Fig. 11). Three distinct CD bands were observed for the suspension while only one band was observed for the dried crystals. Reasons for this difference are unclear; however, the possibility of scattering effects (which will worsen at longer wavelengths) and solvent-induced changes were suggested. The CD band III for the suspension is retained (with significantly higher intensities) even after drying and the sign of this band was also preserved. Linear polarization artefacts (which are some of the most common artefacts in CPL spectroscopy) were ruled out by performing linear dichroism (LD) measurements. However, it is unclear from their description whether these measurements were performed in a suspension or in the dried form. It is important that this be clarified especially because the reported CPL spectra correspond to the vacuum-dried crystals.
Kumar et al. synthesized enantiomeric Cu4I4 clusters (Fig. 12) protected with a chiral ligand D/L-cysteine.51 Thin films of these clusters exhibit CPL activities with a significantly high glum value of 1.22 × 10⁻², which is an order of magnitude higher than the glum of other nanomaterials with chiral emission. The sign of the longest wavelength CD band was the same as that of the CPL band, indicating that the CPL originates from the same electronic transition (Fig. 12B). In order to test the presence of the linear polarization artefacts in the CPL measurements of thin films, the films were rotated and flipped along different angles and no significant changes in the glum values or signs were observed, which indicate the absence of such artefacts. Chen et al. also reported a similar CPL-active Cu4I4 system consisting of a chiral ligand, namely, R/S-3-quinuclidinol.52
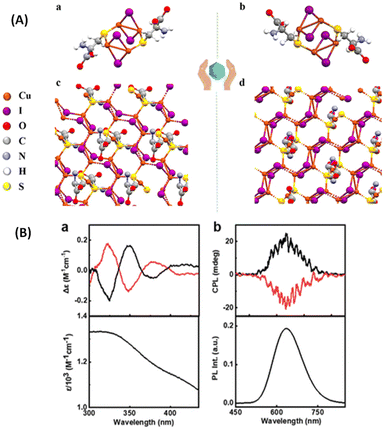 | ||
| Fig. 12 (A) X-ray crystal structure of (a) (D-Cys)2Cu4I4 and (b) (L-Cys)2Cu4I4 nanoclusters and (B) experimental CD spectra (a) along with the corresponding absorption plot, and experimental CPL spectra (b) along with the corresponding luminescence spectra of the aqueous solution of nanoclusters. Black and red traces correspond to spectra collected from (D-Cys)2Cu4I4 and (L-Cys)2Cu4I4 nanoclusters, respectively. (Reproduced from ref. 51 with permission from the Royal Society of Chemistry, Copyright 2023). | ||
One of the ways to induce or enhance the CPL activity is to use a template or a matrix material that can interact with the chiral fluorophore. Lipok et al. used such a strategy wherein a liquid-crystal-like ligand (4-[(16-sulfanylhexadecanoyl)oxy]phenoxy-4-(hexadecyloxy)benzoate) was used for imparting chirality to an achiral cluster, namely, Au25(PET)18, where PET is 2-phenylethanethiolate, as shown in Fig. 13.54 The CPL activity observed from such clusters is associated with high glum values reaching maximally 0.32 and −0.37 for the domains of opposite handedness. These are arguably the highest glum values reported for a noble metal cluster reported so far. This is a surprising result because the PL efficiency of Au25(PET)18 is inherently low. This example shows the promising use of matrices or templates for generating CPL activity from relatively weakly fluorescent or even achiral metal clusters.
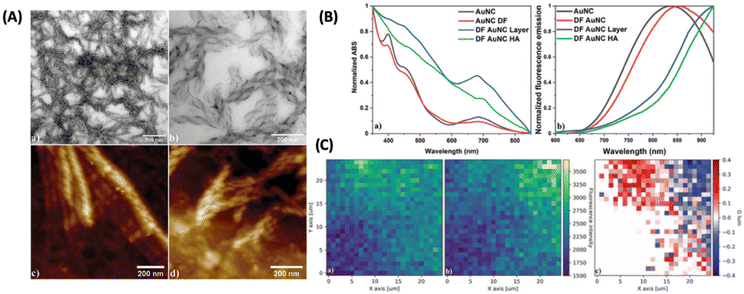 | ||
| Fig. 13 (A) Liquid crystalline OIM helical nanofilaments coated with double-functionalized gold nanoclusters (DF AuNC HA) made using a liquid crystal template imaged under (a and b) TEM and AFM domains with (c) left-handed and (d) right-handed nanofilaments being distinguished. (B) Comparison of (a) normalized absorption and (b) fluorescence emission spectra between unfunctionalized (AuNC) and double-functionalized Au25PET18 nanoclusters (DF AuNC) measured from solutions, dry layers, and helical assemblies (HA). Dry layers of AuNCs (DF AuNC) were prepared in the same manner (heating/cooling procedure) as helical assemblies, but without the OIM template. (C) 2D maps showing (a) left-handed and (b) right-handed circularly polarized luminescence measured from samples with helical assemblies of gold nanoclusters (DF AuNC HA) along with (c) glum calculated for this set of data. Both CPL maps are drawn using the same fluorescence intensity scale. (Reproduced from ref. 54 with permission from John Wiley and Sons, Copyright 2022). | ||
Kumar et al. also reported a six-atom gold cluster/complex, [Au6(D-/L-Cys)8]2+, where D-/L-Cys are enantiomers of cysteine, which is used as a chiral protecting ligand (Fig. 14).55 These clusters exhibited dual photoemission (fluorescence and phosphorescence). Interestingly, the phosphorescence showed circular polarization. The estimated glum values for D-AuNCs/L-AuNCs were −8.1 × 10⁻³/+6.2 × 10−3. The signs of the first CD band and the CPL band were the same, indicating that similar excited state structures are involved in the absorption and emission.
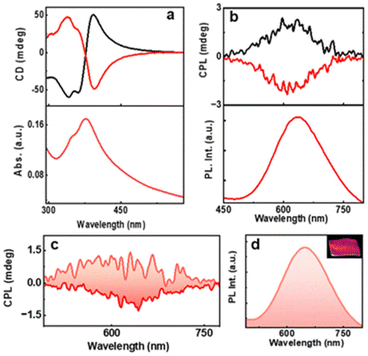 | ||
| Fig. 14 (a) CD and the corresponding UV–visible spectra and (b) CPL and the corresponding PL spectra of aqueous AuNC solution. Black and red traces correspond to D- and L-AuNCs, respectively. (c) CPL and the (d) luminescence plot of the AuNC-incorporated PVA film. The positive and negative CPL plot corresponds to D- and L-AuNC, respectively. The inset in ‘d’ shows a photograph of the film under 365 nm UV illumination. (Reproduced from ref. 55 with permission from the Royal Society of Chemistry, Copyright 2023). | ||
A summary of the CPL-active, ligand-protected metal clusters and their key properties are presented in Table 1. The table shows that glum values of most of the clusters were of the order of 10−3, which is comparable to small organic fluorophores: some of them exhibited glum values that are an order of magnitude higher as well. CD, CPL and DFT studies on the ligand-protected, atomically precise metal clusters presented above revealed that CPL activity in some of the clusters originated from core-localized electronic transitions whereas CPL activity in some other clusters originates from electronic transitions that were delocalized across the metal–ligand interface. The use of inherently chiral ligands seems to be the most common strategy for inducing chirality into the clusters and to induce CPL activity in metal clusters. Ligand exchange of clusters (consisting of achiral ligands) with chiral ligands has also been employed for inducing CPL activity in such clusters. These examples raise the following questions: is the chiral ligand/template necessary for such clusters to exhibit CPL activity? Can an inherently chiral metal cluster (i.e., clusters without any chiral ligands or chiral templates) in solution exhibit CPL activity? Clusters such as Ag29, Au38, etc., could be suitable candidates for such studies. Effects of electron-donating or electron-withdrawing substituents are also to be probed in order to have better clues for enhancing CPL activity in these clusters.
| Cluster | Ligand (chiral/achiral) | |glum| (λmax) | CPL detected in solution/solid state | Ref. |
|---|---|---|---|---|
| Ag29(DHLA)12 | Dihydroxylipoic acid (chiral) | 2 × 10⁻³ (660 nm) | Solution | 41 |
| Ag6(L6/D6) (L/D = Ligands) | (S)-/(R)-4-Isopropylthiazolidine-2-thione (chiral) | 4.42 × 10⁻³ (574 nm) | 44 | |
| [Ag17(R/S-NYA)12](NO3)3 (NYA = Ligand) | N-((R/S)-1-(Naphthalen-4-yl)ethyl)prop-2-yn-1-amine (chiral) | 1.2 × 10⁻³ (745 nm) | Solution | 46 |
| Au3[(R/S)-Tol-BINAP]3Cl | (R)- or (S)-2,2′-bis(di-p-tolylphosphino)-1,1′-binaphthyl (chiral) | 7 × 10⁻³ (583 nm) | Solution | 45 |
| [IrAu12((R,R)/(S,S)-DIPAMP)5Cl2]+ | 1,2-Bis[(2-methoxyphenyl)phenylphosphino]ethane (chiral) | 3 × 10⁻³ (600 nm) | Solution | 47 |
| [Au13((R,R)-DIPAMP)5Cl2]3+ | 1,2-Bis[(2-methoxyphenyl)phenylphosphino]ethane (chiral) | 2 × 10⁻³ (760 nm) | Solution | 47 |
| R/S-[S2−@Ag12@S8@Ag32(PS)24]2+ | (R/S)-Binaphthyldithiophosphoric acid (chiral) | 6 × 10⁻³ (626 nm) | Solution | 49 |
| Ag24Au1(R/S-BINAS)x(DMBT)18–2x | R/S-1,1′-[Binaph-thalene]-2,2′-dithiol (chiral) | 1.5 × 10⁻⁴ (880 nm) | Solution | 18 |
| Ag9(MBA)9 | MBA = 2-mercaptobenzoic acid (achiral) | 1.05 × 10⁻² (630 nm) | Crystals | 53 |
| (D/L-Cys)2Cu4I4 | D/L-Cysteine (chiral) | 1.22 × 10⁻² (625 nm) | Solution | 51 |
| Au25(PET)18 | PET = 2-phenylethanethiol (achiral) | 0.32 (880 nm) | Films | 54 |
| [Au6(D-/L-Cys)8]2+ | D/L-Cysteine (chiral) | 8.1 × 10⁻³ (625 nm) | Solution | 55 |
| [Cu3(R/S-NHCpy)3]2(PF6)6·(CH3CN)7.5 | R/S-NHCpy-H·PF6 (chiral) | 2.1 × 10⁻³ (455 nm) | Solution | 56 |
| [Cu15Ag4(R/S-PEA)12](BF4)5 | N-((R/S)-1-Phenylethyl)prop-2-yn-1-amine (chiral) | 1 × 10⁻³ (608 nm) | Crystals | 57 |
| R/S-(Cu6(iptt)6) | R/S-4-Isopropylthiazolidine-2-thione (chiral) | Not reported, (858 nm) | Solid state | 58 |
| Au5(MPA)5 | MPA = mercaptopropionic acid (with Zn2+ ion and Tween-20- a chiral surfactant) | 13 × 10–3 (443 nm) | Solution | 59 |
| AuAg@AMP (exact composition not known) | AMP = Adenosine 5′-monophosphate (ligand), G-quadruplex (chiral template) | 1.3 × 10⁻² 9 (for L-clusters) and 2.7 × 10⁻² (for R-clusters) (475 nm) | Solution | 60 |
| Cu2I2(BINAP)2 | R/S-BINAP: (R/S)-2,2′-bis(diphenylphosphino)-1,1′-binaphthalene (chiral) | 9.5 × 10⁻³ (543 nm) | Microcrystals dispersed in ethanol | 61 |
| Cu4I4(R/S-3-quinuclidinol)3 | R/S-3-Quinuclidinol (chiral) | 4.3 × 10⁻³ (for R) 4.1 × 10⁻³ (for S) (580 nm) | Powdered crystals | 62 |
Conclusions
This review highlights the importance of chiroptical spectroscopy in understanding the structure–chiroptical property relationships of atomically precise, ligand-protected metal clusters. We mainly focus on the CD and CPL spectroscopy and theoretical simulations to unravel the origins of chirality and photoluminescence in these clusters. The review also provides a timely account of the emergence of atomically precise, ligand-protected noble metal clusters as a new class of CPL-active nanoscale fluorophores.Compared to organic molecules, analysis of emissive excited-state geometries is challenging for these clusters owing to their larger sizes and resulting complex electronic structures and higher computational costs. Many of these clusters exhibit glum values of the order of 10−3, which are comparable to those of organic molecules and several other CPL-active nanoscale fluorophores.
Some of the clusters discussed here exhibited considerable CPL activity in their self-assembled form or in a matrix-embedded form, which is promising in the context of CPL-related applications. However, there is a need to develop better methods to design the CPL-active clusters in order to make use of the CPL activity of these clusters for applications.
Chiroptical measurements of such clusters should be conducted more thoroughly and rigorously in order to test for potential artefacts, and one has to clearly report the control experiments. This is especially important for CPL measurements. Relatively less-explored techniques, such as VCD and ROA, are expected to be employed to greater extents to investigate ligand-protected metal clusters. Efforts towards cluster-assembled materials when combined with chiroptical measurements could create potential materials for chirality-based applications. Another important aspect when considering the chirality of these clusters is the inherent dynamics of their cores and their metal–ligand interfaces. Understanding the roles of these aspects could lead to designing metal clusters with enhanced chiroptical properties. We hope that our review will accelerate the research activities in the chiroptical activity of metal clusters and nanomaterials in general toward achieving better understanding of their structure–property relationships.
Conflicts of interest
There are no conflicts to declare.Acknowledgements
K. R. K. gratefully acknowledges the Science and Engineering Research Board, Govt. of India for the Ramanujan Fellowship (Grant No: RJF/2022/000022). K. R. K. also acknowledges the financial and other means of support from the Indian Institute of Science Education and Research Thiruvananthapuram, India. K. R. K. gratefully acknowledges the constant support of Dr. Reji Varghese, School of Chemistry, Indian Institute of Science Education and Research Thiruvananthapuram in terms of insightful discussions and for providing the laboratory facilities.References
- J. P. Riehl and F. Richardson, Chem. Rev., 1986, 86(1), 1–16 CrossRef CAS.
- J. P. Riehl and F. Richardson, Chem. Rev., 1977, 77(6), 773–792 CrossRef.
- J. Kumar, T. Nakashima and T. Kawai, J. Phys. Chem. Lett., 2015, 6, 3445–3452 CrossRef CAS PubMed.
- Circularly Polarized Luminescence of Isolated Small Organic Molecules, ed. T. Mori, Springer Publications, 2020 Search PubMed.
- C. K. Luk and F. S. Richardson, J. Am. Chem. Soc., 1974, 96, 2006–2009 CrossRef CAS.
- F. Zinna and L. di Bari, Chirality, 2015, 27, 1–13 CrossRef CAS PubMed.
- Y. Zhong, Z. Wu, Y. Zhang, B. Dong and X. Bai, InfoMat, 2023, 5, e12392 CrossRef CAS.
- J. George and K. G. Thomas, J. Am. Chem. Soc., 2010, 132, 2502–2503 CrossRef CAS PubMed.
- M. Golla, S. K. Albert, S. Atchimnaidu, D. Perumal, N. Krishnan and R. Verghese, Angew. Chem., Int. Ed., 2019, 58, 3865–3869 CrossRef CAS PubMed.
- R. Dhall, K. Seyler, Z. Li, D. Wickramaratne, M. R. Neupane, I. Chatzakis, E. Kosmowska, R. K. Lake, X. Xu and S. B. Cronin, ACS Photonics, 2016, 3, 310–314 CrossRef CAS.
- U. Tohgha, K. K. Deol, A. G. Porter, S. G. Bartko, J. K. Choi, B. M. Leonard, K. Varga, J. Kubelka, G. Muller and M. Bala, ACS Nano, 2013, 7, 11094–11102 CrossRef CAS PubMed.
- M. Sujith, E. K. Vishnu, S. Sappati, M. S. O. Hassan, V. Vijayan and K. G. Thomas, J. Am. Chem. Soc., 2022, 144, 5074–5086 CrossRef CAS PubMed.
- S. D. Noja, F. Amato, F. Zinna, L. D. Bari, G. Ragazzon and M. Prato, Angew. Chem., 2022, 134, e202202 Search PubMed.
- I. Chakraborty and T. Pradeep, Chem. Rev., 2017, 117, 8208–8827 CrossRef CAS PubMed.
- R. Jin, C. Zeng, M. Zhou and Y. Chen, Chem. Rev., 2016, 116, 10346–10413 CrossRef CAS PubMed.
- H. Hakkinen, Nat. Chem., 2012, 4, 443–455 CrossRef PubMed.
- G. Longhi, E. Castiglioni, J. Koshoubu, G. Mazzeo and S. Abbate, Chirality, 2016, 28, 696–707 CrossRef CAS PubMed.
- K. R. Krishnadas, L. Sementa, M. Medves, A. Fortunelli, M. Stener, A. Furtsenberg, G. Longhi and T. Burgi, ACS Nano, 2020, 14, 9687 CrossRef CAS PubMed.
- (a) J. V. Rival, P. Maimoona, R. Vinoth, A. M. V. Mohan and E. S. Shibu, ACS Appl. Mater. Interfaces, 2021, 13, 10583–10593 CrossRef CAS PubMed; (b) M. P. Duffy, W. Delauanay, P.-A. Douit and M. Hissler, Chem. Soc. Rev., 2016, 45, 5296–5310 RSC.
- Y. Zhu, J. Guo, X. Qiu, S. Zhao and Z. Tang, Acc. Mater. Res., 2021, 2, 21–35 CrossRef CAS.
- S. Knoppe and T. Bürgi, Acc. Chem. Res., 2014, 47, 1318–1326 CrossRef CAS PubMed.
- J.-H. Huang, X.-Y. Dong, Y.-J. Wang and S.-Q. Zang, Coord. Chem. Rev., 2022, 470, 214729 CrossRef CAS.
- Y. Zhu, J. Guo, X. Qiu, S. Zhao and Z. Tang, Acc. Mater. Res., 2021, 2, 21–35 CrossRef CAS.
- B.-W. Zhou, S. Zhang and L. Zhao, Mater. Chem. Front., 2023, 7, 6389–6410 RSC.
- M.-M. Zhang, K. Li and S.-Q. Zhang, Adv. Opt. Mater., 2022, 8, 1902152 CrossRef.
- Comprehensive Chiroptical Spectroscopy, ed. N. Berova, P. L. Polavarapu, K. Nakamnishi and R. W. Woody, Wiley & Sons Inc., 2012, vol. I and II Search PubMed.
- P. L. Polavarapu, Chiroptical Spectroscopy: Fundamentals and Applications, CRC Press, Taylor and Francis Group, 2019 Search PubMed.
- (a) J. W. Lewis, R. F. Tilton, C. M. Einterz, S. J. Milder, I. D. Kuntz and D. S. Kliger, J. Phys. Chem., 1985, 89, 289–204 CrossRef CAS; (b) M. Schmid, L. Martinez-Fernandez, D. Markovitsi, F. Santoro, F. Hache, R. Improta and P. Changenet, J. Phys. Chem. Lett., 2019, 10, 4089–4094 CrossRef CAS PubMed; (c) J. Meyer-Ilse, D. Akimov and B. Dietzek, Laser Photonics Rev., 2013, 7, 495–505 CrossRef CAS.
- Z. Dominguez, R. Lopez-Rodriguez, E. Alvarez, S. Abbate, G. Longhi, U. Pischel and A. Ros, Chem. – Eur. J., 2018, 24, 12660–12668 CrossRef CAS PubMed.
- H. Tanaka, Y. Inoue and T. Mori, ChemPhotoChem, 2018, 2, 386–402 CrossRef CAS.
- S. T. Duong and M. Fujiki, Polym. Chem., 2017, 8, 4673–4679 RSC.
- G. Longhi, E. Castiglioni, S. Abbatte, F. Lebon and D. A. Lightner, Chirality, 2013, 25, 589–599 CrossRef CAS PubMed.
- R. L. Whetten, J. T. Khoury, M. M. Alvarez, S. Murthy, I. Vezmar, Z. L. Wang, P. W. Stephens, C. L. Cleveland, W. D. Luedtke and U. Landman, Adv. Mater., 1996, 8, 428–433 CrossRef CAS.
- (a) J. Akola, M. Walter, R. L. Whetten, H. Hakkinen and H. Gronbeck, J. Am. Chem. Soc., 2008, 130, 3756–3757 CrossRef CAS PubMed; (b) M. Zhu, C. M. Aikens, F. J. Hollander, G. C. Schatz and R. Jin, J. Am. Chem. Soc., 2008, 130, 5883–5885 CrossRef CAS PubMed.
- T. G. Schaaff and R. L. Whetten, J. Phys. Chem. B, 2000, 104, 2630–2641 CrossRef CAS.
- P. D. Jadzinsky, G. Calero, C. J. Ackerson, D. A. Bushnell and R. D. Kornberg, Science, 2007, 318, 430 CrossRef CAS PubMed.
- I. Dolamic, S. Knoppe, A. Dass and T. Bürgi, Nat. Commun., 2012, 3, 798 CrossRef PubMed.
- S. Knoppe, I. Dolamic, A. Dass and T. Bürgi, Angew. Chem., Int. Ed., 2012, 51, 7589–7591 CrossRef CAS PubMed.
- H. Qian, W. T. Eckenhoff, Y. Zhu, T. Pintauer and R. Jin, J. Am. Chem. Soc., 2010, 132, 8280–8281 CrossRef CAS.
- X.-K. Wan, S.-F. Yuan, Z.-W. Lin and Q.-M. Wang, Angew. Chem., Int. Ed., 2014, 53, 2923–2926 CrossRef CAS PubMed.
- J. Kumar, T. Kawai and T. Nakashima, Chem. Commun., 2017, 53, 1269–1272 RSC.
- H. Yoshida, M. Ehara, U. D. Priyakumar, T. Kawai and T. Nakashima, Chem. Sci., 2020, 11, 2394–2400 RSC.
- Y. Zeng, S. Havenridge, M. Gharib, A. Baksi, K. L. D. M. Weerawardene, A. R. Ziefuß, C. Strelow, C. Rehbock, A. Mews, S. Barcikowski, M. M. Kappes, W. J. Parak, C. M. Aikens and I. Chakraborty, J. Am. Chem. Soc., 2021, 143, 9405–9414 CrossRef CAS PubMed.
- Z. Han, X.-Y. Dong, P. Luo, S. Li, Z.-Y. Wang, S.-Q. Zang and T. C. W. Mak, Sci. Adv., 2020, 6, eaay0107 CrossRef CAS.
- L. Shi, L. Zhu, J. Guo, L. Zhang, Y. Shi, Y. Zhang, K. Hou, Y. Zheng, Y. Zhu, J. Lv, S. Liu and Z. Tang, Angew. Chem., Int. Ed., 2017, 56, 15397–15401 CrossRef CAS PubMed.
- M.-M. Zhang, X.-Y. Dong, Z.-Y. Wang, X.-M. Luo, J.-H. Huang, S.-Q. Zhang and T. C. W. Mak, J. Am. Chem. Soc., 2021, 143, 6048–6053 CrossRef CAS PubMed.
- H. Hirai, T. Nakashima, S. Takano, Y. Shichibu, K. Konishi, T. Kawai and T. Tsukuda, J. Mater. Chem. C, 2023, 11, 3095–3100 RSC.
- H. Hirai, S. Takano, T. Nakashima, T. Iwasha, T. Taketsugu and T. Tsukuda, Angew. Chem., Int. Ed., 2022, 61, e202207290 CrossRef CAS PubMed.
- Y.-J. Kong, J.-H. Hu, X.-Y. Dong, Y. Si, Z.-Y. Wang, X.-M. Luo, H.-R. Li, Z. Chen, S.-Q. Zhang and T. C. W. Mak, J. Am. Chem. Soc., 2022, 144, 19739–19747 CrossRef CAS PubMed.
- M. S. Bootharaju, C. P. Joshi, M. R. Parida, O. F. Mohammed and O. M. Bakr, Angew. Chem., Int. Ed., 2016, 55, 922–926 CrossRef CAS PubMed.
- C. Dutta, S. Maniappan and J. Kumar, Chem. Sci., 2023, 14, 5593–5601 RSC.
- J. Chen, X. Pan, X. Zhang, C. Sun, C. Chen, X. Ji, R. Chen and L. Mao, Small, 2023, 19, 2300938 CrossRef CAS PubMed.
- N. Feng, Z. Wang, D. Sun, P. Sun, X. Xin, X. Cheng and H. Li, Adv. Opt. Mater., 2022, 10, 2102319 CrossRef CAS.
- M. Lipok, P. Obstarczyk, S. Parzyszek, Y. Wang, M. Bagiński, T. Buergi, W. Lewandowski and J. Olesiak-Bańska, Adv. Opt. Mater., 2023, 11, 2201984 CrossRef CAS.
- C. Dutta, S. Maniappan and J. Kumar, Chem. Commun., 2023, 59, 13735–13738 RSC.
- X.-H. Ma, Y. Si, J.-H.- Hu, X.-Y. Dong, G. Xie, F. Pan, Y.-L. Wei, S.-Q.- Zhang and Y. Zhao, J. Am. Chem. Soc., 2023, 145, 25874–25886 CrossRef CAS PubMed.
- M. M. Zhang, K.-K.- Gao, X.-Y. Dong, Y. Si, T. Jia, Z. Han, S.-Q.- Zhang and T. C. W. Mak, J. Am. Chem. Soc., 2023, 145, 22310–22316 CrossRef CAS PubMed.
- Z. Han, Y. Si, X.-Y. Dong, J.-H. Hu, C. Zhang, X.-H. Zhao, J.-W. Yuan, Y. Wang and S.-Q. Zhang, J. Am. Chem. Soc., 2023, 145, 6166–6176 CrossRef CAS PubMed.
- S. Basu, M. P. Bakulic, Z. S. Marcic, V. Bonacic-Koutecky and N. Ambursky, ACS Nano, 2023, 17, 16644–16655 CrossRef CAS PubMed.
- Z. Suo, X. Hou, J. Chen, X. Liu, Y. Liu, F. Xing, Y. Chen and L. Feng, J. Phys. Chem. C, 2020, 124, 21094–21102 CrossRef CAS.
- J.-J. Wang, H.-T. Zhou, J.-N. Yang, L.-Z. Feng, J.-S. Yao, K.-H. Song, M.-M. Zhou, S. Jin, G. Zhang and H.-B. Yao, J. Am. Chem. Soc., 2021, 143, 10860–10864 CrossRef CAS PubMed.
- J. Chen, X. Pan, X. Zhang, C. Sun, C. Chen, X. Ji, R. Chen and L. Mao, Small, 2023, 19, 2300938 CrossRef CAS PubMed.
| This journal is © The Royal Society of Chemistry 2024 |

