 Open Access Article
Cyclic voltammetry activation of magnetron sputtered copper–zinc bilayer catalysts for electrochemical CO2 reduction†
Yang
Fu
,
Shilei
Wei
,
Dongfeng
Du
and
Jingshan
Luo
 *
*
Institute of Photoelectronic Thin Film Devices and Technology, Key Laboratory of Photoelectronic Thin Film Devices and Technology of Tianjin, Ministry of Education Engineering Research Center of Thin Film Photoelectronic Technology, Frontiers Science Center for New Organic Matter, Nankai University, Tianjin 300350, China. E-mail: jingshan.luo@nankai.edu.cn
First published on 22nd November 2023
Abstract
Electrocatalytic CO2 reduction is regarded as one of the most promising strategies for converting CO2 to valuable chemicals or fuels. However, developing efficient catalysts for enhanced multi-carbon production at industrial current densities is still a great challenge. Herein, we report a novel method to prepare bimetallic Cu–Zn catalysts for electrocatalytic CO2 reduction using magnetron sputtering and subsequent electrochemical cyclic voltammetry treatment. Due to the increase of the Cu–Zn interface and the shortening of mass transfer distance, the bimetallic Cu–Zn catalysts showed a faradaic efficiency (FE) of 29.3% for ethanol production at a current density of −250 mA cm−2 when testing in a flow cell. Our work provides a new strategy for the design and synthesis of bimetallic catalysts for electrocatalysis.
Broader contextThe ever-increasing CO2 concentration in the atmosphere causes global warming, which demands disruptive technologies to balance the carbon cycle. Electrocatalytic CO2 reduction with renewable electricity is regarded as one of the most promising strategies for converting waste CO2 to valuable chemicals or fuels. However, its wide application still faces many challenges, and one of the most significant challenges is developing efficient and selective catalysts, especially for generating multi-carbon products at industrial current densities. In this work, we report a novel and facile method to prepare bimetallic Cu–Zn catalysts for electrocatalytic CO2 reduction, which demonstrate a high faradaic efficiency (FE) of 29.3% for ethanol production at a current density of −250 mA cm−2 in a flow cell. |
Introduction
The greenhouse gas CO2 can be converted to valuable chemicals or fuels through electrochemical CO2 reduction using renewable electricity. It provides a sustainable way for the artificial carbon cycle to reduce CO2 emissions and store renewable energy and possesses significant economic value.1 Due to the high added value, multi-carbon (C2+) products have great potential for further industrial applications. However, the lack of efficient and highly active catalysts for C2+ products during CO2 reduction hinders their industrial applications. Among the C2+ products, ethanol as one of the most important organic chemicals can not only be directly used as a liquid fuel, but also be mixed with gasoline to make the fuel relatively cleaner and more environmentally friendly.2 In addition, ethanol possesses high energy density, high economic value, and ease of storage and transportation.3 However, the production of ethanol products during CO2 reduction still presents a low level.4–7 Therefore, based on the recent research progress, it is necessary to design new high-performance catalysts towards ethanol to meet the future industrialization requirements.It is generally believed that CO is the key intermediate for the generation of C2+ products. Therefore, introducing metals with high CO selectivity, such as Au, Ag, and Zn, into Cu-based catalysts has become an effective method to promote C2+ products.8–12 Metal Zn, as a non-precious metal, can be used as the catalyst for the reduction of CO2 to CO.13–15 It can significantly lower the cost when used as the CO2 reduction catalyst on a large scale due to its natural abundance, compared to noble metals, such as Au and Ag. The enhanced selectivity of C2+ products during CO2 reduction is attributed to the bimetallic tandem effect: Cu and Zn serve as different active sites, respectively. In other words, the generated CO molecules on Zn would diffuse onto the surface of Cu for further reduction to C2+ products. Therefore, it is considered that the activity and selectivity of C2+ products can be effectively improved by constructing Cu-based bimetallic catalysts. However, the different design of the bimetallic catalysts leads to disparate performance. For example, Wang's group prepared an active Zn–Cu bimetallic catalyst by the physical vapor deposition (PVD) method. They showed that the synergistic effect of bimetallic sites could stabilize the carboxyl intermediate and produce CO with high selectivity.16 G. Yin et al. reported an alloy of Cu and Zn which can selectively convert CO2 to HCOOH in aqueous media at room temperature. The high selectivity of HCOOH production can probably explain that the chemisorption strengths of CO2* and CO* radicals were regulated to an ideal condition for the CO2 to HCOOH conversion.17 By constructing the Cu–Zn bimetallic catalyst with a phase-separated structure, Wan et al. found that the faradaic efficiency of CO could reach 94%.18 Meanwhile, Dan et al. prepared a series of oxide-derived CuxZn catalysts for CO2 reduction which could adjust the C2+ selectivity of ethanol and ethylene products by changing the Zn content in the CuxZn catalysts. When applying a potential of −1.05 V, the maximum FE of ethanol on the Cu4Zn catalyst reached 29.1%.19 From the above, different bimetallic catalyst designs can have different reaction mechanisms and product selectivities. Nevertheless, the above methods prevent the direct application of the catalysts to gas diffusion layer (GDL) electrodes, resulting in low potential for future industrial applications. Hence, a new method with a facile process is demanded for constructing bimetallic catalysts on GDL electrodes.
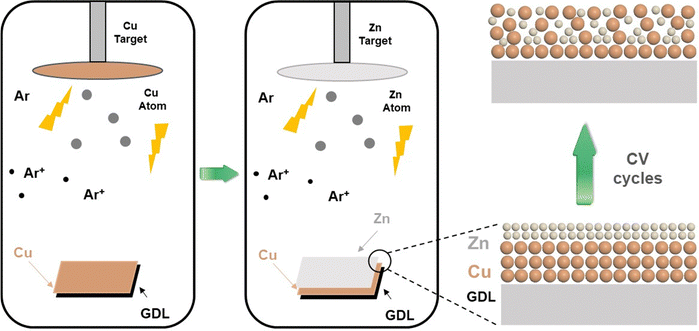
In this work, we prepared Cu–Zn bimetallic catalysts first by magnetron sputtering Cu and Zn layers on the GDL sequentially, followed by a simple electrochemical cyclic voltammetry treatment. The preparation process of the bimetallic catalysts does not require binders and the as-fabricated Cu–Zn bimetallic catalysts can adjust the preference of C–C coupling to ethanol generation in the C2 product during CO2 reduction. When tested in a flow cell, the catalysts showed a high FE of 29.3% for ethanol production at a current density of −250 mA cm−2. Furthermore, the FE ratio of ethanol and ethylene products is 2.1. In brief, the enhanced selectivity of ethanol in C2 products was achieved through a simple and easily scalable synthesis of Cu–Zn catalysts.
Results and discussion
Characterization of catalysts
The schematic diagram of the preparation process of catalysts is shown in Fig. 1. First, the morphology and structure of the as-synthesized Cu prepared by magnetron sputtering on the GDL are shown in Fig. 2a and d. It was observed that the sputtered Cu was in the shape of nanoparticles with a relatively uniform size and a diameter between 100 nm and 200 nm. For the Cu–ZnGDE bimetallic catalyst, as shown in Fig. 2b, a layer of zinc was coated by magnetron sputtering on the sputtered copper, thus forming a layered Cu–Zn bimetallic structure on the GDL. The enlarged SEM images (Fig. 2e) showed that the surface of each copper nanoparticle presents a rough particle morphology with small size. For the Cu–Zn bimetallic catalysts after cyclic voltammetry treatment (Cu–ZnCVGDE), the SEM images with different magnifications are depicted in Fig. 2c and f. The morphological characterization showed that the densely coated nanoparticles on the surface with smaller diameters disappeared while loose and porous nanopores appeared, which indicated that the morphology of the Cu–Zn-CV-GDE catalyst after CV treatment was reconstructed.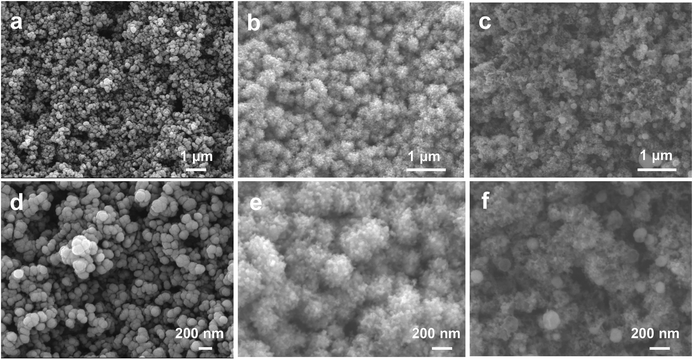 | ||
| Fig. 2 (a) SEM image and (d) enlarged SEM image of the Cu-GDE. (b) SEM image and (e) enlarged SEM image of Cu–Zn-GDE. (c) SEM image and (f) enlarged SEM image of Cu–Zn-CV-GDE. | ||
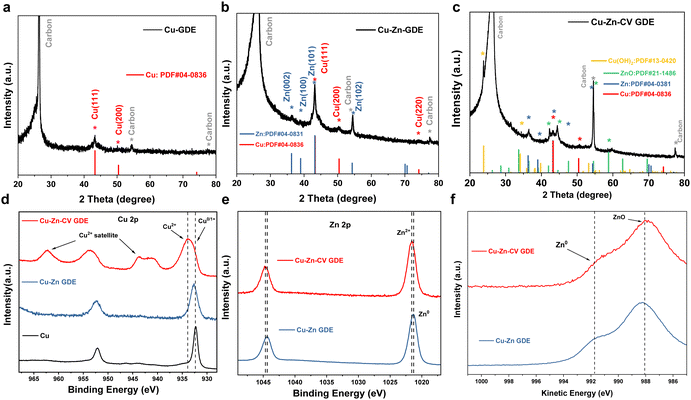
The phase and crystal structures of the three catalysts were characterized by XRD. The XRD pattern of the Cu-GDE catalyst in Fig. 3a showed the peaks located at 43.3° and 50.4°, which were assigned to the Cu (111) and Cu (200) crystal facets. The XRD patterns of the Cu–Zn-GDE catalyst (Fig. 3b) showed that the main components of the Cu–Zn-GDE catalyst were metal elements of copper and zinc. The XRD pattern of the Cu–Zn-CV-GDE catalyst is shown in Fig. 3c. The diffraction peaks located at 23.8° and 34.1° were assigned to Cu(OH)2 (JCPDS# 13-0420), and the diffraction peaks located at 44.6°, 47.6° and 58.7° belonged to ZnO (JCPDS# 21-1486). The XRD results indicated that the Cu–Zn-GDE catalyst was partially oxidized after CV treatment while the Cu and Zn metal elements still existed. In addition, the surface electronic structure and chemical valence state of the catalysts were further characterized by X-ray photoelectron spectroscopy (XPS). The XPS spectrum of Cu 2p is shown in Fig. 3d, and the peaks are located at around 932.4 eV belonging to the 0 or +1 valence state of Cu. Combined with the XRD results, it further showed that the main component of the Cu-GDE catalyst is metallic Cu. Meanwhile, for the Cu 2p XPS spectrum of the Cu–Zn-GDE catalyst, it is demonstrated that the main valence state of Cu was 0 or +1 valence state. Meanwhile, for the Cu–Zn-CV-GDE catalyst, the oxidation state of Cu appeared, indicating that after the CV treatment, part of Cu was oxidized. For the Zn 2p XPS spectra of Cu–Zn-GDE and Cu–Zn-CV-GDE catalysts, as shown in Fig. 3e, due to the similar binding energies of Zn and ZnO, it is difficult to distinguish the valence state of Zn only by the XPS spectrum of Zn 2p.13,20,21 Therefore, the Zn LMM Auger spectra were used to further determine the valence state of Zn. As depicted in Fig. 3f, both Zn0 and Zn2+ valence states on the surface of the Cu–Zn-GDE catalyst were observed. It was worth noting that for the surface of the Cu–Zn-CV-GDE catalyst, the peak at 991.8 eV of electron binding energy belongs to the zero-valence state, which indicates that after the cyclic voltammetry treatment of the Cu–Zn-GDE catalyst, Zn was partially oxidized to the +2 valence state.
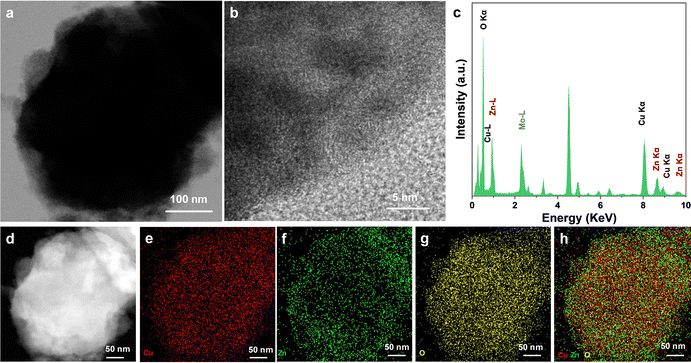
Furthermore, the structural characterization and elemental analysis of the catalysts were performed by TEM and EDS mapping as shown in Fig. S1 (ESI†). The characterization results showed that both the signals of Cu and Zn elements were detected. It was worth noting that from the results of the mapping results, the main element was Cu while the distribution of Cu and Zn elements was not uniform. Among them, the Zn element was mainly distributed on the side of the Cu element. The Mo–L peak in the EDS spectrum results from the molybdenum mesh substrate used for the TEM test. In addition, the small amount of O element was also detected, which was the result of the inevitable oxidation of Zn in air. For the preparation of the Cu–Zn-CV-GDE catalyst, Cu–Zn-GDE samples were used as the working electrode to execute cyclic voltammetry treatment in a standard three-electrode system in 0.1 M KHCO3 solution and the cyclic voltammetry curve is shown in Fig. S2 (ESI†). In principle, the cyclic voltammetry treatment was a process of dissolution and redeposition of ions. During the dissolution and redeposition process of the Cu–Zn-GDE electrode, the structure will be reconstructed, and the number of Cu–Zn interfaces will increase. Similarly, TEM and HRTEM analyses were performed to characterize the structure of the Cu–Zn-CV-GDE catalyst. As shown in Fig. 4a and b, the obvious core–shell structure and lattice fringes were not observed, indicating the poor crystallinity of the catalyst. Additionally, the Cu, Zn and O elements in the Cu–Zn-CV-GDE catalyst were observed through HRTEM and EDS-mapping (Fig. 4c–h) analyses. Significantly, the relatively uniform distribution of the Cu and Zn elements was observed. Meanwhile, according to the SEM images of the Cu–Zn-CV-GDE catalysts above, the hierarchical structure of Cu and Zn elements was disrupted indicating that the distribution of Cu and Zn elements in the catalyst was changed after CV treatment.
Electrochemical CO2 reduction performance
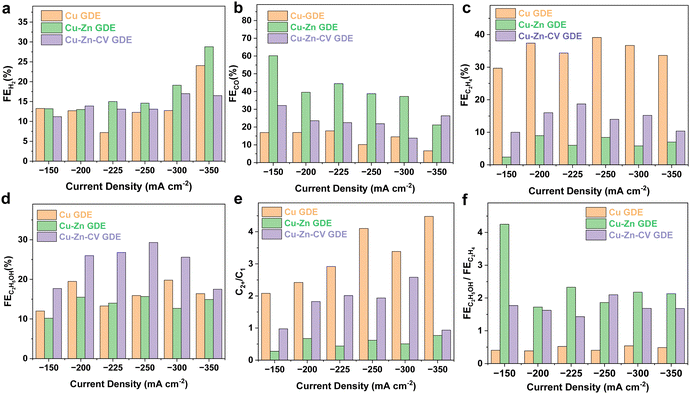
To demonstrate the potential for future industrial applications, the electrocatalytic CO2 reduction performance of the catalysts was evaluated in a flow cell. The electrolyte was 1.0 M KOH aqueous solution. When tested in a flow cell, the concentration of CO2 on the surface of the catalyst would become higher, and the transport distance was shortened. The CO2 reduction reaction occurred on the electrode–electrolyte interface and was not limited by the mass transport of dissolved CO2. Thus, the performance was significantly enhanced. Meanwhile, the KOH electrolyte solution was used to suppress the HER and improve the conductivity of the electrolyte.22,23 In order to eliminate the effect of the catalyst on products during CO2 reduction, the as-synthesized catalyst of Cu–Zn-CV GDE was examined under a N2 atmosphere at a current density of −150 mA cm−2. As shown in Fig. S3 (ESI†), it can be observed that the products were almost all hydrogen indicating that only the HER reaction occurred under a N2 atmosphere. As shown in Fig. 5, the catalysts of Cu-GDE, Cu–Zn-GDE layered bimetallic catalyst, and Cu–Zn-CV-GDE were tested in the current density range from −150 to −350 mA cm−2. As depicted in Fig. 5a, the FE of H2 by comparing the three catalysts showed the same level, demonstrating that these catalysts have similar low HER performance in a flow cell. Meanwhile, the CO production of the Cu-GDE catalyst (Fig. 5b) showed the lowest compared with that of the Cu–Zn-GDE and Cu–Zn-CV-GDE catalysts. For the Cu–Zn-GDE catalyst, CO was the main product and the maximum FE(CO) reached was as high as 60.2% at a current density of −150 mA cm−2. Owing to the low binding energy between CO and Zn, and the electrocatalytic reduction of CO2 occurred on the three-phase interface of gas–liquid–solid, CO was first generated on the sputtered Zn. The CO generation at the Zn sites was subsequently released while the excessive CO generated is not enough to be quickly consumed by Cu. As the current density increases, the FE of CO decreases gradually, and the minimum FE of CO reached 21.2% at a current density of −350 mA cm−2. For the Cu–Zn-CV-GDE catalyst, the FE of CO was about 20% in the given current density range, demonstrating that CO reduction was reduced after CV treatment. This is due to the increase of the interface of Cu–Zn in the Cu–Zn-CV-GDE catalyst, which leads to the CO generation on the Zn surface and it can be quickly transferred to the Cu surface. It is well known that CO is an intermediate of C2 products during the CO2 reduction reaction,24,25 which in turn facilitated the formation of C2 products in the next step. Therefore, this showed the reduction of CO products macroscopically. As shown in Fig. 5c, ethylene was the main reduction product during CO2 reduction of the Cu-GDE catalyst, and the maximum FE(C2H4) was as high as 39.1% at a current density of −250 mA cm−2. Meanwhile, for the Cu–Zn-GDE catalyst, the selectivity of ethylene was greatly suppressed, and the maximum FE was only 9%, which was due to the fewer Cu–Zn interfaces, resulting in the inefficient utilization of CO after the desorption of CO generated on the Zn surface and thus leading to a less C2H4 production. For the Cu–Zn-CV-GDE catalyst, the maximum FE(C2H4) reached 18.7% at a current density of −225 mA cm−2. Moreover, this showed that FE(C2H4) was above 10% at the given current densities. The above results indicated that the formation of ethylene was greatly suppressed in the presence of Zn, while ethanol was the most dominant liquid product. Therefore, we compared the FE of ethanol of the catalysts. As shown in Fig. 5d, for the Cu–Zn-CV-GDE catalyst, the FE(ethanol) was significantly higher than those of the Cu-GDE and Cu–Zn-GDE catalysts, and the maximum FE reached 29.3% at a current density of −250 mA cm−2. Notably, although the formation of ethylene was greatly suppressed for the Cu–Zn-GDE catalyst, the FE of ethanol did not show a significant decrease. The results indicated that the activity and selectivity of ethanol in C2 product formation by the C–C coupling step during CO2 reduction was enhanced owing to the addition of Zn. In contrast, ethylene production was inhibited. To further explore the effect of the presence of Zn on the selectivity of CO2 reduction to ethanol, we analyzed the FE ratio of C2+ products to C1 products. As shown in Fig. 5e, for the Cu-GDE catalyst, the maximum FE ratio of the C2+ product to C1 product reached 4.1 at a current density of −350 mA cm−2. For the Cu–Zn-CV-GDE catalyst, the maximum FE ratio of the C2+ products to the C1 products was up to 2.6, which was smaller than that of the Cu-GDE catalyst and larger than that of the Cu–Zn-GDE catalyst. The above results showed the greatest tendency to promote C2+ products of pure Cu-GDE during the CO2 reduction process, while the addition of Zn greatly improved the production of CO, which in turn affected the selectivity of C2+ products. Ethylene and ethanol, as the most important C2+ products, are observed in Fig. 5f, and the FE ratio of ethanol to ethylene effectively improved after the addition of Zn. The results indicated that the addition of Zn adjusted the relative proportion of C2H5OH and C2H4 production in C2+ products. We have also evaluated the CO2 performance of Cu-GDE under the same CV treatment. As shown in Fig. S4 (ESI†), the ethylene product seems enhanced after CV treatment and the maximum FE(C2H4) could reach 42.9% at a current density of −250 mA cm−2. However, the ethanol production shows a relatively lower level at different current densities after the same CV treatment and the highest FE(C2H5OH) only reach 23.1% at a current density of −200 mA cm−2. Furthermore, we compared the performance of the Cu–Zn-CV-GDE catalyst for ethanol production with the recent work in the literature, as shown in Table S1 (ESI†). To further explore and analyze the mechanism of ethanol production in the electrocatalytic CO2 reduction process of the catalyst, the electrocatalytic CO2 reduction performance of only metal Zn was verified in a flow cell. Furthermore, the morphology and structure of the sputtered Zn on the GDL were characterized by SEM and TEM analyses. As depicted in Fig. S5a and b (ESI†), it can be observed that the uniform nanostructure on the electrode was composed of nanoparticles with the size ranging from 10 to 50 nm. The TEM and HRTEM analyses (Fig. S5c and d, ESI†) demonstrated that a lattice fringe width of 0.21 nm belonged to Zn (101) crystal facets. Moreover, the Zn LMM spectrum was used to explore the valence state of the Zn electrode. As shown in Fig. S5e (ESI†), it can be demonstrated that the Zn composition prepared on the GDL was the metallic Zn. Subsequently, the electrocatalytic CO2 reduction performance of the prepared Zn-GDE electrode was tested in a flow cell. As shown in Fig. S6 (ESI†), H2 and CO were the main products. The maximum FE of CO reached 75% at a current density of −200 mA cm−2 while slightly decreased at a current density of 250 mA cm−2. In conclusion, the Zn-GDE catalyst can provide enough CO to meet the demand of the Cu–Zn bimetallic tandem effect.When catalysts are used for future practical applications, in addition to high activity and selectivity, long-term stability is also a key indicator for evaluating the performance of the catalysts. Therefore, as shown in Fig. S7a (ESI†), the electrochemical stability of the as-fabricated Cu–Zn-CVGDE sample was examined in 1.0 M KOH aqueous solution at a current density of −250 mA cm−2. In Fig. S7b (ESI†), it was observed that ethanol production remained stable after 4 hours and the FE of ethanol still able to remain 27%. In addition, the morphology and structure of the Cu–Zn-CV-GDE catalyst after the CO2 reduction reaction were also explored by SEM, TEM and XPS. As shown in Fig. S8 (ESI†), the nanoparticles with the porous morphology were still maintained. The chemical composition of the catalyst was analyzed through TEM and EDS-mapping (Fig. S9, ESI†); it showed that the nanoparticles were composed of Cu, Zn, and O elements, and the element distribution was relatively uniform. When the catalyst was tested in a flow cell and the electrolyte of KOH solution, it was difficult to avoid the oxidation of the catalyst during the subsequent transfer process in air. Hence, the existence of O element might be caused by various factors, which could not verify the stable existence of oxides in the catalyst during the CO2 reduction process. Notably, only the in situ analysis can truly detect the valence state change of the catalyst during the CO2 reduction reaction. As shown in the XPS spectrum of Cu2p in Fig. S10 (ESI†), the peak located at 935.0 eV was assigned to the valence state of Cu(II) while the peak at 932.5 eV belongs to the 0 or +1 valence state of Cu. The +2 valence components of Cu after the reaction were greatly reduced compared to the catalyst before the reaction. The increasing components in the low-valence state of Cu also indicated that the valence state of the catalyst was reduced to a low-valence state after the CO2 reduction reaction. For the XPS spectrum of the Zn element after reduction, the coexistence of the 0 and +2 valence states of the Zn element can be observed. Compared to the catalyst before the reaction, the proportion of the zero-valence state component of Zn showed an improvement. In conclusion, the structure and Cu, Zn elements of the Cu–Zn-CV-GDE catalyst remained relatively stable after the CO2 reduction reaction.
Mechanism
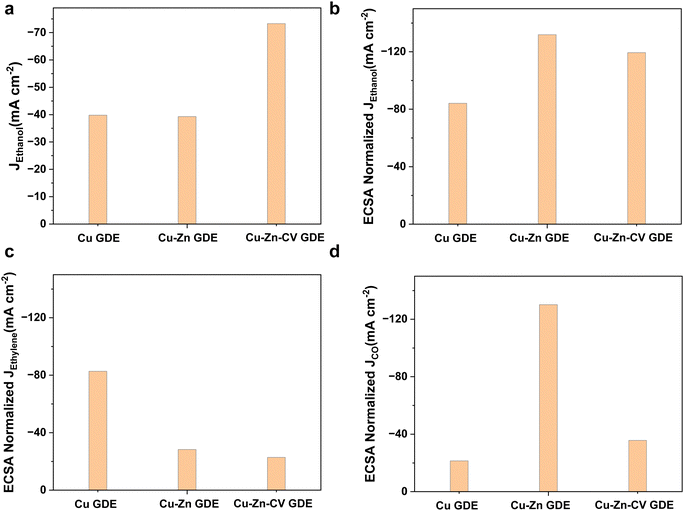
Then, we compared the electrochemically active areas of Cu-GDE, Cu–Zn-GDE and Cu–Zn-CV-GDE catalysts by measuring the electrochemical double-layer capacitance of the three electrodes. The electrochemical double-layer capacitance of the electrodes was measured by the cyclic voltammetry test at different scan rates. As shown in Fig. S11 (ESI†), the electric double-layer capacitance (Cdl) of Cu-GDE was 0.473 mF cm−2 and the Cdl of Cu–Zn-GDE was 0.298 mF cm−2. However, the Cdl of Cu–Zn-CV-GDE was greatly enhanced and reached 0.614 mF cm−2. After sputtering Zn on the Cu, the porosity of the Cu catalyst reduced resulting in the lower electric double layer capacitance. Nonetheless, the interface contact was increased when the dissolution and redeposition of ions in the Cu–Zn-GDE catalyst after CV treatment. Therefore, it showed the largest electrochemical double-layer capacitance among the three catalysts indicating that the most abundant active sites were exposed which might explain efficient ethanol production during the CO2 reduction process.Next, the intrinsic activities of three catalysts for CO2 reduction to ethanol were analyzed through the ECSA normalized ethanol current densities. As shown in Fig. 6a, both the Cu-GDE and Cu–Zn-GDE showed similar partial current densities (close to −40 mA cm−2) for ethanol formation, while for Cu–Zn-CV-GDE catalysts, the partial current density was −73.3 mA cm−2. ECSA-normalized partial current densities of ethanol production are shown in Fig. 6b. The Cu–Zn-GDE catalyst exhibited the largest ECSA-normalized partial current density (−131.9 mA cm−2) of ethanol production. Meanwhile, the ECSA normalized ethanol current density of the Cu–Zn-CV-GDE catalyst is −119.4 mA cm−2. It was close to the Cu–Zn-GDE catalyst, and the Cu-GDE catalyst showed the smallest ECSA normalized current density of −84.1 mA cm−2. Therefore, the Cu–Zn-GDE catalyst showed the highest intrinsic activity for ethanol production, while the limited surface area was not enough to provide sufficient active sites, and the Zn layer hindered the interaction between CO2 and active sites, thereby limiting the activity and selectivity of ethanol production. As shown in Fig. 6c, for the intrinsic activity of ethylene production of Cu-GDE, the ECSA normalized partial current density of ethylene was −82.7 mA cm−2, which was much larger than those of the Cu–Zn-GDE catalyst (−28.3 mA cm−2) and Cu–Zn-CV-GDE catalyst (−22.8 mA cm−2), indicating that the addition of Zn decreased the intrinsic activity of ethylene formation and increased the activity and selectivity of ethanol production. For the Cu–Zn-GDE catalyst, as depicted in Fig. 6d, the ECSA normalized partial current density of CO was −130.2 mA cm−2, which was much higher than those of Cu-GDE (−21.4 mA cm−2) and Cu–Zn-CV-GDE catalysts (−35.7 mA cm−2), demonstrating the largest intrinsic activity for CO production. However, for the Cu–Zn-GDE catalyst, the higher activity of CO formation on the Cu surface did not affect the catalytic activity of ethylene. The result seemed inconsistent with the previous view that higher CO coverage contributed to the enhancement of ethylene production.26 We speculated that there were more effective ways to promote ethanol production other than the increased CO coverage to promote the activity and selectivity of C2+ products. According to Dan et al.'s previous work,27 they prepared a layer of ZnO on the surface of CuO nanowires by atomic layer deposition (ALD). By using in situ Raman spectroscopy, they observed that the generation of *CH2 or *CH3 intermediates on Cu coupled with CO generated on Zn was the key step for the formation of ethanol.
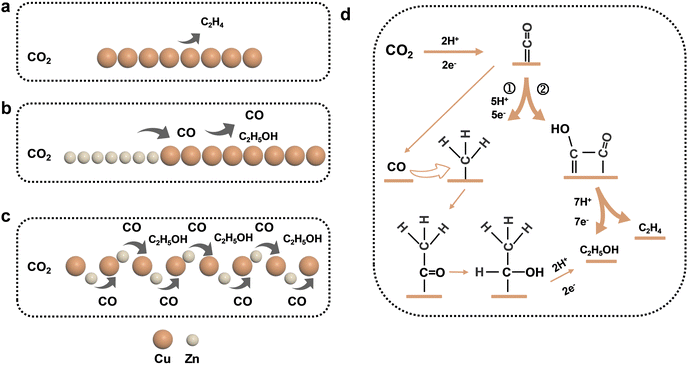
Therefore, combined with previous studies, we proposed the possible pathways of the Cu–Zn-CV-GDE catalyst to generate ethanol during CO2 reduction which was shown in Fig. 7. Ethylene was the main product for the pure Cu-GDE during CO2 reduction. For Cu–Zn-GDE, a layer of Zn generated excess CO during CO2 reduction, and the high CO coverage was conducive to C–C coupling. Meanwhile, the surface layer of Zn also hindered the contact between CO2 gas and the catalyst, so the specific surface area was not enough to provide sufficient active sites, thus limiting the activity and selectivity of the catalyst for ethanol production. Moreover, due to the increase of the interface between Cu and Zn, the mass transfer distance between electrons and protons was shortened. As shown by path① (Fig. 7d), CO was generated by Zn in CO2 reduction and it was directly overflowed to Cu. Then, the *CH2 or *CH3 intermediates were coupled to produce *COCH3 intermediates, which were further hydrogenated for ethanol production except for path step②. Therefore, it was explained that the addition of Zn changed ethylene and ethanol production. In conclusion, ethanol production was effectively enhanced during the electrocatalytic CO2 reduction of C2+ products through a simple and scalable synthesis and processing of Cu–Zn layered bimetallic catalysts.
Conclusions
We have developed a facile method to prepare Cu–Zn bimetallic catalysts on the gas diffusion layer using magnetron sputtering and electrochemical cyclic voltammetry treatment for electrochemical CO2 reduction. The CV treatment created abundant copper–zinc interfaces and provided enough active sites during the CO2 reduction. As a result, the as-prepared catalyst demonstrated a high FE of 29.3% for ethanol production and a high ratio of 2.1 for ethanol and ethylene products at an industrial current density of −250 mA cm−2 in a flow cell. Our work not only provides ideas and references for preparing bimetallic catalysts for electrochemical CO2 reduction, but also demonstrates a low-cost catalyst with great potential for industrial applications.Conflicts of interest
Jingshan Luo and Yang Fu have filed a patent application regarding the catalyst preparation and its application reported in this work.Acknowledgements
J. L. acknowledges the funding support from the National Key Research and Development Program of China (Grant No. 2019YFE0123400 and 2022YFE0114800), the Tianjin Distinguished Young Scholars Fund (Grant No. 20JCJQJC00260), and the Major Science and Technology Project of Anhui Province (202203f07020007).References
- Z. Zhang, L. Bian, H. Tian, Y. Liu, Y. Bando, Y. Yamauchi and Z.-L. Wang, Small, 2022, 18, 2107450 CrossRef CAS PubMed.
- A. Keskin and M. Gürü, Energy Sources, Part A, 2011, 33, 2194–2205 CrossRef CAS.
- M. Jouny, W. Luc and F. Jiao, Ind. Eng. Chem. Res., 2018, 57, 2165–2177 CrossRef CAS.
- M. Perfecto-Irigaray, J. Albo, G. Beobide, O. Castillo, A. Irabien and S. Pérez-Yáñez, RSC Adv., 2018, 8, 21092–21099 RSC.
- J. Albo, D. Vallejo, G. Beobide, O. Castillo, P. Castaño and A. Irabien, ChemSusChem, 2017, 10, 1100–1109 CrossRef CAS PubMed.
- J. Albo, M. Perfecto-Irigaray, G. Beobide and A. Irabien, J. CO2 Util., 2019, 33, 157–165 CrossRef CAS.
- S. Castro, J. Albo and A. Irabien, J. Chem. Technol. Biotechnol., 2020, 95, 1876–1882 CrossRef CAS.
- Y. Song, J. R. C. Junqueira, N. Sikdar, D. Öhl, S. Dieckhöfer, T. Quast, S. Seisel, J. Masa, C. Andronescu and W. Schuhmann, Angew. Chem., Int. Ed., 2021, 60, 9135–9141 CrossRef CAS PubMed.
- C. G. Morales-Guio, E. R. Cave, S. A. Nitopi, J. T. Feaster, L. Wang, K. P. Kuhl, A. Jackson, N. C. Johnson, D. N. Abram, T. Hatsukade, C. Hahn and T. F. Jaramillo, Nat. Catal., 2018, 1, 764–771 CrossRef CAS.
- A. N. Kuhn, H. Zhao, U. O. Nwabara, X. Lu, M. Liu, Y.-T. Pan, W. Zhu, P. J. A. Kenis and H. Yang, Adv. Funct. Mater., 2021, 31, 2101668 CrossRef CAS.
- W. Zhu, K. Zhao, S. Liu, M. Liu, F. Peng, P. An, B. Qin, H. Zhou, H. Li and Z. He, J. Energy Chem., 2019, 37, 176–182 CrossRef.
- Y. C. Li, Z. Wang, T. Yuan, D.-H. Nam, M. Luo, J. Wicks, B. Chen, J. Li, F. Li, F. P. G. de Arquer, Y. Wang, C.-T. Dinh, O. Voznyy, D. Sinton and E. H. Sargent, J. Am. Chem. Soc., 2019, 141, 8584–8591 CrossRef CAS PubMed.
- J. Rosen, G. S. Hutchings, Q. Lu, R. V. Forest, A. Moore and F. Jiao, ACS Catal., 2015, 5, 4586–4591 CrossRef CAS.
- D. L. T. Nguyen, M. S. Jee, D. H. Won, H. Jung, H.-S. Oh, B. K. Min and Y. J. Hwang, ACS Sustainable Chem. Eng., 2017, 5, 11377–11386 CrossRef CAS.
- X. Zong, Y. Jin, Y. Li, X. Zhang, S. Zhang, H. Xie, J. Zhang and Y. Xiong, J. CO2 Util., 2022, 61, 102051 CrossRef CAS.
- L. Wang, H. Peng, S. Lamaison, Z. Qi, D. M. Koshy, M. B. Stevens, D. Wakerley, J. A. Zamora Zeledón, L. A. King, L. Zhou, Y. Lai, M. Fontecave, J. Gregoire, F. Abild-Pedersen, T. F. Jaramillo and C. Hahn, Chem Catal., 2021, 1, 663–680 CrossRef CAS.
- G. Yin, H. Abe, R. Kodiyath, S. Ueda, N. Srinivasan, A. Yamaguchi and M. Miyauchi, J. Mater. Chem. A, 2017, 5, 12113–12119 RSC.
- L. Wan, X. Zhang, J. Cheng, R. Chen, L. Wu, J. Shi and J. Luo, ACS Catal., 2022, 12, 2741–2748 CrossRef CAS.
- D. Ren, B. S.-H. Ang and B. S. Yeo, ACS Catal., 2016, 6, 8239–8247 CrossRef CAS.
- W. Luo, Q. Zhang, J. Zhang, E. Moioli, K. Zhao and A. Züttel, Appl. Catal., B, 2020, 273, 119060 CrossRef CAS.
- W. Luo, J. Zhang, M. Li and A. Züttel, ACS Catal., 2019, 9, 3783–3791 CrossRef CAS.
- S. Ma, M. Sadakiyo, R. Luo, M. Heima, M. Yamauchi and P. J. A. Kenis, J. Power Sources, 2016, 301, 219–228 CrossRef CAS.
- F. P. García de Arquer, C.-T. Dinh, A. Ozden, J. Wicks, C. McCallum, A. R. Kirmani, D.-H. Nam, C. Gabardo, A. Seifitokaldani, X. Wang, Y. C. Li, F. Li, J. Edwards, L. J. Richter, S. J. Thorpe, D. Sinton and E. H. Sargent, Science, 2020, 367, 661–666 CrossRef PubMed.
- Y. Hori, A. Murata and R. Takahashi, J. Chem. Soc., Faraday Trans. 1, 1989, 85, 2309–2326 RSC.
- G. Chen, C. Xu, X. Huang, J. Ye, L. Gu, G. Li, Z. Tang, B. Wu, H. Yang, Z. Zhao, Z. Zhou, G. Fu and N. Zheng, Nat. Mater., 2016, 15, 564–569 CrossRef CAS PubMed.
- Y. Huang, A. D. Handoko, P. Hirunsit and B. S. Yeo, ACS Catal., 2017, 7, 1749–1756 CrossRef CAS.
- D. Ren, J. Gao, L. Pan, Z. Wang, J. Luo, S. M. Zakeeruddin, A. Hagfeldt and M. Grätzel, Angew. Chem., Int. Ed., 2019, 58, 15036–15040 CrossRef CAS PubMed.
Footnote |
| † Electronic supplementary information (ESI) available. See DOI: https://doi.org/10.1039/d3ey00204g |
| This journal is © The Royal Society of Chemistry 2024 |

