 Open Access Article
Heterogeneous interactions and transformations of dibasic esters with indoor relevant surfaces†
Cholaphan
Deeleepojananan
 a,
Jinxu
Zhou
b and
Vicki H.
Grassian
 *a
*a
aDepartment of Chemistry and Biochemistry, University of California San Diego, La Jolla, California 92093, USA. E-mail: vhgrassian@ucsd.edu
bDepartment of Nanoengineering and Materials Science and Engineering Program, University of California San Diego, La Jolla, California 92093, USA
First published on 26th January 2024
Abstract
Dibasic esters (DBEs) have recently become emerging indoor air pollutants due to their usage as a solvent for mixtures of paints and coatings. In this study, we explored the adsorption/desorption kinetics, heterogeneous interactions, and chemical transformations of dimethyl succinate (DMS, C6H10O4), a component of commercial dibasic ester solvent mixtures, on indoor relevant surfaces using transmission Fourier-transform infrared (FTIR) spectroscopy and high-resolution mass spectrometry (HRMS). Silica (SiO2) and rutile (TiO2) were used as proxies for window glass, and an active component in paint and self-cleaning surfaces, respectively. FTIR spectroscopy of these surfaces shows that DMS can interact with SiO2 and TiO2 through hydrogen bonding between the carbonyl oxygen and surface hydroxyl groups. The kinetics show fast adsorption of DMS onto these surfaces followed by slow desorption. Furthermore, new products formed observed on TiO2 surfaces in addition to molecularly adsorbed DMS. In particular, succinate (C5H7O) was observed binding to the surface in a bidentate chelating coordination mode as indicated by the appearance of νas(COO−) and νs(COO−) bands in the FTIR spectra. These absorption bands grow in intensity over time and the resulting product remains strongly adsorbed on the surface. The formation of adsorbed succinate is a result of a reaction with DMS on Lewis acid sites of the TiO2 surface. Overall, the slow desorption of these adsorbed species indicates that indoor surfaces can become long term reservoirs for dibasic esters and their surface products. Moreover, in the presence of ∼50% relative humidity, water displaces outer layers of adsorbed DMS on SiO2 and TiO2, while having no impact on the more strongly bound surface species.
Environmental significanceDibasic esters are emerging indoor air pollutants emitted from coatings of furniture and building materials, contributing to reduced indoor air quality. Indoor environments exhibit a high surface-to-volume ratio compared to outdoors, serving as a sink for the uptake of gas-phase species. Fast surface adsorption and slow desorption of dibasic esters, as well as surface-mediated reactions, are observed on indoor relevant surfaces. These findings suggest that the adsorption of dibasic esters on indoor surfaces create a potential long-term source of exposure that may impact human health. |
Introduction
Indoor air pollutants have direct impact on indoor air quality and human health.1–3 The sources of indoor air pollutants can either come from episodic sources such as human occupancy and activities, or from permanent sources such as building and furnishing materials.4–7 Human exposure to indoor air pollutants can be detrimental due to associated health risks of respiratory and cardiovascular diseases.8–10 In turn, environmental regulation guidelines have been recommended by federal agencies to minimize human exposure to chemicals that raise health and safety concerns.11–13 Several chemicals have been banned or phased out, such as ozone-depleting compounds and traditional solvents, e.g., benzene, xylene, and toluene.14,15 As a result, more environmentally friendly chemical alternatives have been implemented in various industries.16,17Industrial solvents play a significant role in various formulations, especially in the painting and coating industries.14,17 Among the commonly used industrial solvents, dibasic esters (DBEs) are a solvent mixture of dimethyl succinate (C6H10O4, DMS), dimethyl glutarate (C7H12O4, DMG), and dimethyl adipate (C8H14O4, DMA), which are considered “green solvents” due to their lower toxicity, faster biodegradability, non-ozone depleting capability, and lower odor compared to their traditional counterparts.17–20 Despite these environmentally friendly conditions, exposure to high concentrations of DBEs can have adverse health effects. Previous studies of DBE exposure in mice have revealed a degeneration of olfactory system by lesions of olfactory epithelium, thereby affecting the sense of smell.21,22 Currently, the Michigan Department of Environmental Quality, United States, has recommended an indoor DBE threshold of 1 μg m−3.13 However, DBEs were recently detected in new apartments in Beijing at concentrations ranging from 4 to 41 μg m−3,23 which exceeded the abovementioned recommended screening level. Qiu et al. identified that the DBEs were emitted from coatings of wooden furniture and suspended in the indoor air for days.23 An extremely high level of indoor dibasic esters emitted from a polyurethane floor was also reported in a primary school in Germany at a level of 1000–2000 μg m−3 and was found to be associated with the sick building syndrome.24 Despite DBEs are emerging indoor air pollutants, there are currently only few indoor chemistry studies and reports on these pollutants available. Volatile and semi-volatile organic compounds emitted from static indoor materials such as furniture and building are considered long-term sources of indoor air pollutants that contribute significantly to the total indoor volatile organic compounds (VOCs).25–27 Therefore, it is essential to continue exploring emerging pollutants and their associated chemical transformations within the indoor environments.
Indoor surfaces have been shown to act as sinks for indoor air pollutants.28–30 In particular, surfaces can, in some cases, be relatively nonreactive, such as SiO2 (window glass), or reactive, such as rutile (TiO2, paint and self-cleaning surfaces). Nonreactive surfaces generally show weaker interactions with surfaces, including hydrogen (H) bonding interactions.31–34 On the other hand, reactive surfaces are able to more strongly adsorb different chemical species to the surface or chemically transform adsorbed species, resulting in new surface-bound or gas-phase products.35,36 In this study, adsorption/desorption of DMS, the most volatile component of commercial dibasic ester mixtures, with different surfaces and the impact of relative humidity dependence on DMS adsorption were explored. We show that DMS has fast adsorption kinetics and molecularly interacts with hydroxylated SiO2, but then slowly desorbs from the surface. In the case of TiO2, surface reactions lead to surface and gas-phase products, succinate and methanol, respectively, from DMS. Thus, this study shows the importance of understanding the interactions of chemical contaminants with different surfaces present in indoor environments in order to better understand their fate and transformations as well as possible human exposures.5
Methods
Transmission FTIR spectroscopy (T-FTIR)
Approximately 8 mg of hydroxylated SiO2 (Aerosil OX50, Degussa) and 10 mg of TiO2 (rutile, 99+%, Sigma Aldrich) particles were pressed onto one half of a rectangular tungsten grid (Thermo Fisher Scientific), leaving the other half blank for gas-phase measurements. The grid containing the sample was secured on nickel jaws of a sample holder. More details of this t-FTIR setup were previously published elsewhere.31 In short, the sample holder was inserted and screwed tightly to a stainless-steel infrared cell equipped with BaF2 windows (310 ± 3 mL). The cell was connected to a glass mixing chamber (1329 ± 2 mL) with multiple valves for gas injection and two absolute pressure transducers (MKS Instruments, Inc., 10 and 1000 Torr). A two-stage vacuum system consisting of a turbomolecular pump (Agilent TwisTorr 74 FS) and a mechanical pump (Adixen Pascal 2010 SD) was employed for gas evacuation. DMS vapor was acquired from the headspace of liquid DMS (99%, Acros Organics) that was previously degassed by three freeze–pump–thaw cycles. After overnight evacuation, the SiO2 and TiO2 samples were heated at 400 °C and 200 °C, respectively, for 4 h to remove trace organic contaminants. Prior to DMS exposure, background single beam spectra of both gas and particle phases were collected with the OMNIC software over the range from 650 to 4000 cm−1 at a resolution of 4 cm−1 over 300 scans. Following background collections, a desired pressure of gaseous DMS was introduced to the mixing chamber and exposed to the sample in the infrared cell. Single beam spectra for kinetic studies were collected continuously with 20 scans for 30 min using OMNIC Macro Basic software. An equilibrium pressure was then recorded at 30 min of exposure, and the system was evacuated afterwards. All single beam spectra were reprocessed with their respective backgrounds to obtain absorbance spectra. Surface absorbance spectra were acquired by subtracting reprocessed spectra with their corresponding gas-phase spectra.For relative humidity (RH) studies, a SiO2 or TiO2 surface was first exposed to DMS under dry conditions (<1% RH) for 30 min. The desired pressure of water vapor was then injected into the reaction chamber for 1 min before the infrared cell valve was closed for another 1 h to allow the sample to interact with the water vapor. The equilibrium pressure recorded at a time of closing the infrared cell was used to calculate for the % RH.
High-resolution mass spectrometry (HRMS)
For HRMS experiments, the samples used for t-FTIR were carefully removed from the tungsten grid using a microspatula and transferred to a clean capped plastic vial. 750 μL of a 1![[thin space (1/6-em)]](https://www.rsc.org/images/entities/char_2009.gif) :
:![[thin space (1/6-em)]](https://www.rsc.org/images/entities/char_2009.gif) 1 methanol/acetonitrile (HPLC grade, Fisher Scientific) solvent mixture was added to the plastic vial. The extracted samples were stored at −24 °C for no more than one week prior to HRMS analysis. The stability of the frozen samples was tested earlier by comparing the HRMS patterns with freshly extracted samples, confirming no degradation. All samples were sonicated for 1 h and centrifuged for another hour. The supernatants were then removed and transferred to a clean amber glass vial for HRMS analysis. All glassware was combusted at 500 °C overnight and all plastic vials were cleaned with Milli-Q water (18.2 MΩ cm) and sonicated in methanol prior to use to remove organic contaminants. Sample aliquots were analyzed with a Thermo Orbitrap Elite Hybrid Linear Ion Trap-Orbitrap MS in positive-ion mode. The heated electrospray ionization (HESI) source was operated at 100 °C with the ESI capillary set to a voltage of 3.50 kV at 350 °C. Mass spectra with a range of 50–500 Da were acquired. Chemical formulae were assigned with a mass tolerance of <5 ppm with the following element ranges: 12C, 0–50; 1H, 0–100; 16O, 0–10; 23Na, 0–2.
1 methanol/acetonitrile (HPLC grade, Fisher Scientific) solvent mixture was added to the plastic vial. The extracted samples were stored at −24 °C for no more than one week prior to HRMS analysis. The stability of the frozen samples was tested earlier by comparing the HRMS patterns with freshly extracted samples, confirming no degradation. All samples were sonicated for 1 h and centrifuged for another hour. The supernatants were then removed and transferred to a clean amber glass vial for HRMS analysis. All glassware was combusted at 500 °C overnight and all plastic vials were cleaned with Milli-Q water (18.2 MΩ cm) and sonicated in methanol prior to use to remove organic contaminants. Sample aliquots were analyzed with a Thermo Orbitrap Elite Hybrid Linear Ion Trap-Orbitrap MS in positive-ion mode. The heated electrospray ionization (HESI) source was operated at 100 °C with the ESI capillary set to a voltage of 3.50 kV at 350 °C. Mass spectra with a range of 50–500 Da were acquired. Chemical formulae were assigned with a mass tolerance of <5 ppm with the following element ranges: 12C, 0–50; 1H, 0–100; 16O, 0–10; 23Na, 0–2.
Results and discussion
DMS adsorption on SiO2
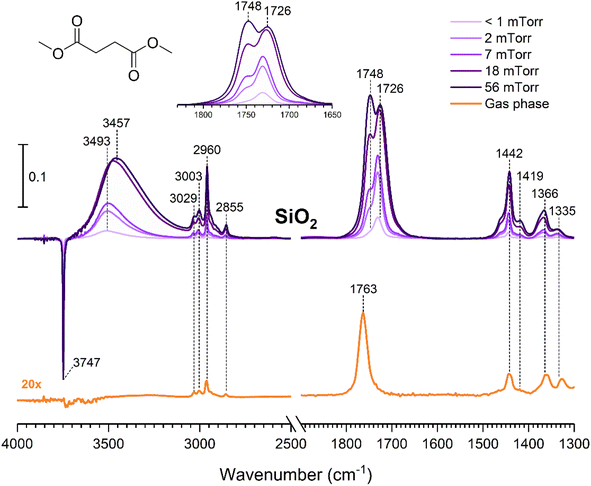
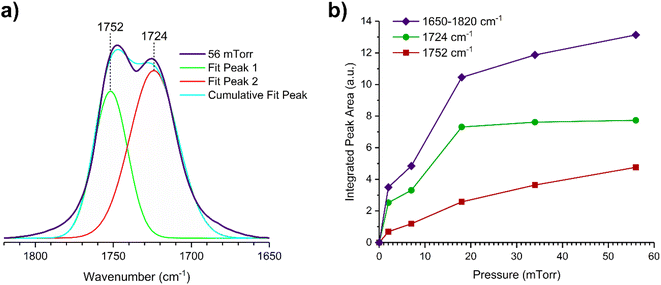
The gas-phase spectrum of DMS (Fig. 1) collected at an equilibrium pressure of 56 mTorr at 296 K shows different absorption bands in several spectral regions as follows: from 2855 to 3029 cm−1 associated with the aliphatic C–H stretching modes; region around 1763 cm−1 for the C![[double bond, length as m-dash]](https://www.rsc.org/images/entities/char_e001.gif) O stretching mode; and spectral region from 1335 to 1442 cm−1 associated with methyl and methylene bending modes (Table 1). After the hydroxylated SiO2 surface was exposed to DMS for 30 min at different equilibrium pressures (Fig. 1), the corresponding infrared spectra exhibited a negative sharp peak due to a loss of isolated silanol groups at 3747 cm−1, and a redshifted broad band centered around 3500 cm−1. This phenomenon is due to H-bonding interactions between the –OH terminations of SiO2 and the adsorbed molecules.31,32,34 Carbonyl bands of DMS adsorbed on SiO2 appear as a doublet at 1726 and 1748 cm−1, revealing a shift to lower vibrational frequencies relative to the carbonyl band of the gas-phase DMS centered at 1763 cm−1. This doublet feature suggests that there may be different interactions occurring and potentially even multilayer adsorption occurred between DMS and the SiO2 surface.37,38 The 1726 cm−1 band starts growing from <1 mTorr of DMS exposure and becomes saturated at 18 mTorr, which is an indication of first-layer adsorption where the surface interacting sites are fully occupied.39 The 1748 cm−1 band then appears initially at 2 mTorr as a shoulder and continues to grow with increasing pressure as a result of adsorbed DMS in a second layer. This multilayer adsorption can also be explained by deconvoluting the C
O stretching mode; and spectral region from 1335 to 1442 cm−1 associated with methyl and methylene bending modes (Table 1). After the hydroxylated SiO2 surface was exposed to DMS for 30 min at different equilibrium pressures (Fig. 1), the corresponding infrared spectra exhibited a negative sharp peak due to a loss of isolated silanol groups at 3747 cm−1, and a redshifted broad band centered around 3500 cm−1. This phenomenon is due to H-bonding interactions between the –OH terminations of SiO2 and the adsorbed molecules.31,32,34 Carbonyl bands of DMS adsorbed on SiO2 appear as a doublet at 1726 and 1748 cm−1, revealing a shift to lower vibrational frequencies relative to the carbonyl band of the gas-phase DMS centered at 1763 cm−1. This doublet feature suggests that there may be different interactions occurring and potentially even multilayer adsorption occurred between DMS and the SiO2 surface.37,38 The 1726 cm−1 band starts growing from <1 mTorr of DMS exposure and becomes saturated at 18 mTorr, which is an indication of first-layer adsorption where the surface interacting sites are fully occupied.39 The 1748 cm−1 band then appears initially at 2 mTorr as a shoulder and continues to grow with increasing pressure as a result of adsorbed DMS in a second layer. This multilayer adsorption can also be explained by deconvoluting the C![[double bond, length as m-dash]](https://www.rsc.org/images/entities/char_e001.gif) O band from 1650 to 1820 cm−1, which reveals two overlapping peaks centered at 1724 and 1752 cm−1 (Fig. 2a). The area under the two peaks was integrated and plotted as a function of pressure (Fig. 2b). The integrated area of the deconvoluted 1724 cm−1 peak (green) appears to reach plateau after 18 mTorr of DMS exposure as an indication of complete monolayer coverage. Meanwhile, the integrated area of the peak at 1752 cm−1 (red) grows linearly with increasing pressure, supporting the evidence of multilayers of condensed DMS. Since DMS contains two carbonyl groups in its structure, both of the carbonyl oxygens may interact with hydrogens from the surface silanol groups as illustrated in Fig. 3. The exposed SiO2 sample was removed from the cell after 1 h of evacuation, extracted, and analyzed by HRMS. The HRMS patterns of products extracted from SiO2 (Fig. 6a) clearly show only one peak at m/z 169.05 (C6H10O4), confirming the relatively weak interactions of DMS on SiO2 surfaces.
O band from 1650 to 1820 cm−1, which reveals two overlapping peaks centered at 1724 and 1752 cm−1 (Fig. 2a). The area under the two peaks was integrated and plotted as a function of pressure (Fig. 2b). The integrated area of the deconvoluted 1724 cm−1 peak (green) appears to reach plateau after 18 mTorr of DMS exposure as an indication of complete monolayer coverage. Meanwhile, the integrated area of the peak at 1752 cm−1 (red) grows linearly with increasing pressure, supporting the evidence of multilayers of condensed DMS. Since DMS contains two carbonyl groups in its structure, both of the carbonyl oxygens may interact with hydrogens from the surface silanol groups as illustrated in Fig. 3. The exposed SiO2 sample was removed from the cell after 1 h of evacuation, extracted, and analyzed by HRMS. The HRMS patterns of products extracted from SiO2 (Fig. 6a) clearly show only one peak at m/z 169.05 (C6H10O4), confirming the relatively weak interactions of DMS on SiO2 surfaces.
| Mode | Experimental vibrational frequency (cm−1) | Literature vibrational frequency (cm−1) | |
|---|---|---|---|
| SiO2 | TiO2 | ||
| ν(MO–H, isolated) | 3747 | 3640 | 3742 (SiO2),31,40 3656 (TiO2)39 |
| ν(O–H) | 3450–3500 | 3340 | |
| ν(C–H, sp3) | 2855–3029 | 2852–3026 | |
ν(C![[double bond, length as m-dash]](https://www.rsc.org/images/entities/char_e001.gif) O, free ester) O, free ester) |
1748 | 1745 | 1740–1750![[thin space (1/6-em)]](https://www.rsc.org/images/entities/char_2009.gif) 37,38 37,38 |
ν(C![[double bond, length as m-dash]](https://www.rsc.org/images/entities/char_e001.gif) O, interacted ester via H-bonding) O, interacted ester via H-bonding) |
1726 | 1726 | 1730![[thin space (1/6-em)]](https://www.rsc.org/images/entities/char_2009.gif) 37,38 37,38 |
ν(C![[double bond, length as m-dash]](https://www.rsc.org/images/entities/char_e001.gif) O, interacted ester via metal bonding) O, interacted ester via metal bonding) |
N/A | 1684 | |
| ν as(COO−) | N/A | 1548 | 1540–1590![[thin space (1/6-em)]](https://www.rsc.org/images/entities/char_2009.gif) 37,38 37,38 |
| ν s(COO−) | N/A | 1451 | 1420–1460![[thin space (1/6-em)]](https://www.rsc.org/images/entities/char_2009.gif) 37,38 37,38 |
| δ(CH2, CH3) | 1335–1442 | 1323–1440 | 1300–1440![[thin space (1/6-em)]](https://www.rsc.org/images/entities/char_2009.gif) 41 41 |
| ν(C–O–C, ester) | N/A | 1170–1248 | |
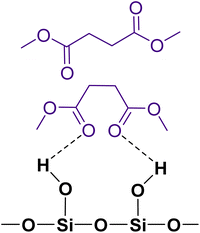 | ||
| Fig. 3 Possible adsorption binding modes of DMS to a hydroxylated SiO2 surface, including a monolayer of hydrogen bonded DMS and DMS in a second layer. | ||
Surface adsorption and desorption kinetics of DMS on SiO2
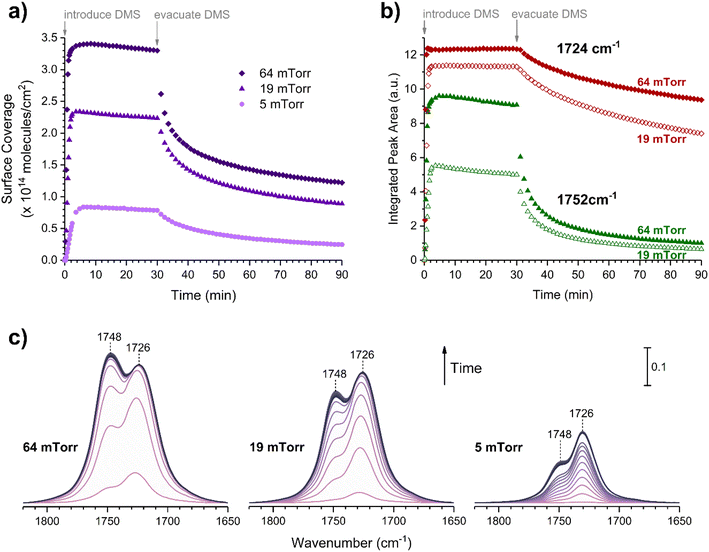
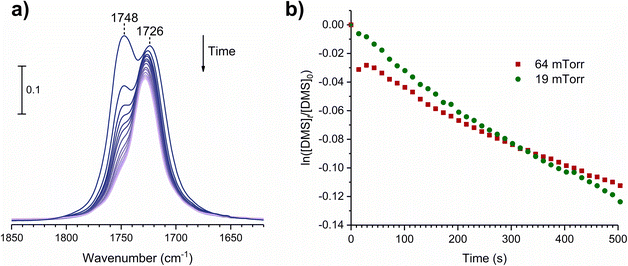
Volumetric measurements were used to determine the DMS coverage by introducing a known pressure of gaseous DMS to the reaction chamber of a known volume with and without the presence of SiO2 particles to determine solely the amount of DMS adsorbed on the surface without wall loss effects. The difference of equilibrium pressures between the two experiments along with integrated peak areas over the spectral region from 2800 to 3070 cm−1 were then converted to surface coverages of DMS molecules on SiO2. A detailed procedure of volumetric measurements was reported elsewhere.31Fig. 4a shows the temporal evolution of DMS coverage on the SiO2 surface at 5, 19, and 64 mTorr. The equilibrium was achieved within a few minutes of DMS exposure. Temporal adsorption FTIR spectra are displayed in Fig. 4c. At 5 mTorr, the monolayer coverage was not yet complete although the band corresponding to condensed DMS appeared at 1748 cm−1. At 19 and 64 mTorr, DMS interacted with all available sites, which completed the first layer of adsorbed DMS as indicated by the saturation of the band at 1726 cm−1. The remaining gas-phase DMS then condensed onto the surface and formed multilayers that continuously grew depending on equilibrium pressures. After 30 min, the chamber was evacuated, and the desorption of DMS from the SiO2 surface exhibited rapid decay (Fig. 4a). To understand the desorption kinetics of DMS on SiO2 surfaces, the C![[double bond, length as m-dash]](https://www.rsc.org/images/entities/char_e001.gif) O bands from 1650 to 1820 cm−1 of the FTIR spectra obtained from the evacuated SiO2 surfaces following exposures to DMS at 19 and 64 mTorr were deconvoluted and integrated as shown in Fig. 4b. Due to the full surface coverage of DMS in the first monolayer, the integrated peak areas at 1724 cm−1 did not significantly differ between 19 and 64 mTorr. On the other hand, the integrated peak areas at 1748 cm−1 strongly depended on pressures. Using first-order desorption kinetics for the DMS monolayer on SiO2, the desorption rate constant can be determined:
O bands from 1650 to 1820 cm−1 of the FTIR spectra obtained from the evacuated SiO2 surfaces following exposures to DMS at 19 and 64 mTorr were deconvoluted and integrated as shown in Fig. 4b. Due to the full surface coverage of DMS in the first monolayer, the integrated peak areas at 1724 cm−1 did not significantly differ between 19 and 64 mTorr. On the other hand, the integrated peak areas at 1748 cm−1 strongly depended on pressures. Using first-order desorption kinetics for the DMS monolayer on SiO2, the desorption rate constant can be determined:where [A]t is the concentration of an adsorbate (molecules cm−2) at time t (s), [A]0 is the concentration of an adsorbate at equilibrium (t = 0), and kdes is the first-order desorption rate constant (s−1). A spectral desorption evolution of DMS on SiO2 and a linear correlation between ln([DMS]t/[DMS]0) vs. time are reported (Fig. 5) for the two trails of DMS exposure on SiO2 surfaces in the first 500 s. The slope of the linear portion designates the kdes, which is determined to be (1.9 ± 0.4) × 10−4 s−1 (R2 = 0.99). First-order desorption rate constants of other common indoor VOCs on SiO2 surfaces have been previously reported as summarized in Table 2. DMS exhibits a faster desorption rate compared to other oxygenated VOCs containing a hydroxyl group, including alpha-terpineol, dihydromyrcenol, and linalool.32 However, DMS desorbs slower from SiO2 compared to carvone,34 which also contains a carbonyl group, and limonene,32 which is one of the most abundant indoor VOCs. In addition to a 1 h evacuation, some amount of DMS stayed adsorbed on the SiO2 surface after overnight (>20 h) evacuation following a 30 min exposure of the surface to 5 mTorr of DMS (see ESI Fig. S1†), suggesting a slow desorption process that may play a role on indoor air chemistry on longer timescales.
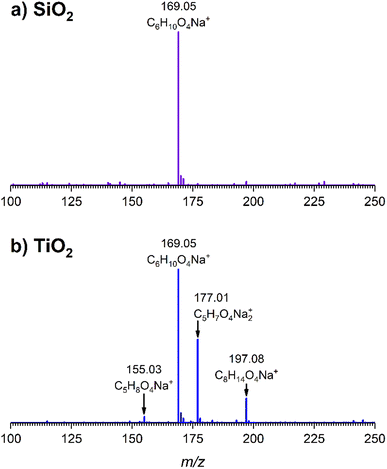 | ||
| Fig. 6 High-resolution mass spectra of extracted products from (a) SiO2 and (b) TiO2 surfaces following a 30 min DMS exposure followed by 1 h evacuation. Ions are shown as sodium adducts. | ||
DMS adsorption on TiO2
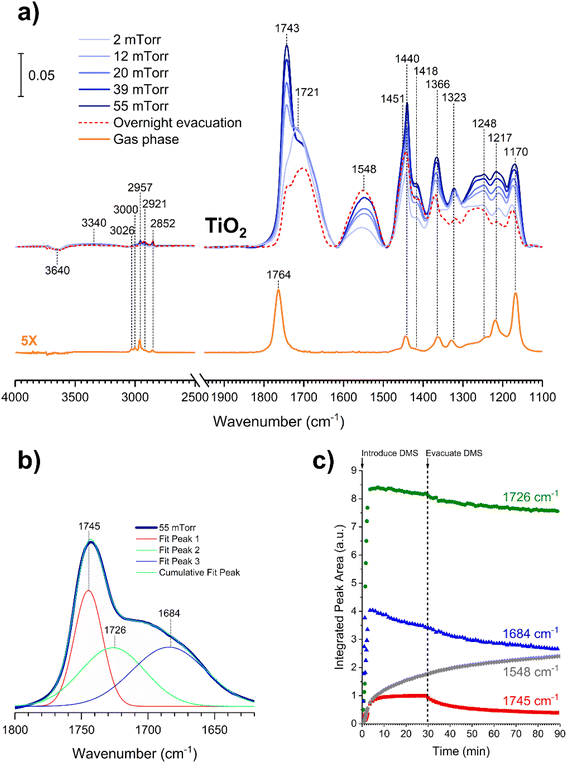
In contrast to the DMS adsorption on SiO2 surfaces, the adsorption of DMS on TiO2 shows clear signs of stronger interactions on the surface as well as reactions of DMS. After 30 min of exposure, the gas-phase FTIR spectrum (Fig. 7a) exhibited similar C–H stretching and bending modes to those of the gas-phase DMS spectrum with respect to SiO2 (Fig. 1). The C![[double bond, length as m-dash]](https://www.rsc.org/images/entities/char_e001.gif) O stretching mode was present at 1764 cm−1 as well as the C–O–C stretching modes from 1170 to 1248 cm−1. TiO2-surface spectra after a 30 min DMS exposure at multiple equilibrium pressures (Fig. 7a) differed from those of SiO2 (Fig. 1). However, there were a few similarities, including a loss of isolated hydroxyl groups indicated by a negative peak at 3640 cm−1 and an appearance of a redshifted broad band due to H-bonding around 3340 cm−1. A carbonyl stretching band from 1690 to 1750 cm−1 was also observed with an apparent shoulder due to adsorbed DMS. The shape of the carbonyl band, however, was different from the appearance of the band for SiO2 that clearly showed the split of two peaks corresponding to interacted and free carbonyl groups. To investigate, this carbonyl band on TiO2 was curve fit and deconvoluted using Origin Pro 2023 software. This revealed three distinct peaks as shown in Fig. 7b. The first two fitted peaks centered at 1745 and 1726 cm−1 exhibited similar vibrational frequencies to those of the carbonyl peaks on SiO2 (Fig. 2a), suggesting that these peaks were due to the multilayer physisorption of DMS on TiO2via H-bonding interactions between the carbonyl oxygen atoms of DMS and the hydrogen atoms of isolated hydroxyl groups on TiO2 surfaces. The third peak was centered at 1684 cm−1, which was relatively the most shifted carbonyl peak towards lower wavenumbers. Due to the structure of rutile surface, not only does it contain isolated hydroxyl groups, but also Ti4+ sites that enable heterogeneous interactions with organic compounds as observed previously for carvone, benzene, toluene, and chlorobenzene.39,42,43 These metal interactions are generally stronger than H-bonds between organic compounds and isolated hydroxyl groups,42 resulting in greater shifts of absorption bands towards lower vibrational frequencies compared to the shifts due to H-bonding. In addition to physisorption of DMS, an asymmetric (νas) and a symmetric (νs) stretching vibrations of carboxylate (COO−) were observed at 1548 cm−1 and 1451 cm−1, respectively, which were absent in the gas-phase DMS spectrum. The presence of these bands revealed the heterogeneous reactions occurred between DMS and TiO2 surfaces. It should be noted that the νs band at 1451 cm−1 appeared as a shoulder, which was clearly seen after the deconvolution of the band extending from 1400 to 1480 cm−1 (Fig. S2†). Similarly, strong interactions have been previously reported for adsorption of dry thin films of dimethyl esters on aluminum oxide, zinc oxide, and magnesium oxide surfaces to produce either bidentate chelating or bidentate bridging carboxylate products via metal ion sites.37,38 Moreover, the binding mode of the carboxylate product can be determined by the difference in vibrational frequencies of the splitting between the asymmetric and symmetric stretching bands (Δνas-s).44,45 The separation is dependent on the strength of the interactions between a metal ion and its coordinated species by the following order of binding modes: Δνas-s(monodentate) > Δνas-s(ionic) > Δνas-s(bidentate bridging) > Δνas-s(bidentate chelating).45–48 The Δνas-s value measured for succinic ions was 157 cm−1.44 In this study, the Δνas-s value was 97 cm−1, suggesting that the separation was significantly smaller than that of the ionic state. Therefore, the carboxylate product most likely binds onto TiO2 with a bidentate chelating coordination, which has been similarly observed for the liquid adsorption of sodium succinate on an aqueous surface of rutile.49
O stretching mode was present at 1764 cm−1 as well as the C–O–C stretching modes from 1170 to 1248 cm−1. TiO2-surface spectra after a 30 min DMS exposure at multiple equilibrium pressures (Fig. 7a) differed from those of SiO2 (Fig. 1). However, there were a few similarities, including a loss of isolated hydroxyl groups indicated by a negative peak at 3640 cm−1 and an appearance of a redshifted broad band due to H-bonding around 3340 cm−1. A carbonyl stretching band from 1690 to 1750 cm−1 was also observed with an apparent shoulder due to adsorbed DMS. The shape of the carbonyl band, however, was different from the appearance of the band for SiO2 that clearly showed the split of two peaks corresponding to interacted and free carbonyl groups. To investigate, this carbonyl band on TiO2 was curve fit and deconvoluted using Origin Pro 2023 software. This revealed three distinct peaks as shown in Fig. 7b. The first two fitted peaks centered at 1745 and 1726 cm−1 exhibited similar vibrational frequencies to those of the carbonyl peaks on SiO2 (Fig. 2a), suggesting that these peaks were due to the multilayer physisorption of DMS on TiO2via H-bonding interactions between the carbonyl oxygen atoms of DMS and the hydrogen atoms of isolated hydroxyl groups on TiO2 surfaces. The third peak was centered at 1684 cm−1, which was relatively the most shifted carbonyl peak towards lower wavenumbers. Due to the structure of rutile surface, not only does it contain isolated hydroxyl groups, but also Ti4+ sites that enable heterogeneous interactions with organic compounds as observed previously for carvone, benzene, toluene, and chlorobenzene.39,42,43 These metal interactions are generally stronger than H-bonds between organic compounds and isolated hydroxyl groups,42 resulting in greater shifts of absorption bands towards lower vibrational frequencies compared to the shifts due to H-bonding. In addition to physisorption of DMS, an asymmetric (νas) and a symmetric (νs) stretching vibrations of carboxylate (COO−) were observed at 1548 cm−1 and 1451 cm−1, respectively, which were absent in the gas-phase DMS spectrum. The presence of these bands revealed the heterogeneous reactions occurred between DMS and TiO2 surfaces. It should be noted that the νs band at 1451 cm−1 appeared as a shoulder, which was clearly seen after the deconvolution of the band extending from 1400 to 1480 cm−1 (Fig. S2†). Similarly, strong interactions have been previously reported for adsorption of dry thin films of dimethyl esters on aluminum oxide, zinc oxide, and magnesium oxide surfaces to produce either bidentate chelating or bidentate bridging carboxylate products via metal ion sites.37,38 Moreover, the binding mode of the carboxylate product can be determined by the difference in vibrational frequencies of the splitting between the asymmetric and symmetric stretching bands (Δνas-s).44,45 The separation is dependent on the strength of the interactions between a metal ion and its coordinated species by the following order of binding modes: Δνas-s(monodentate) > Δνas-s(ionic) > Δνas-s(bidentate bridging) > Δνas-s(bidentate chelating).45–48 The Δνas-s value measured for succinic ions was 157 cm−1.44 In this study, the Δνas-s value was 97 cm−1, suggesting that the separation was significantly smaller than that of the ionic state. Therefore, the carboxylate product most likely binds onto TiO2 with a bidentate chelating coordination, which has been similarly observed for the liquid adsorption of sodium succinate on an aqueous surface of rutile.49
An additional kinetic experiment was carried out to investigate the detailed adsorption process by exposing a TiO2 surface to 6 mTorr of DMS for 30 min followed by 1 h of evacuation. The peak areas of the three deconvoluted C![[double bond, length as m-dash]](https://www.rsc.org/images/entities/char_e001.gif) O peaks at 1745 cm−1, 1726 cm−1, and 1684 cm−1, as well as the asymmetric COO− stretch at 1548 cm−1 were integrated and plotted temporally (Fig. 7c). The integrated 1745 cm−1 peak (red) corresponding to free carbonyl of adsorbed DMS in the outer layers reached steady plateau in the first few min, indicating equilibrium was achieved. Then the integrated area decreased to approximately half after 1 h of evacuation, in agreement with the previous discussion about multilayer adsorption of DMS. Similarly, the integrated peak at 1726 cm−1 (green) appeared to reach equilibrium within a few min before slightly depleting due to evacuation. Since this peak corresponds to the interacted carbonyl in the first layer, the amount of adsorbed DMS decreased only minimally after 1 h of evacuation. Integrated peak areas are assumed to be proportional to adsorbate concentrations. Thus, the first-order desorption rate constant for non-reacted DMS monolayer on TiO2 is estimated to be (6.4 ± 1.0) × 10−5 s−1 from two replicate experiments (Fig. S3†), which is 3 times slower than that on SiO2. Notably, the peak at 1684 cm−1 (blue) revealed a continual decrease in the integrated peak area after approximately 3 min and continued to decrease linearly after evacuation. This steady depletion is concomitant with the increase in the amount of the new carboxylate product (gray). Therefore, it is possible that the DMS molecules that specifically interact with Ti4+ sites are responsible for the formation of the carboxylate product.
O peaks at 1745 cm−1, 1726 cm−1, and 1684 cm−1, as well as the asymmetric COO− stretch at 1548 cm−1 were integrated and plotted temporally (Fig. 7c). The integrated 1745 cm−1 peak (red) corresponding to free carbonyl of adsorbed DMS in the outer layers reached steady plateau in the first few min, indicating equilibrium was achieved. Then the integrated area decreased to approximately half after 1 h of evacuation, in agreement with the previous discussion about multilayer adsorption of DMS. Similarly, the integrated peak at 1726 cm−1 (green) appeared to reach equilibrium within a few min before slightly depleting due to evacuation. Since this peak corresponds to the interacted carbonyl in the first layer, the amount of adsorbed DMS decreased only minimally after 1 h of evacuation. Integrated peak areas are assumed to be proportional to adsorbate concentrations. Thus, the first-order desorption rate constant for non-reacted DMS monolayer on TiO2 is estimated to be (6.4 ± 1.0) × 10−5 s−1 from two replicate experiments (Fig. S3†), which is 3 times slower than that on SiO2. Notably, the peak at 1684 cm−1 (blue) revealed a continual decrease in the integrated peak area after approximately 3 min and continued to decrease linearly after evacuation. This steady depletion is concomitant with the increase in the amount of the new carboxylate product (gray). Therefore, it is possible that the DMS molecules that specifically interact with Ti4+ sites are responsible for the formation of the carboxylate product.
The surface products on TiO2 after 1 h of evacuation were extracted in the same manner previously described for SiO2 and analyzed by HRMS. The mass spectrum (Fig. 6b) revealed a peak at m/z 169.05 (C6H10O4) corresponding to adsorbed DMS, confirming that physisorption occurred on TiO2 surfaces. Additionally, two peaks corresponding to the carboxylate product were identified at m/z 155.03 and m/z 171.01 in a carboxylic acid (succinic acid, C5H8O4) and a sodium carboxylate (sodium succinate, C5H7O4Na) form, respectively. These forms are commonly observed in ESI when an analyte either grabs hydrogen from a solvent or forms a sodium salt during electrospray ionization.50 Another peak at m/z 197.08 (C8H14O4) was confirmed via tandem mass spectrometry (MS/MS) to yield m/z 155.03 or succinic acid as a fragment. Therefore, we hypothesize that this peak arose due to the reaction between succinate and ESI solvents.
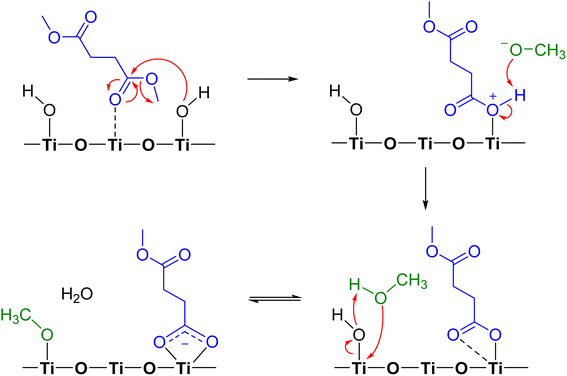
Proposed mechanism of DMS reactions on TiO2 surfaces
Adsorption of DMS on metal oxide surfaces, including alumina, zinc oxide, and magnesium oxide, under dry conditions was previously observed to produce a similar surface carboxylate product, and the reaction was suggested to occur via ester hydrolysis followed by deprotonation.37 In this study, we propose the mechanistic pathway of a heterogeneous reaction between gas-phase DMS and TiO2 surfaces (Scheme 1) based on the previously discussed FTIR and HRMS results. DMS interacting with Ti4+ sites undergoes hydrolysis simultaneously due to an attack by an electron lone pair from a surface isolated hydroxyl group on the carbonyl carbon, resulting in bond breakage to form a methoxide ion. The product is now bound to the surface with a positive charge on the oxygen atom, enabling the available methoxide ion to abstract a hydrogen to form methanol. The available carbonyl oxygen of the adsorbed product can then coordinate with the Ti4+ site to form a bidentate chelating linkage, which can further delocalize electron clouds. This bidentate chelating coordination was experimentally proven by the difference in FTIR vibrational frequencies between the asymmetric (1548 cm−1) and symmetric (1451 cm−1) stretching modes of the adsorbed succinate. Furthermore, methanol is known to dissociatively adsorb onto TiO2 surfaces through reaction with OH groups to form an adsorbed methoxy and water.51 The formation of smaller quantities of methanol and adsorbed methoxy group, however, cannot be detected in FTIR and HRMS due to limit of detection and spectral overlaps with the DMS features. However, methanol formation was later detected to be desorbed from the surface when relative humidity was introduced into the infrared cell (vide infra).Isotope-labelling experiments were conducted to confirm the proposed mechanism. TiO2 surfaces were first fully deuteroxylated by flushing with deuterated water (D2O) until all the hydroxyl groups were replaced by deuteroxyl (–OD) groups.52,53 The deuteroxylated TiO2 surface was then exposed to DMS at 40 mTorr for 30 min and evacuated overnight. According to our proposed mechanism, the only deuterated product is gas-phase semi-heavy water (HOD) with no other surface deuterated products. However, the presence of HOD may not be clearly visible due to little amount produced. Therefore, we aimed to test for any changes on the deuteroxylated TiO2 surface. The FTIR spectra (Fig. S4†) showed a negative peak corresponding to a loss of isolated –OD groups at 2678 cm−1 and a broad band around 2540 cm−1 due to H-bonding52 with the carbonyl oxygen of DMS. No other variations in peak assignments compared to the adsorption of DMS onto the hydroxylated TiO2 surface were observed, suggesting no deuterated products were formed. This in turn supported the current mechanism by showing that DMS itself did not react with TiO2 surfaces through other reaction pathways and, in particular, did not react with O–D surface groups.
Relative humidity (RH) studies
Water vapor plays a crucial role in adsorption and heterogeneous/multiphase chemistry processes indoors by participating in aqueous reactions or displacing adsorbed compounds, thereby controlling the concentrations of VOCs in the indoor environments.40,54,55 Indoor RH values vary depending on locations and can range from below 10% to more than 90%, while the United States Environmental Protection Agency has recommended an optimal indoor RH range of 30–50%.56 To understand the impact of relative humidity on DMS adsorption onto indoor relevant surfaces, a SiO2 surface was first exposed to DMS at a desired pressure for 30 min. Then water vapor was introduced to the system in the presence of gas-phase and surface-adsorbed DMS to achieve a new equilibrium pressure, which was used to calculate the % RH. It should be noted that the partial pressure of DMS at the new equilibrium was relatively small compared to the pressure of the injected water vapor (103 order of magnitude), thus being negligible for relative humidity calculations. In this study, the experiments were carried out at 50 ± 3% RH. At 7 mTorr of DMS exposure (Fig. 8a), the surface silanol sites were not fully occupied. Therefore, when the SiO2 was consecutively exposed to water vapor, the remaining gas-phase DMS as well as the water vapor were still able to readily adsorb to the available sites through H-bonding. Moreover, there may be some contributions from the desorption of wall-adsorbed DMS upon the water vapor exposure due to water displacement in which these DMS molecules associated with the infrared cell walls can adsorb onto the SiO2 surface as well. A control experiment was carried out by exposing a SiO2 surface to only water vapor at 50 ± 3% RH to obtain FTIR spectra of gas-phase and surface-adsorbed water. The water bending mode around 1630 cm−1 suggests that the ratio between water adsorbed on a bare SiO2 to the water adsorbed on the SiO2 surface in the presence of gas-phase and adsorbed DMS is approximately 1![[thin space (1/6-em)]](https://www.rsc.org/images/entities/char_2009.gif) :
:![[thin space (1/6-em)]](https://www.rsc.org/images/entities/char_2009.gif) 1. At a higher DMS pressure, 50 mTorr (Fig. 8b), multilayer adsorption dominates as seen by the double-carbonyl peak feature from the FTIR spectra. However, the band at 1748 cm−1 decreased in absorbance after water vapor was injected, while the ratio of the ∼1630 cm−1 absorption band of the adsorbed water bending mode between the bare and DMS-SiO2 remained close to 1
1. At a higher DMS pressure, 50 mTorr (Fig. 8b), multilayer adsorption dominates as seen by the double-carbonyl peak feature from the FTIR spectra. However, the band at 1748 cm−1 decreased in absorbance after water vapor was injected, while the ratio of the ∼1630 cm−1 absorption band of the adsorbed water bending mode between the bare and DMS-SiO2 remained close to 1![[thin space (1/6-em)]](https://www.rsc.org/images/entities/char_2009.gif) :
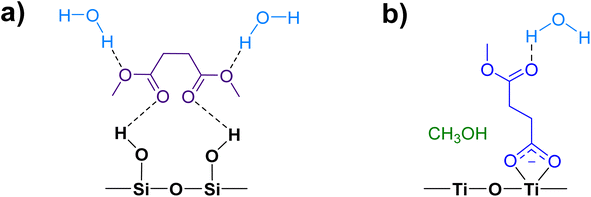
:![[thin space (1/6-em)]](https://www.rsc.org/images/entities/char_2009.gif) 1. The absorbance of the 1726 cm−1 band stayed approximately the same, suggesting that water molecules displace adsorbed DMS in the outer layers at higher pressures, while the first layer is not affected. Esters can form H-bonds with water. Therefore, the adsorbed DMS in the first layer may also interact with water molecules by H-bonding as illustrated in Fig. 9a. This can also be due to greater strength of H-bonding than the intermolecular forces between ester molecules, including van de Waals forces and dipole–dipole interactions, thus facilitating water interactions with the adsorbed DMS and displacement of more weakly-bound DMS.
1. The absorbance of the 1726 cm−1 band stayed approximately the same, suggesting that water molecules displace adsorbed DMS in the outer layers at higher pressures, while the first layer is not affected. Esters can form H-bonds with water. Therefore, the adsorbed DMS in the first layer may also interact with water molecules by H-bonding as illustrated in Fig. 9a. This can also be due to greater strength of H-bonding than the intermolecular forces between ester molecules, including van de Waals forces and dipole–dipole interactions, thus facilitating water interactions with the adsorbed DMS and displacement of more weakly-bound DMS.
 | ||
| Fig. 8 FTIR spectra of the SiO2 surface after DMS exposure at an equilibrium pressure of (a) 7 mTorr and (b) 50 mTorr followed by exposure to water vapor at 50 ± 3% RH. | ||
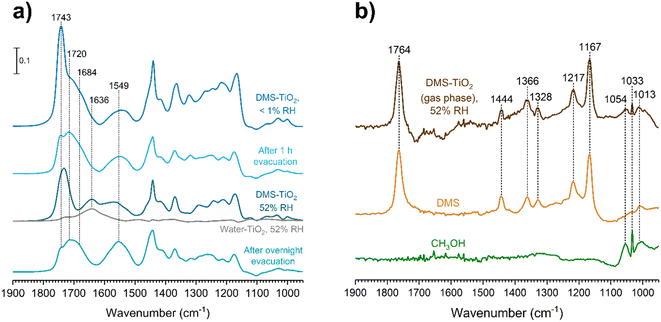
The role of relative humidity on DMS adsorption on TiO2 was also investigated. Since DMS chemisorbs on TiO2 surfaces to form adsorbed succinate and methoxy, we aimed to determine if water played any role with these chemisorbed products. After a TiO2 surface was exposed to DMS at an equilibrium pressure of 47 mTorr, the entire system was evacuated for 1 h to remove the gas-phase DMS, leaving only the remaining physisorbed and chemisorbed products on the surface. Water vapor was then injected to achieve a relative humidity of 52%. The resulting FTIR spectra (Fig. 10a) showed that DMS in the first layer remained molecularly adsorbed according to the 1720 cm−1 band, while more than half of the outer-layered DMS was removed as seen from the decrease in the 1743 cm−1 band. The carboxylate product, succinate, also firmly adsorbed onto the surface regardless of evacuation. After water vapor exposure, the water bending band appeared at 1636 cm−1, which overlapped with the asymmetric stretching band of succinate at 1549 cm−1. Fig. 10b shows the gas-phase FTIR spectrum with respect to the TiO2 surface after the exposure to DMS followed by water vapor, which was subtracted by the FTIR spectrum of water in the presence of TiO2 at the same %RH. The C–O–C stretching modes from DMS features appeared in the gas phase from 1167 to 1217 cm−1, arising from water displacement of surface-adsorbed DMS. Moreover, the C–O stretching modes of methanol were clearly present from 1013 to 1054 cm−1 as compared to the gas-phase methanol FTIR spectrum. This confirms the formation of methanol as a byproduct of the reaction of DMS with TiO2 surfaces (Scheme 1) in which methanol adsorbs as a methoxy group on the surface. Once the DMS-TiO2 surface was exposed to water vapor, water displaced the adsorbed methanol, causing it to be released to the gas phase as observed in FTIR.
Conclusion
Environmental regulations and development of new materials give rise to emerging air pollutants in both outdoor and indoor environments.57 Evaluations of these new pollutants are needed as a measure to predict indoor air quality and their impacts on human exposure. This work provides a detailed account of the surface chemistry of a dibasic ester, an emerging indoor air pollutants recently detected in new apartments from emissions of wooden coatings,23 with indoor relevant surfaces. Indoor surfaces are well-known to serve as reservoirs for adsorption and heterogeneous reactions of volatile and semi-volatile species in the environment.28 Dimethyl succinate has been shown to readily adsorb onto SiO2 surfaces via mostly reversible hydrogen bonding interactions. Moreover, DMS transforms on TiO2 surfaces via reversible and irreversible adsorption with the surface reactions to form new products, including a bidentate chelating succinate and an adsorbed methoxy group through hydrolysis and deprotonation. These products remain adsorbed for long periods of time, especially on TiO2 surfaces, and the slow desorption process enables indoor surfaces to become a long-term source of emission and exposure. In the presence of water vapor, molecularly adsorbed DMS and methanol can be displaced by water molecules and released back into the indoor air, whereas the adsorbed reaction product, succinate, remains strongly adsorbed on the surface regardless of relative humidity. The fate of this adsorbed succinate is yet to be explored when indoor oxidative species, such as ozone, hydroxyl radicals, and nitrogen dioxide, are present. Nevertheless, succinate ions were reported to react with ozone and hydroxyl radicals with rate constants of (3 ± 1) × 10−2 M−1 s−1 and 3.1 × 10⁸ M−1 s−1, respectively,58 suggesting adsorbed succinate potentially serves as a co-reactant with oxidative species. Overall, indoor emerging pollutants evolve with time, and the study of these pollutants on surfaces and their possible fates in the indoor environments is important to understand so as to determine possible exposure pathways and the impacts on human health.Author contributions
CD and VHG designed experiments. CD and JZ carried out the experiments. The manuscript was written through contributions of all authors. All authors have given approval to the final version of the manuscript.Conflicts of interest
The authors declare no competing financial interest.Acknowledgements
The authors acknowledge Alfred P. Sloan Foundation (G-2020-12675) for funding this work. CD would like to thank the Development and Promotion of Science and Technology Talents Scholarship by the Royal Thai Government for financial support. The authors also thank Dr Eshani Hettiarachchi and Dr Hanyu Fan for helpful discussions.References
- V. Van Tran, D. Park and Y.-C. Lee, Indoor air pollution, related human diseases, and recent trends in the control and improvement of indoor air quality, Int. J. Environ. Res. Public Health, 2020, 17, 2927 CrossRef CAS PubMed.
- A. Cincinelli and T. Martellini, Indoor air quality and health, Int. J. Environ. Res. Public Health, 2017, 14, 1286 CrossRef PubMed.
- J. M. Seguel, R. Merrill, D. Seguel and A. C. Campagna, Indoor air quality, Am. J. Lifestyle Med., 2017, 11, 284–295 CrossRef.
- I. Rivas, J. C. Fussell, F. J. Kelly and X. Querol, in Issues in Environmental Science and Technology, 2019, vol. 2019, pp. 1–34 Search PubMed.
- National Academies of Sciences, Engineering, and Medicine, Why Indoor Chemistry Matters, National Academies Press, Washington, D.C., 2022 Search PubMed.
- B. You, W. Zhou, J. Li, Z. Li and Y. Sun, A review of indoor gaseous organic compounds and human chemical exposure: insights from real-time measurements, Environ. Int., 2022, 170, 107611 CrossRef CAS PubMed.
- O. C. Ulker, O. Ulker and S. Hiziroglu, Volatile organic compounds (VOCs) emitted from coated furniture units, Coatings, 2021, 11, 806 CrossRef CAS.
- A. P. Jones, Indoor air quality and health, Atmos. Environ., 1999, 33, 4535–4564 CrossRef CAS.
- J. A. Hoskins, in Survival and Sustainability, Springer Berlin Heidelberg, Berlin, Heidelberg, 2010, pp. 665–676 Search PubMed.
- J. González-Martín, N. J. R. Kraakman, C. Pérez, R. Lebrero and R. Muñoz, A state–of–the-art review on indoor air pollution and strategies for indoor air pollution control, Chemosphere, 2021, 262, 128376 CrossRef.
- World Health Organization, WHO Guidelines for Indoor Air Quality: Selected Pollutants, WHO Regional Office for Europe, 2010 Search PubMed.
- World Health Organization, WHO Global Air Quality Guidelines: Particulate Matter (PM2.5 and PM10), Ozone, Nitrogen Dioxide, Sulfur Dioxide and Carbon Monoxide, World Health Organization, 2021 Search PubMed.
- Air Toxics Screening Levels, https://www.michigan.gov/documents/deq/deq-aqd-toxics-ITSLALPH_244167_7.pdf, (accessed 9 November 2022) Search PubMed.
- P. T. Anastas, in Clean Solvents, American Chemical Society, 2002, pp. 1–9 Search PubMed.
- A. K. Patra and S. R. K. Pariti, Restricted substances for textiles, Text. Prog., 2022, 54, 1–101 CrossRef.
- F. P. Byrne, S. Jin, G. Paggiola, T. H. M. Petchey, J. H. Clark, T. J. Farmer, A. J. Hunt, C. Robert McElroy and J. Sherwood, Tools and techniques for solvent selection: green solvent selection guides, Sustainable Chem. Processes, 2016, 4, 7 CrossRef.
- A. Macchia, L. Rivaroli and B. Gianfreda, The GREEN RESCUE: a ‘green’ experimentation to clean old varnishes on oil paintings, Nat. Prod. Res., 2021, 35, 2335–2345 CrossRef CAS PubMed.
- N. E. Kob, in Clean Solvents, American Chemical Society, 2002, pp. 238–253 Search PubMed.
- N. Ismail, Q. Zhou, Q. Wang, Z. Cui, N. Skoglund and N. Tavajohi, Dibasic esters as green solvents for PVDF membrane preparation, Green Chem., 2023, 25, 7259–7272 RSC.
- M. Tryznowski, A. Świderska, T. Gołofit and Z. Żołek-Tryznowska, Wood adhesive application of poly(hydroxyurethane)s synthesized with a dimethyl succinate-based amide backbone, RSC Adv., 2017, 7, 30385–30391 RSC.
- C. Keenan, Degeneration and recovery of rat olfactory epithelium following inhalation of dibasic esters, Fundam. Appl. Toxicol., 1990, 15, 381–393 CrossRef CAS.
- K.-P. Lee, R. Valentine and M. S. Bogdanffy, Nasal lesion development and reversibility in rats exposed to aerosols of dibasic esters, Toxicol. Pathol., 1992, 20, 376–393 CrossRef CAS PubMed.
- J. Qiu, D. Xie, Y. Li, Y. Qu, Y. Liu, T. Zhu and Y. Liu, Dibasic esters observed as potential emerging indoor air pollutants in new apartments in Beijing, China, Environ. Sci. Technol. Lett., 2021, 8, 445–450 CrossRef CAS.
- B. Heinzow, M. Santen, C. Reinfeldt and H. Sagunski, Dibasic esters as new and relevant indoor air contaminants, Gefahrstoffe – Reinhalt. Luft, 2009, 69, 159–164 CAS.
- S. B. Holøs, A. Yang, M. Lind, K. Thunshelle, P. Schild and M. Mysen, VOC emission rates in newly built and renovated buildings, and the influence of ventilation – a review and meta-analysis, Int. J. Vent., 2019, 18, 153–166 Search PubMed.
- D. M. Lunderberg, P. K. Misztal, Y. Liu, C. Arata, Y. Tian, K. Kristensen, R. J. Weber, W. W. Nazaroff and A. H. Goldstein, High-resolution exposure assessment for volatile organic compounds in two California residences, Environ. Sci. Technol., 2021, 55, 6740–6751 CrossRef CAS PubMed.
- S.-H. Shin and W.-K. Jo, Longitudinal variations in indoor VOC concentrations after moving into new apartments and indoor source characterization, Environ. Sci. Pollut. Res., 2013, 20, 3696–3707 CrossRef CAS.
- A. P. Ault, V. H. Grassian, N. Carslaw, D. B. Collins, H. Destaillats, D. J. Donaldson, D. K. Farmer, J. L. Jimenez, V. F. McNeill, G. C. Morrison, R. E. O'Brien, M. Shiraiwa, M. E. Vance, J. R. Wells and W. Xiong, Indoor surface chemistry: developing a molecular picture of reactions on indoor interfaces, Chem, 2020, 6, 3203–3218 CAS.
- J. P. D. Abbatt, G. C. Morrison, V. H. Grassian, M. Shiraiwa, C. J. Weschler and P. J. Ziemann, How should we define an indoor surface?, Indoor Air, 2022, 32, e12955 CrossRef.
- C. Wang, D. B. Collins, C. Arata, A. H. Goldstein, J. M. Mattila, D. K. Farmer, L. Ampollini, P. F. DeCarlo, A. Novoselac, M. E. Vance, W. W. Nazaroff and J. P. D. Abbatt, Surface reservoirs dominate dynamic gas-surface partitioning of many indoor air constituents, Sci. Adv., 2020, 6, eaay8973 CrossRef CAS.
- Y. Fang, P. S. J. Lakey, S. Riahi, A. T. McDonald, M. Shrestha, D. J. Tobias, M. Shiraiwa and V. H. Grassian, A molecular picture of surface interactions of organic compounds on prevalent indoor surfaces: limonene adsorption on SiO2, Chem. Sci., 2019, 10, 2906–2914 RSC.
- L. Huang, E. S. Frank, M. Shrestha, S. Riahi, D. J. Tobias and V. H. Grassian, Heterogeneous interactions of prevalent indoor oxygenated organic compounds on hydroxylated SiO2 surfaces, Environ. Sci. Technol., 2021, 55, 6623–6630 CrossRef CAS PubMed.
- L. Huang, E. S. Frank, S. Riahi, D. J. Tobias and V. H. Grassian, Adsorption of constitutional isomers of cyclic monoterpenes on hydroxylated silica surfaces, J. Chem. Phys., 2021, 154, 124703 CrossRef CAS PubMed.
- H. Fan, E. S. Frank, P. S. J. Lakey, M. Shiraiwa, D. J. Tobias and V. H. Grassian, Heterogeneous interactions between carvone and hydroxylated SiO2, J. Phys. Chem. C, 2022, 126, 6267–6279 CrossRef CAS.
- H. Schwartz-Narbonne, S. H. Jones and D. J. Donaldson, Indoor lighting releases gas phase nitrogen oxides from indoor painted surfaces, Environ. Sci. Technol. Lett., 2019, 6, 92–97 CrossRef CAS.
- R. Alwarda, S. Zhou and J. P. D. Abbatt, Heterogeneous oxidation of indoor surfaces by gas-phase hydroxyl radicals, Indoor Air, 2018, 28, 655–664 CrossRef CAS.
- L. I. Fockaert, S. Pletincx, B. Boelen, T. Hauffman, H. Terryn and J. M. C. Mol, Effect of zirconium-based conversion treatments of zinc, aluminium and magnesium on the chemisorption of ester-functionalized molecules, Appl. Surf. Sci., 2020, 508, 145199 CrossRef CAS.
- J. van den Brand, O. Blajiev, P. C. J. Beentjes, H. Terryn and J. H. W. de Wit, Interaction of ester functional groups with aluminum oxide surfaces studied using infrared reflection absorption spectroscopy, Langmuir, 2004, 20, 6318–6326 CrossRef CAS.
- H. Fan, E. S. Frank, D. J. Tobias and V. H. Grassian, Interactions of limonene and carvone on titanium dioxide surfaces, Phys. Chem. Chem. Phys., 2022, 24, 23870–23883 RSC.
- E. S. Frank, H. Fan, M. Shrestha, S. Riahi, D. J. Tobias and V. H. Grassian, Impact of adsorbed water on the interaction of limonene with hydroxylated SiO2: implications of π-hydrogen bonding for surfaces in humid environments, J. Phys. Chem. A, 2020, 124, 10592–10599 CrossRef CAS PubMed.
- R. Parameshwaran, P. Dhamodharan and S. Kalaiselvam, Study on thermal storage properties of hybrid nanocomposite-dibasic ester as phase change material, Thermochim. Acta, 2013, 573, 106–120 CrossRef CAS.
- M. Nagao and Y. Suda, Adsorption of benzene, toluene, and chlorobenzene on titanium dioxide, Langmuir, 1989, 5, 42–47 CrossRef CAS.
- M. Singh, N. Zhou, D. K. Paul and K. J. Klabunde, IR spectral evidence of aldol condensation: acetaldehyde adsorption over TiO2 surface, J. Catal., 2008, 260, 371–379 CrossRef CAS.
- K. D. Dobson and A. J. McQuillan, In situ infrared spectroscopic analysis of the adsorption of aliphatic carboxylic acids to TiO2, ZrO2, Al2O3, and Ta2O5 from aqueous solutions, Spectrochim. Acta, Part A, 1999, 55, 1395–1405 CrossRef.
- Q. Qu, H. Geng, R. Peng, Q. Cui, X. Gu, F. Li and M. Wang, Chemically binding carboxylic acids onto TiO2 nanoparticles with adjustable coverage by solvothermal strategy, Langmuir, 2010, 26, 9539–9546 CrossRef CAS PubMed.
- Y.-X. Weng, L. Li, Y. Liu, L. Wang and G.-Z. Yang, Surface-binding forms of carboxylic groups on nanoparticulate TiO2 surface studied by the interface-sensitive transient triplet-state molecular probe, J. Phys. Chem. B, 2003, 107, 4356–4363 CrossRef CAS.
- P. Uznanski, J. Zakrzewska, F. Favier, S. Kazmierski and E. Bryszewska, Synthesis and characterization of silver nanoparticles from (bis)alkylamine silver carboxylate precursors, J. Nanopart. Res., 2017, 19, 121 CrossRef PubMed.
- I. B. Ustunol, N. I. Gonzalez-Pech and V. H. Grassian, pH-dependent adsorption of α-amino acids, lysine, glutamic acid, serine and glycine, on TiO2 nanoparticle surfaces, J. Colloid Interface Sci., 2019, 554, 362–375 CrossRef CAS PubMed.
- S. J. Hug and D. Bahnemann, Infrared spectra of oxalate, malonate and succinate adsorbed on the aqueous surface of rutile, anatase and lepidocrocite measured with in situ ATR-FTIR, J. Electron Spectrosc. Relat. Phenom., 2006, 150, 208–219 CrossRef CAS.
- A. Kruve and K. Kaupmees, Adduct formation in ESI/MS by mobile phase additives, J. Am. Soc. Mass Spectrom., 2017, 28, 887–894 CrossRef CAS PubMed.
- A. Yamakata, T. Ishibashi and H. Onishi, Electron- and hole-capture reactions on Pt/TiO2 photocatalyst exposed to methanol vapor studied with time-resolved infrared absorption spectroscopy, J. Phys. Chem. B, 2002, 106, 9122–9125 CrossRef CAS.
- E. Hettiarachchi and V. H. Grassian, Heterogeneous chemistry of methyl ethyl ketone on mineral oxide surfaces: impacts of relative humidity and nitrogen dioxide on product formation, Environ. Sci.: Atmos., 2023, 3, 799–815 CAS.
- C. E. Nanayakkara, J. Pettibone and V. H. Grassian, Sulfur dioxide adsorption and photooxidation on isotopically-labeled titanium dioxide nanoparticle surfaces: roles of surface hydroxyl groups and adsorbed water in the formation and stability of adsorbed sulfite and sulfate, Phys. Chem. Chem. Phys., 2012, 14, 6957 RSC.
- P. Markowicz and L. Larsson, Influence of relative humidity on VOC concentrations in indoor air, Environ. Sci. Pollut. Res., 2015, 22, 5772–5779 CrossRef CAS PubMed.
- H. Fan, P. S. J. Lakey, E. S. Frank, D. J. Tobias, M. Shiraiwa and V. H. Grassian, Comparison of the adsorption–desorption kinetics of limonene and carvone on TiO2 and SiO2 surfaces under different relative humidity conditions, J. Phys. Chem. C, 2022, 126, 21253–21262 CrossRef CAS.
- Moisture control, part of indoor air quality design tools for schools.
- C. J. Weschler, Changes in indoor pollutants since the 1950s, Atmos. Environ., 2009, 43, 153–169 CrossRef CAS.
- B. Legube, Catalytic ozonation: a promising advanced oxidation technology for water treatment, Catal. Today, 1999, 53, 61–72 CrossRef CAS.
Footnote |
| † Electronic supplementary information (ESI) available: ESI contains four figures, including the FTIR spectra of SiO2 after DMS exposure at 5 mTorr followed by overnight evacuation, the peak deconvolution of the DMS-TiO2 absorption band from 1400 to 1480 cm−1, the first-order desorption kinetics of non-reacted DMS monolayer on TiO2 surfaces, and the FTIR spectra of the deuteroxylated TiO2 surface after DMS exposure and evacuation. See DOI: https://doi.org/10.1039/d3em00542a |
| This journal is © The Royal Society of Chemistry 2024 |

