
 Open Access Article
 This Open Access Article is licensed under a
 Creative Commons Attribution 3.0 Unported Licence
Molecular phosphorescence enhancement by the plasmon field of metal nanoparticles†
Niyazbek Kh.
Ibrayev
*a,
Rashid R.
Valiev
 *ab,
Evgeniya V.
Seliverstova
a,
Evgeniya P.
Menshova
a,
Rinat T.
Nasibullin
b and
Dage
Sundholm
b
*ab,
Evgeniya V.
Seliverstova
a,
Evgeniya P.
Menshova
a,
Rinat T.
Nasibullin
b and
Dage
Sundholm
b
aInstitute of Molecular Nanophotonics, Buketov Karaganda University, 100024 Karaganda, Kazakhstan. E-mail: niazibrayev54@gmail.com
bDepartment of Chemistry, University of Helsinki, FI-00014 Helsinki, Finland. E-mail: rashid.valiev@helsinki.fi
First published on 13th May 2024
Abstract
A theoretical model is proposed that allows the estimation of the quantum yield of phosphorescence of dye molecules in the vicinity of plasmonic nanoparticles. For this purpose, the rate constants of the radiative and nonradiative intramolecular transitions for rhodamine 123 (Rh123) and brominated rhodamine (Rh123-2Br) dyes have been calculated. The plasmon effect of Ag nanoparticles on various types of luminescence processes has been studied both theoretically and experimentally. We show that in the presence of a plasmonic nanoparticle, the efficiency of the immediate and delayed fluorescence increases significantly. The phosphorescence rate of the rhodamine dyes also increases near plasmonic nanoparticles. The long-lived luminescence i.e., delayed fluorescence and phosphorescence is more enhanced for Rh123-2Br than for Rh123. The largest phosphorescence quantum yield is obtained when the dye molecule is at a distance of 4–6 nm from the nanoparticle surface. Our results can be used in the design of plasmon-enhancing nanostructures for light-emitting media, organic light-emitting diodes, photovoltaic devices, and catalysts for activation of molecular oxygen.
1. Introduction
Localized plasmon resonance (LPR) of metal nanoparticles (NPs) is used in many analytical methods and applications. The resonantly photoexcited collective oscillations of free electrons in metal NPs consisting of Ag, Au, Cu or Al lead to an enhancement of the electromagnetic field around the NP.1 It is known that the enhancement factor of the strength of the electric field of plasmonic NPs can be as large as 104.2 Fluorophore or analogous molecules located in the near such NPs are exposed to an intense external influence, which allows them to accelerate photocatalytic reactions and to induce metal-enhanced luminescence or Raman scattering (SERS).Plasmon-enhanced fluorescence has been studied by several groups showing that the fluorescence of dye molecules can be enhanced or quenched by the NPs.3–5 The plasmon effect is determined by the distance between the plasmonic NP and the emitting molecule and by the mutual orientation of their transition dipole moments. This phenomenon can be used in devices based on radiative processes and their decay. In particular, the LPR of metal NPs has a significant influence on the relaxation processes of photoexcited emitters due to the Purcell effect6,7 making it possible to significantly reduce the lasing threshold of dye lasers in active media.8,9 Plasmonic effects can also be used to create media with specified optical properties,10,11 in sensor systems12–14 and in optoelectronic devices.15,16
Particularly interesting is the question of the influence of plasmons on the long-term luminescence that is associated with spin effects. Long-lived triplet states are important in many fundamental processes and can also be used in various practical applications. For example, the long-term luminescence of molecular probes may be used in bioimaging. However, there is an urgent need to improve its signal-to-noise ratio, which is low due to the autofluorescence of biological tissues.17 Triplet states are actively used in photosynthetic systems18 for generating reactive species of molecular oxygen (ROS). Singlet oxygen is employed in photodynamic therapy for the deactivation of cancer cells,19,20 in antibacterial therapy,21,22 as well as for treating skin and respiratory diseases.23 ROS are important in advanced oxidation processes for the degradation of pollutants in various resources,24 as well as in photocatalytic and photovoltaic reactions.25–28 Triplet states of organic compounds are also applicable in organic light-emitting diode (OLED) technologies,29,30 in solar cells31,32 and in transistors.33,34
Plasmon-enhanced phosphorescence is a very attractive area for many specialists.35–40 The authors of ref. 35 studied the distance dependence of the eosin luminescence in anhydrous glycerol and obtained an approximately 9-fold increase in the fluorescence and an almost 4-fold increase in the delayed fluorescence and phosphorescence due to the plasmonic effect. Metal-enhanced phosphorescence of rose bengal (RB) on silver island films (SIF) has been studied,36 where a 5-fold increase in the phosphorescence intensity was registered. The authors of ref. 41 studied the plasmonic effect of gold NPs on homogeneous and heterogeneous triplet–triplet annihilation of methylene blue (MB) in the presence of Au NPs. The increased efficiency of the two processes is associated with an enhanced excitation rate of singlet molecules and an enhanced intersystem crossing (ISC) rate to the triplet state.42 The plasmonic field of the NPs leads to a doubling of the population of the triplet state of MB through enhanced absorption by the singlet state of the molecule. In ref. 43, a 10-fold increase in the population of the triplet state of RB was achieved when molecules were placed near aggregates of gold NPs.
Silver nanoprisms can redistribute the probability of the decay of excited states of Pd–porphyrin,44 which was achieved by controlling the LPR wavelength of the Ag nanoprism and by adjusting its distance to the luminophore molecule. A twofold increase in the efficiency of the phosphorescence emitted by a Pt–porphyrin film has been achieved by adding gold NPs that decrease the triplet–triplet quenching.45 An increase in both fluorescence and phosphorescence and a decrease in their lifetime were observed for 2,5-dihexyloxy-4-bromobenzaldehyde in the presence of Ag NPs.46 The increased phosphorescence is due to the increased photoabsorption and photoemission rates near the NP. We obtained similar results in our studies of the distance dependence of the plasmon-accelerated decay of excited singlet and triplet states of eosin molecules.47 The plasmonic effect was manifested by the increased emission intensity, the shorter lifetime of the fluorescence, the delayed fluorescence, and by the phosphorescence. The optimal distance for the largest enhancement of all types of luminescence was 6–8 nm, which coincides rather well with the Förster radius of the non-radiative inductive-resonant process. A mathematical model was developed suggesting that the distance dependence of the intensity of the long-lived luminescence is qualitatively the same as the distance dependence of the fluorescence of a dye layer on a metal island film, which agree with experimental data. The influence of plasmonic NPs on the fluorescence and phosphorescence of erythrosine molecules in a polymer matrix has also been studied experimentally and theoretically.48
Even though many studies have been performed in this area, the mechanisms of the influence of plasmons on the deactivation of triplet states of organic molecules and on the phosphorescence is not elucidated. The radiative triplet (T1 → S0) transition leading to phosphorescence is enhanced since it can borrow intensity from spin-allowed radiative singlet (Sn → S0) transitions.49 The enhancement is proportional to the size of the matrix element of the spin–orbit coupling (SOC) of the triplet and singlet states, which is expected to lead to a more pronounced plasmonic effect on the phosphorescence.
Accurate values for SOC matrix elements, excitation energies of triplet states, and their deactivation rates are relevant for modern photophysical studies. Even without considering the plasmon effect, determinations of the rate constants of ISC and the quantum yield of phosphorescence are difficult by using experimental techniques. Modern quantum chemistry methods provide complementary information. Although, rate constants of first-order electronic transitions, such as ISC, internal conversion (IC) and fluorescence can be calculated with sufficient accuracy,50–55 calculations of the IC and ISC rate constants are still challenging for large molecules.56 The IC and ISC rate constants can be calculated using ab initio and molecular dynamics methods.57–59 However, these approaches can mainly be applied on small molecules and they are difficult to extend to large molecules since the computational costs increase rapidly with increasing size of the molecule. Valiev et al. have developed computational approaches to calculate ISC and IC rate constants based on Plotnikov's time-independent formalism. We have successfully employed this method in calculations of fluorescence rate constants of molecules near plasmonic NPs.56
Calculations of the rate constants of second-order electronic transitions are even more difficult because it is necessary to calculate the total lifetime of the triplet state of the molecule.49 Currently, the phosphorescence rate constant or the phosphorescence lifetime can be calculated within the framework of the quadratic response formalism at the time-dependent density functional theory (TD DFT) level using the Dalton program.60,61 However, the phosphorescence lifetime cannot uniquely characterize the total lifetime of the triplet state, since there are also other non-radiative channels for its deactivation. The most important ones among them are the first-order physical channels namely, ISC from T1 to S0, reverse ISC (RISC) to S1 and to energetically higher-lying singlet states (Sn) as well as the second-order IC process between T1 and S0, where the wave functions of T1 and S0 are not pure spin states.62 Intermolecular quenching channels may also play an important role.63
The rate constants of photophysical processes including phosphorescence change when a molecule is placed in the plasmon field of NPs. The plasmon field affects the probability of radiative transitions,56 and can also affect the rate constants of nonradiative transitions.64,65 We are not aware of any implementation of theoretical models, which considers the plasmon field effect on the total lifetime of the molecular triplet state using computational methods that accounts for properties of the individual molecules. Here, we have developed such a computational method and applied it to the well-known xanthene dyes rhodamine 123 (Rh123) and 2Br-rhodamine 123 (Rh123-2Br). Replacing two hydrogen atoms with halogen (Br) atoms increases the SOC matrix element and the yield of the triplet state.49 The plasmonic effects on the radiative transitions of Rh123-2Br is expected to be larger than for Rh123, even though the total quantum yield of fluorescence decreases when hydrogen atoms are replaced by the heavier Br. The plasmon effect is simulated with our model that considers the dipole–dipole interaction between the plasmonic NP and the dye molecule.4,56
2. Experimental and computational details
2.1 Experimental details
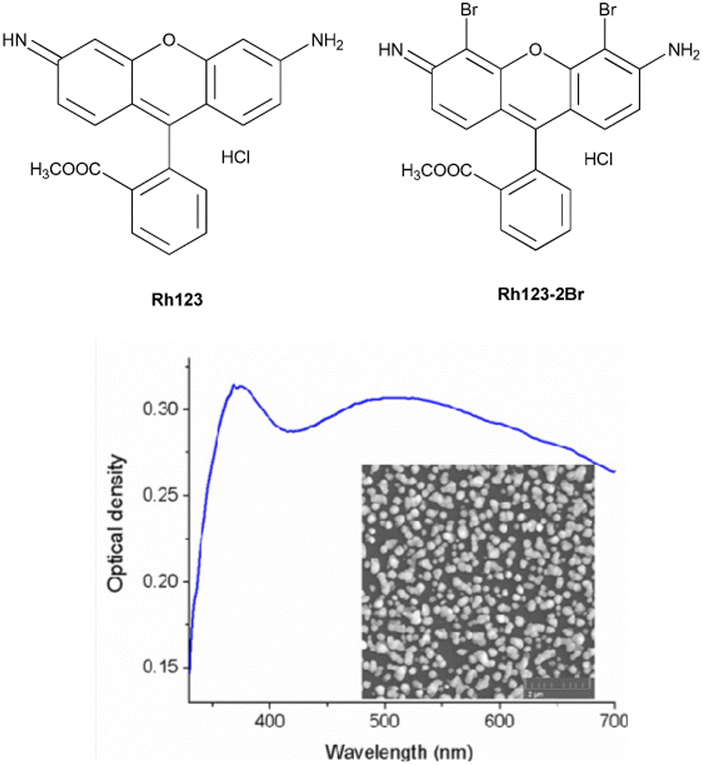 | ||
| Fig. 1 The chemical structures of the studied molecules and the absorption spectrum of the SIF. The inset shows the SEM image of the synthesized SIF sample. | ||
AgNO3, NaOH, NH4OH, D-glucose, polyvinyl alcohol (PVA) of analytical purity (Sigma Aldrich) were used for the synthesis of silver island films. Ultrapure water, obtained with the Smart S15 UVF system (Drawell), was used to prepare the samples.
 | (1) |
 .
.
Testing the quality of the fitting of the decay function (Fig. S1, ESI†) yielded a χ2 value of 1.15.
The delayed fluorescence (DF) and phoshorescence spectra were obtained with the Eclipse spectrofluorimeter (Agilent Techn.). The intensity of the DF and phosphorescence spectra at each wavelength were recorded 300 μs after the beginning of the flash of the Xe lamp, i.e., after the complete decay of the fluorescence signal. The decay kinetics of the long-lived luminescence was also recorded with the FLS1000 spectrometer (Edinburgh Instr.). The photoexcitation of the samples at λexc = 490 nm was carried out by using a laser system based on the Nd:YAG laser (LQ529) with an OPO (LP604) and a second-harmonic generator (LG305) from SolarLS. The delay in the detection of the decay of the DF and phosphorescence was 1 μs. The luminescence kinetics was also calculated using eqn (1). Assessing the fit of the decay of the DF and phosphorescence (Fig. S2, ESI†) yielded χ2 values of 1.2 and 1.4, respectively.
The samples were evacuated with Optistat DN-V (Oxford Instr.) when measuring the long-lived luminescence. The measurements were carried out at a temperature of 293 K.
The temperature-dependent measurements were carried out by cooling the samples with liquid nitrogen and heating them with a heater built into the cryostat.
The fluorescence quantum yields (φfl) of Rh123 and Rh123-2Br in ethanol solutions were determined with the AvaSphere 30-REFL integrating sphere and the AvaSpec-ULS2048 spectrometer (Avantes) using the absolute method. An LQ529 laser system with OPO second-harmonic generator was used as the source of the monochromatic light with λexc = 490 nm. The φfl value was determined using eqn (2):69
 | (2) |
3. Theory and computational details
3.1. First-order electronic transitions
The rate constants of ISC (kISC), IC (kIC) and radiative (kr) electron transitions were calculated using the computational approach developed by Valiev et al.70 The methods are described in detail in ref. 51, 52, 70 and 71. We present here only the most important expressions.The kr rate constant is calculated using the Strickler–Berg equation:72
 | (3) |
The IC rate constants (kIC) were calculated using the expression in eqn (4), which is described in detail in ref. 53,
 | (4) |
 | (5) |
 | (6) |
 | (7) |
 | (8) |
 | (9) |
 and
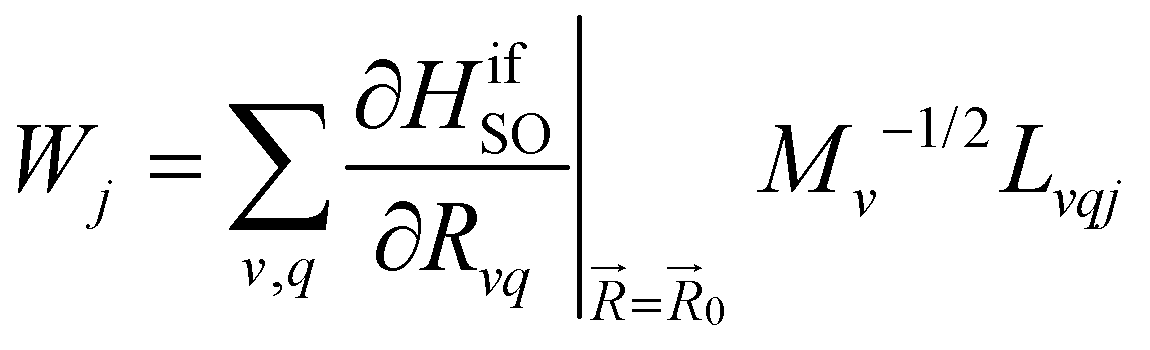
and  are the nonadiabatic coupling matrix elements (NACME) of first and second order, respectively. Mv is the mass of the vth atom, and Lvqj are coefficients of the linear relation between the Cartesian (R) and the normal coordinates (Q): Rvq − R0vq = Mv−1/2LvqjQj; yj is the Huang–Rhys factor of the jth vibrational mode; Eif is the energy difference between the initial and final states; nj and ωj are the excitation quantum number and the energy of the jth mode, respectively; bj and tj are the matrix elements of Qj and d/dQj between the nuclear functions of the initial and final electronic states, which are calculated by considering anharmonic effects using the Morse potential.51,53
The kISC rate constant is calculated using the expression in eqn (10):
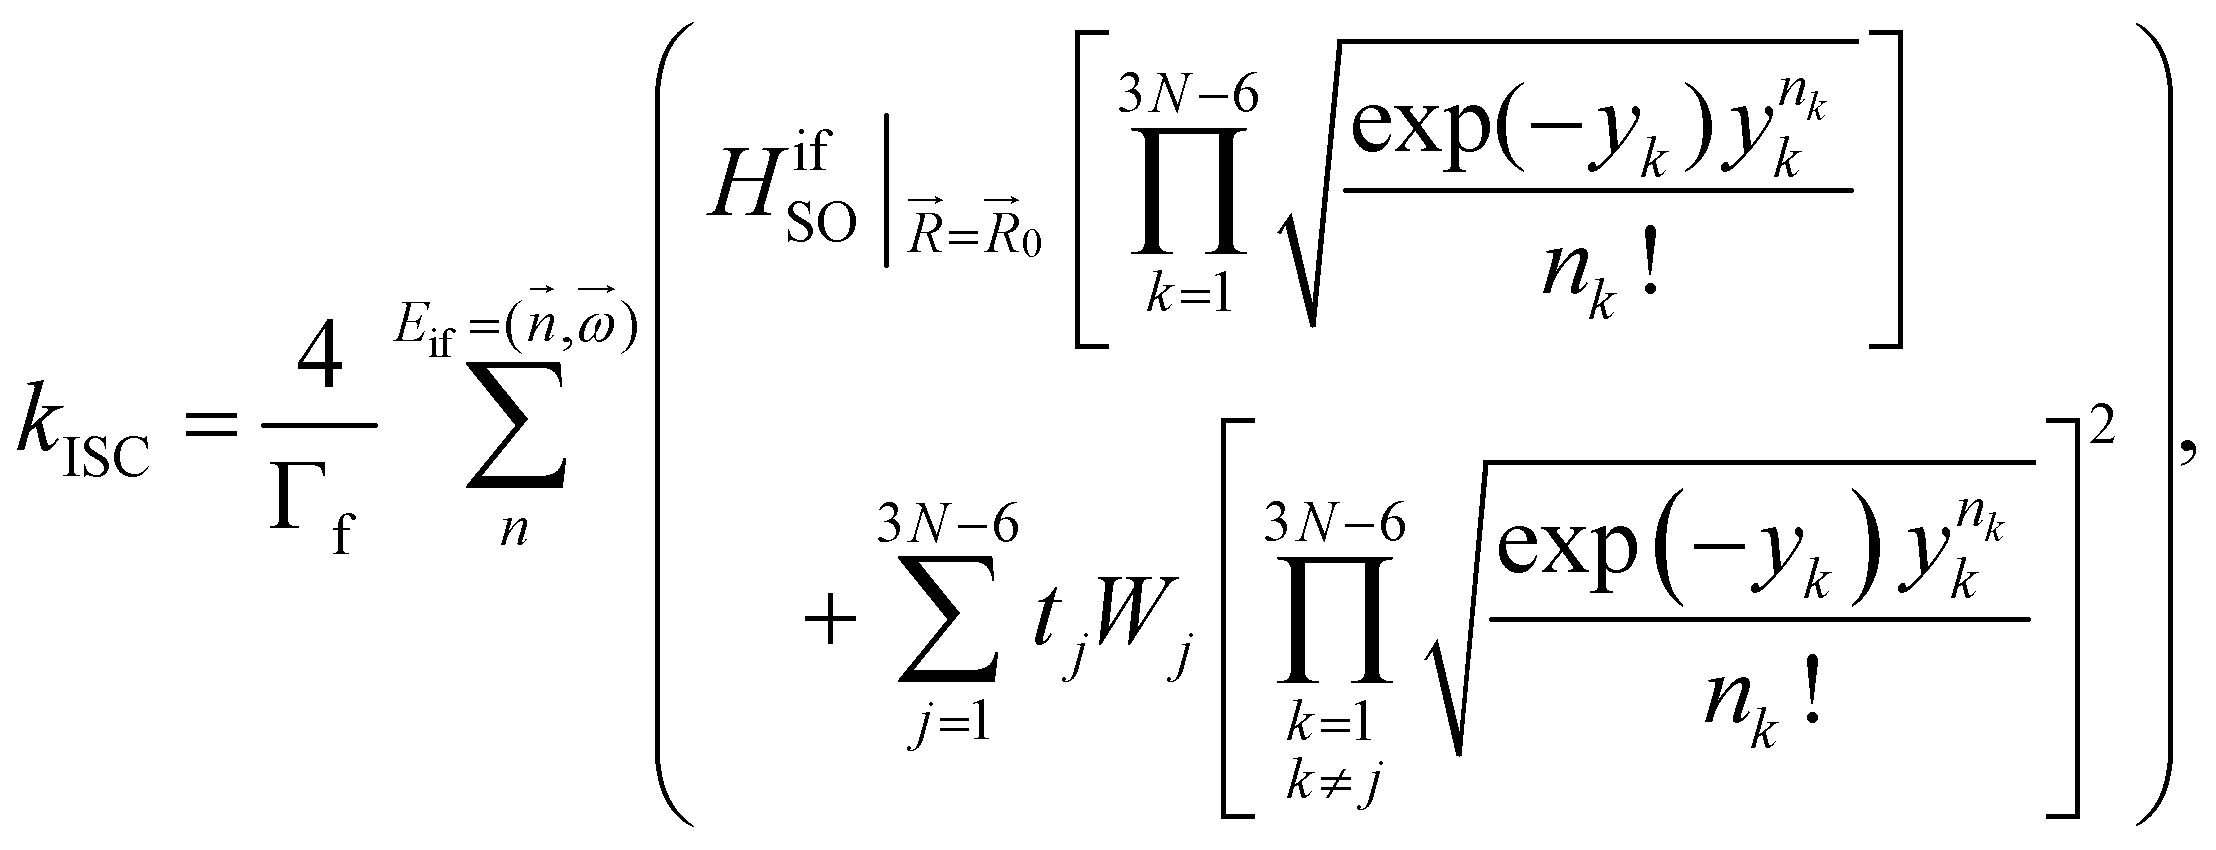 | (10) |
 | (11) |
Here, the 4/Γf factor is 1.6 × 10⁹ s−1 cm−2 and HifSO is the matrix elements of the spin–orbit coupling operator between the initial (i) and the final (f) electronic states.
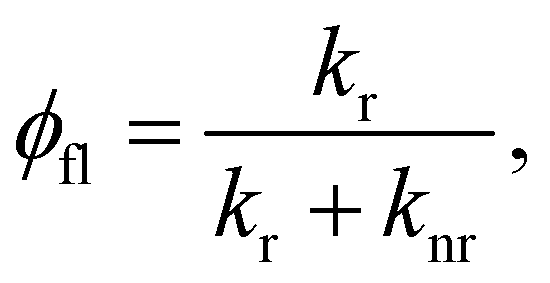
The fluorescence quantum yield (φfl) in the absence of a NP can be written as:70,73
 | (12) |
 from the lowest excited singlet state (S1) to the energetically lower-lying triplet states (Tn) and the IC rate constant from S1 to the singlet ground state (S0) (kIC(S1 → S0)).73,74 The
  , kIC(S1 → S0) and kr(S1 → S0) rate constants were calculated as described in ref. 51, 70 and 71.
Reversed ISC from T1 to S1 is calculated using eqn (13)75
 | (13) |
A similar expression is used for the reverse IC (RIC) from T1 to T2:
 | (14) |
3.2. Second order electron transitions
The spin-mixed wave functions of the S0 and T1 states can be obtained using perturbation theory.49 The spin-mixed triplet state in eqn (15) and the spin-mixed singlet state in eqn (16) are obtained by adding contributions from states of the other spin multiplicity. The mixing coefficients are obtained by using the perturbation theory expressions in eqn (17) and (18).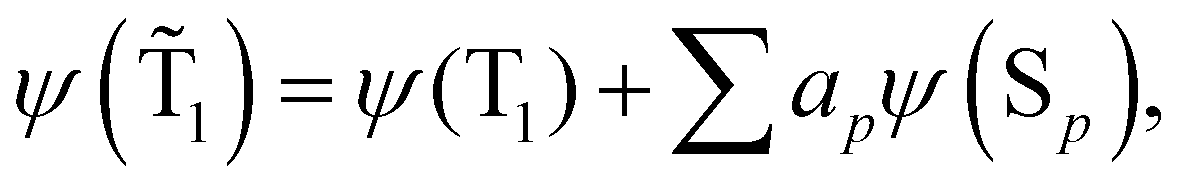 | (15) |
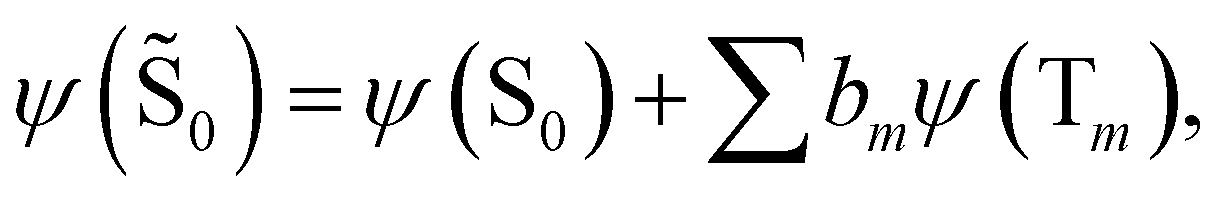 | (16) |
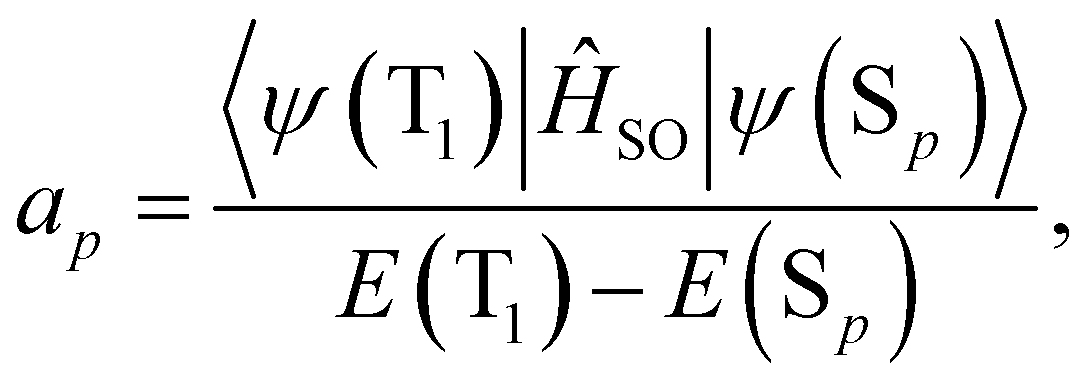 | (17) |
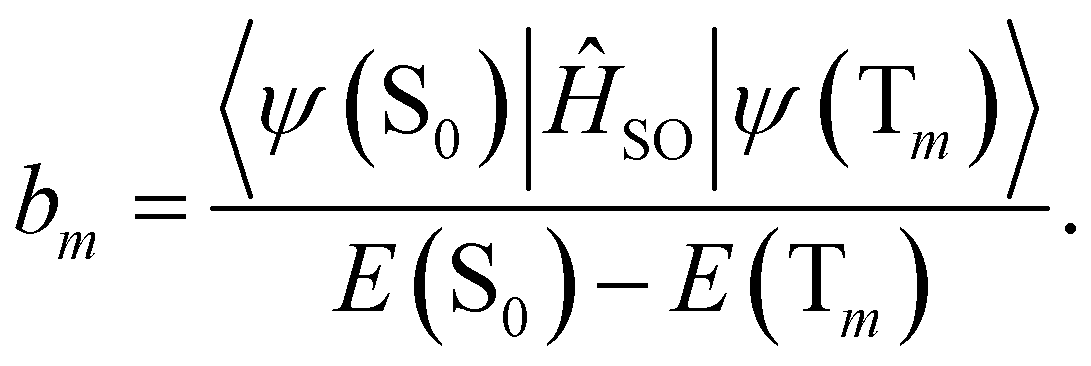 | (18) |
 | (19) |
An analogous expression involving the NACME is used when calculating the rate constant for IC between the spin-mixed T1 and S0 states.
 | (20) |
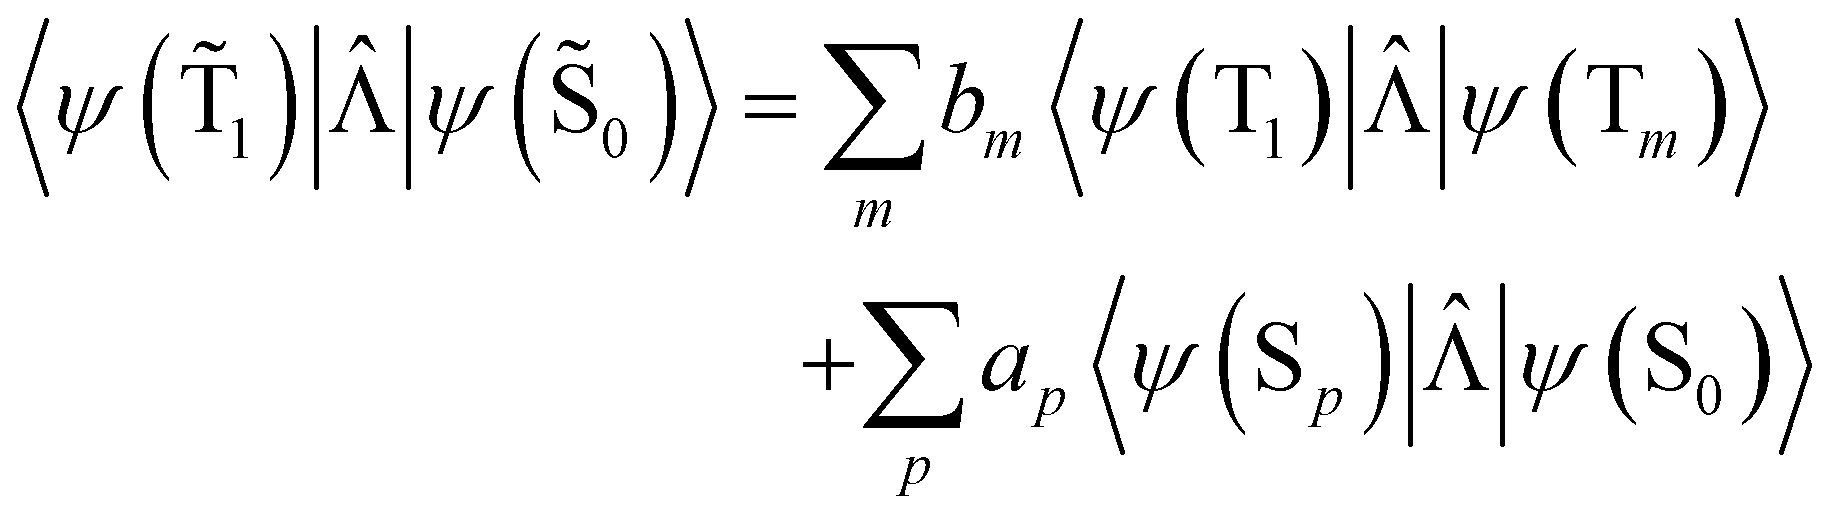
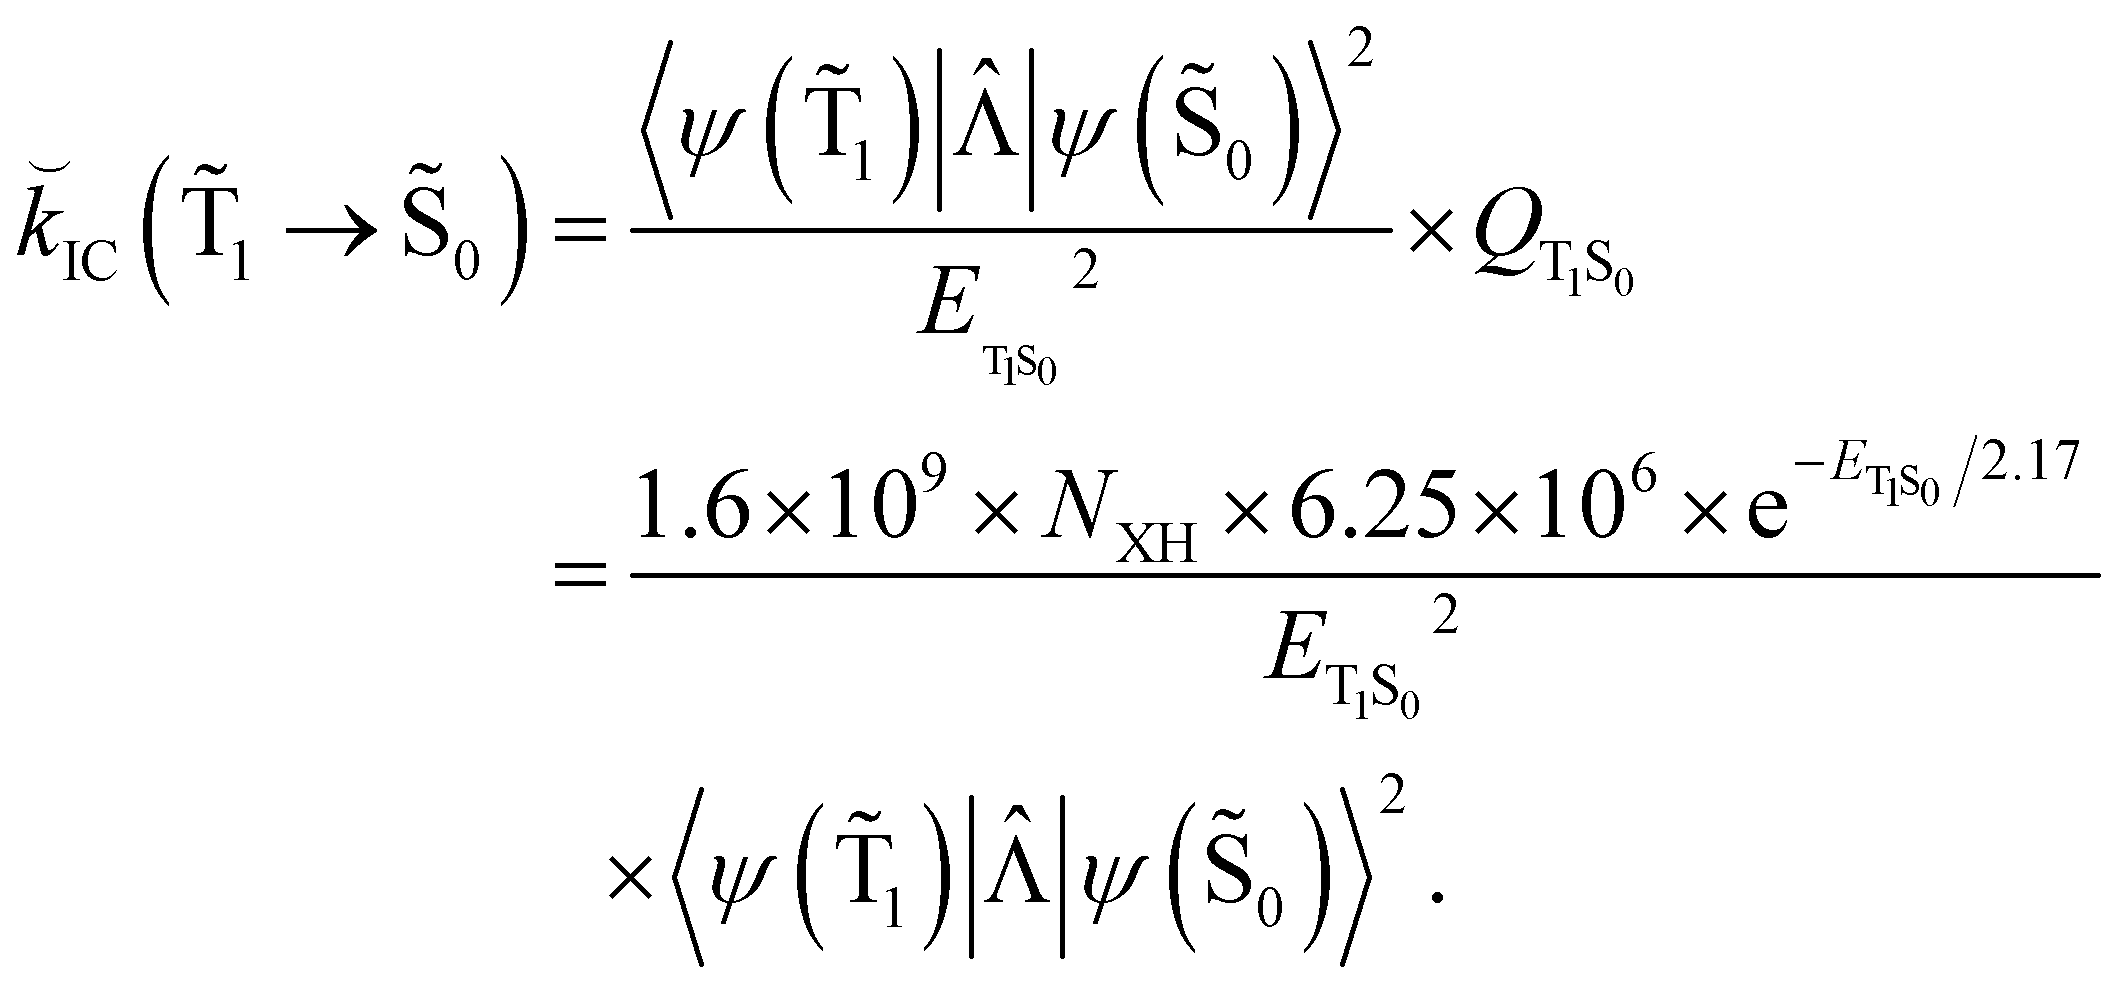
The 〈ψ(T1)|![[capital Lambda, Greek, circumflex]](https://www.rsc.org/images/entities/i_char_e0a8.gif) |ψ(Tm)〉 and 〈ψ(Sp)||ψ(S0)〉 matrix elements are needed when calculating 〈ψ(
|ψ(Tm)〉 and 〈ψ(Sp)||ψ(S0)〉 matrix elements are needed when calculating 〈ψ(![[T with combining tilde]](https://www.rsc.org/images/entities/char_0054_0303.gif) 1)||ψ(
1)||ψ(![[S with combining tilde]](https://www.rsc.org/images/entities/char_0053_0303.gif) 0)〉. Calculations of these matrix elements are difficult and require the Lvqj matrix for all electronic states. The determination of
0)〉. Calculations of these matrix elements are difficult and require the Lvqj matrix for all electronic states. The determination of ![[k with combining breve]](https://www.rsc.org/images/entities/i_char_006b_0306.gif) IC(1 → 0) using E(T1) − E(S0) and vibronic factors is not trivial.51
IC(1 → 0) using E(T1) − E(S0) and vibronic factors is not trivial.51
Hovewer, the X–H (where X is C, N or O) bond approximation can be used, where the X–H bonds are the main accepting modes of the IC process.51,76 This approximation is supported by experimental and computational studies showing that deuteration of X–H bonds decreases the IC probability.77,78 The X–H bond approximation avoids explicit calculations of 〈ψ(T1)||ψ(Tm)〉 and 〈ψ(Sp)||ψ(S0)〉, since they are approximated with contributions from X–H bond. In the X–H bond approximation, IC(1 → 0) can be written as:
 | (21) |
|ψ(Tm)〉 and 〈ψ(Sp)||ψ(S0)〉 are calculated as:51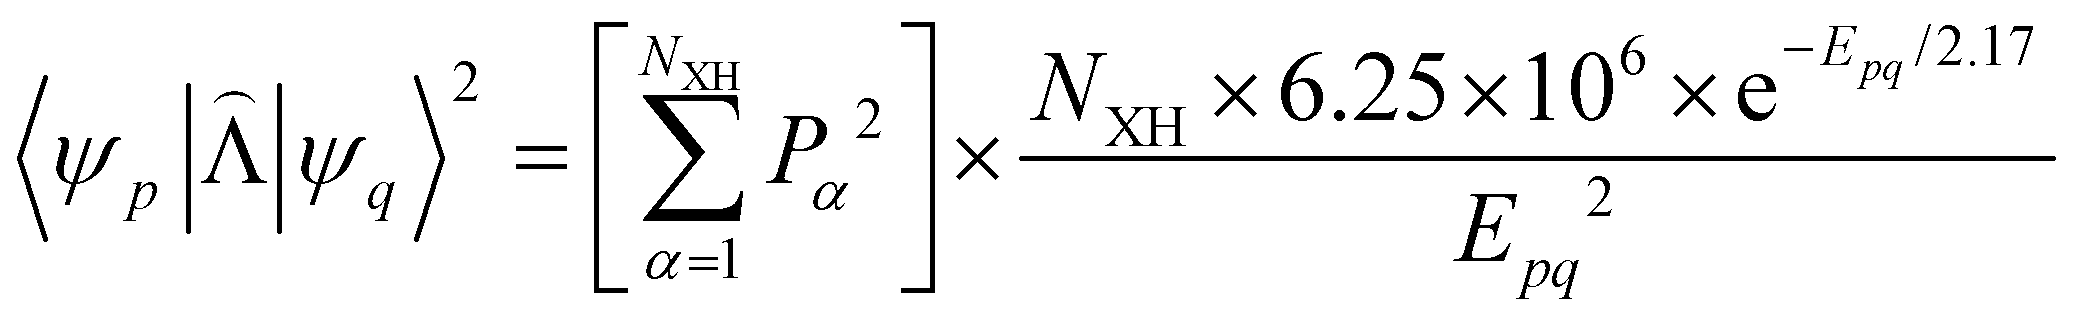 | (22) |
 | (23) |
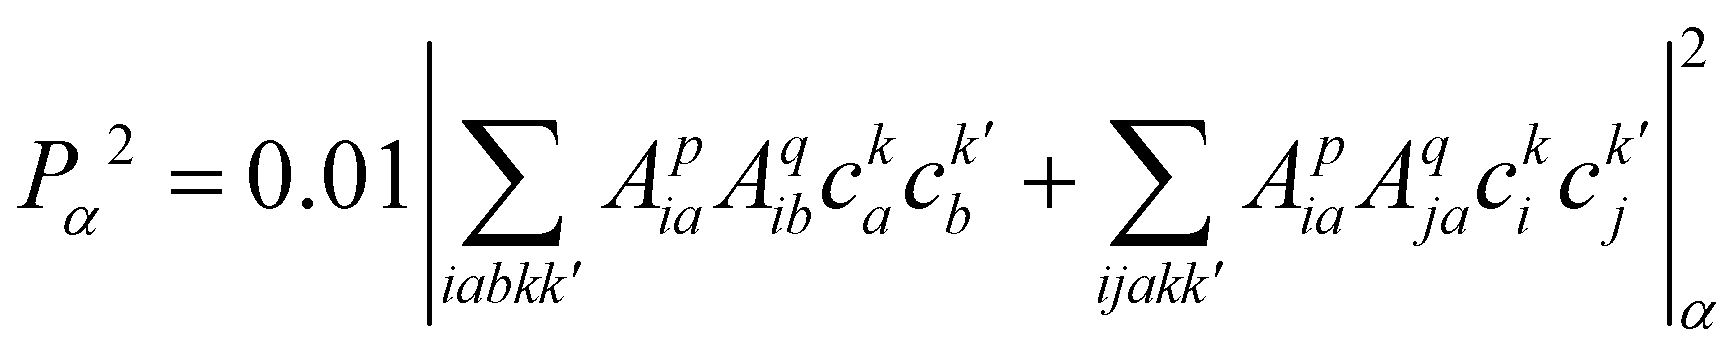
 , cka,
  , are the molecular orbital (MO) coefficients and Apia, Aqjb are configurationally interaction coefficients. The a, b indices denote virtual MO and i, j are indices of the occupied MOs. The NXH is the number of X–H bonds.
Valiev et al. showed that for molecules with an energitically low-lying T1 state (below 12![[thin space (1/6-em)]](https://www.rsc.org/images/entities/char_2009.gif) 000 cm−1), the IC(1 → 0) process determines the total lifetime of the T1 state.62,70
000 cm−1), the IC(1 → 0) process determines the total lifetime of the T1 state.62,70
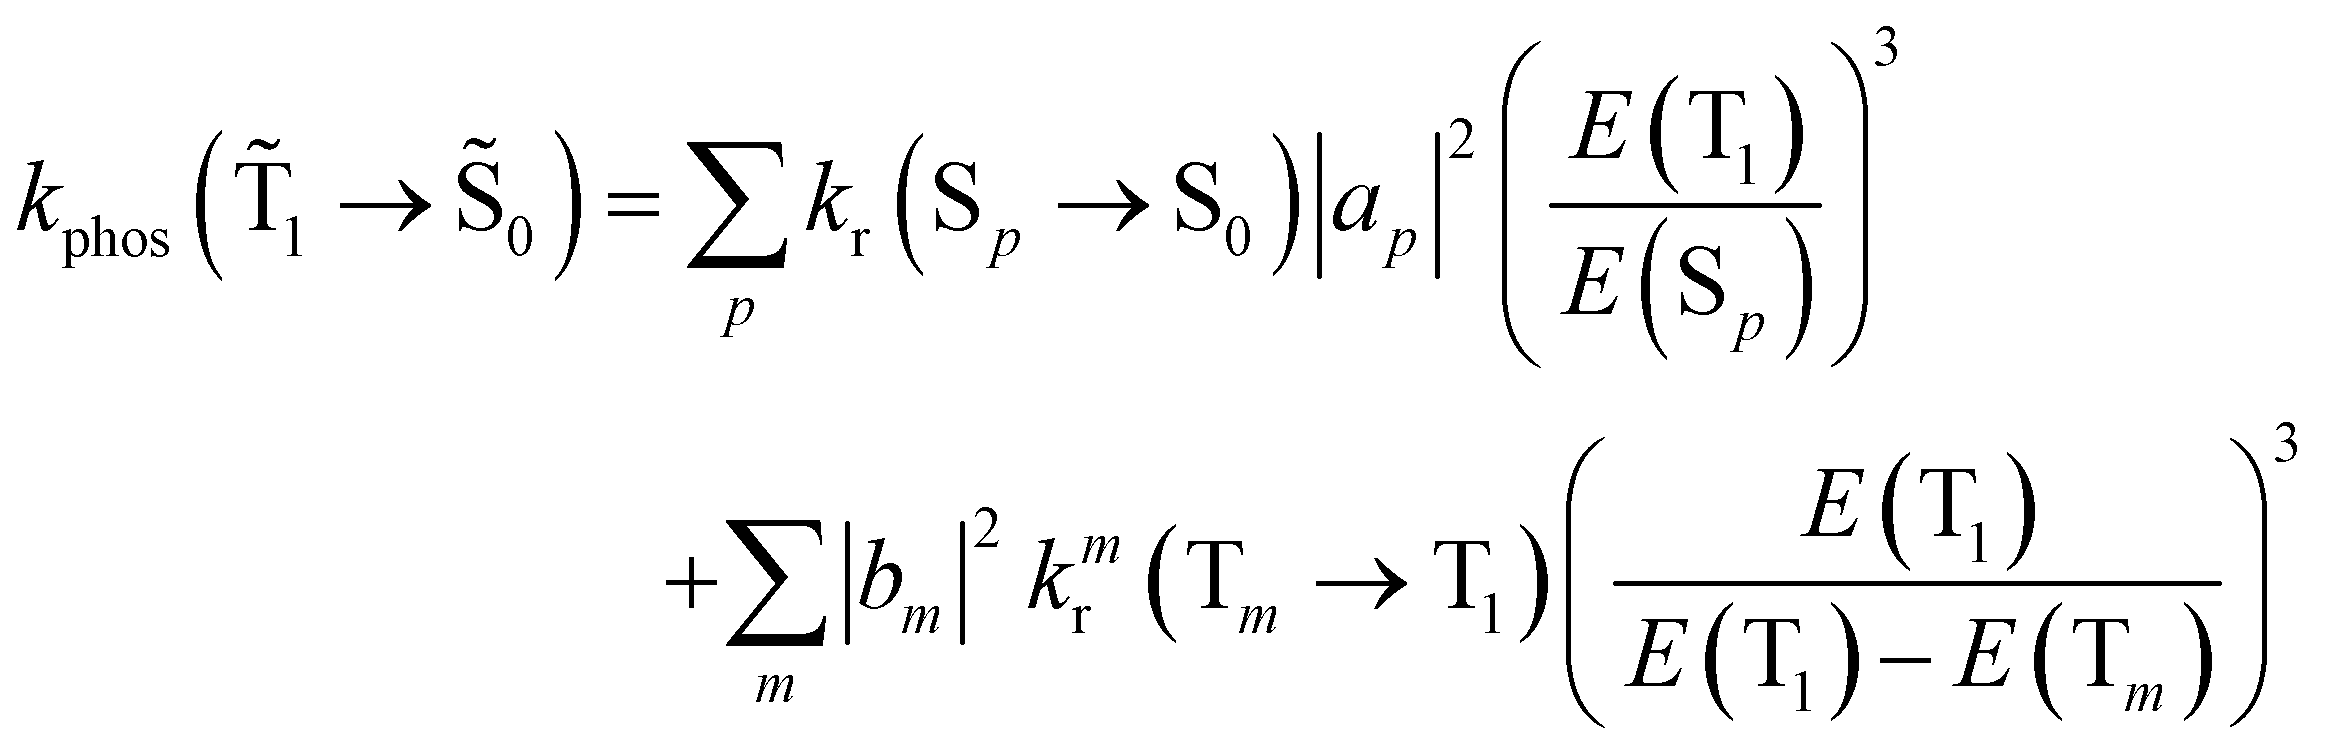
The IC(1 → 0), kphos(1 → 0), kRISC(T1 → Sn) and kRIC(T1 → Tn) rate constants determine the total lifetime of the T1 state when neglecting intermolecular processes. The phosphorescence quantum yield (φphos) can be written as
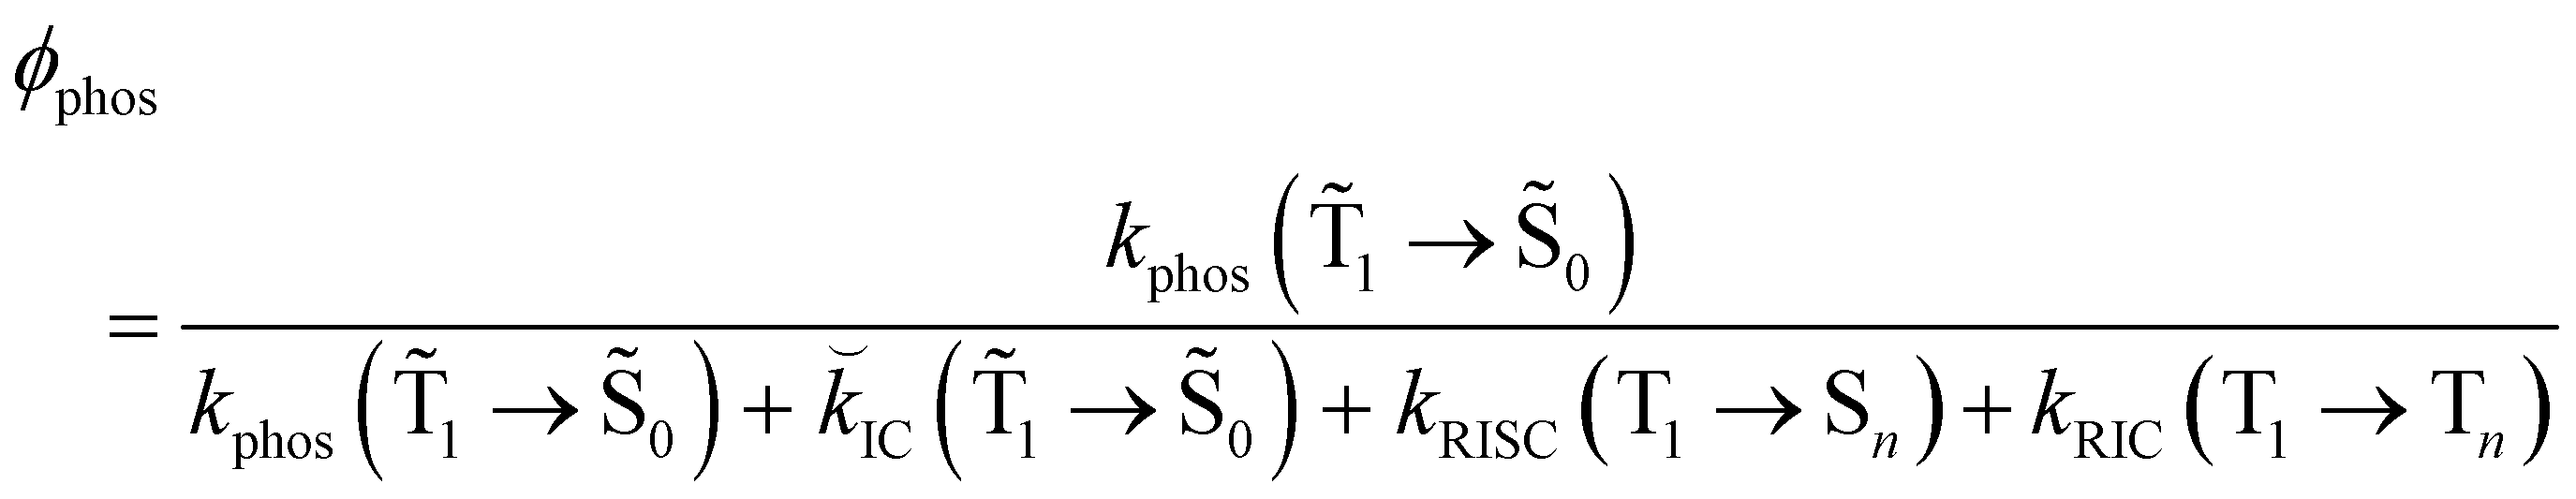 | (24) |
3.3. Intermolecular rate constants of molecules near NP surfaces
When a molecule is near a plasmonic NP, its photophysical properties change because the rate constants of the electronic transitions are affected and other intermolecular deactivation channels of the excited electronic states appear. In the dipole–dipole approximation of the interaction between the molecule and the plasmonic NP, changes in kr can be described using the dyadic Green's function.1,79,80 The kIC(S1 → S0) rate constant can also change.64 Expressions describing such changes can be derived using second-order perturbation theory, where NACME and![[p with combining right harpoon above (vector)]](https://www.rsc.org/images/entities/i_char_0070_20d1.gif) or only is the perturbation operator.64,65 is the electric dipole transition moment. Changes in the IC rate constant can be more than one order of magnitude but occur only at very strong electrical fields of 109–1011 V m−1, whereas changes in the kISC(S1 → T1) rate constant occur only when the molecule is very close to the NP surface. The increase in the kISC(S1 → T1) rate constant is due to changes in the SOC, which is caused by heavy atoms in the NP. However, the excitation energy transfer from the molecule to the NP is much faster than ISC implying that the ISC process can be neclected.
or only is the perturbation operator.64,65 is the electric dipole transition moment. Changes in the IC rate constant can be more than one order of magnitude but occur only at very strong electrical fields of 109–1011 V m−1, whereas changes in the kISC(S1 → T1) rate constant occur only when the molecule is very close to the NP surface. The increase in the kISC(S1 → T1) rate constant is due to changes in the SOC, which is caused by heavy atoms in the NP. However, the excitation energy transfer from the molecule to the NP is much faster than ISC implying that the ISC process can be neclected.
An external electric field induces a dipole moment (![[P with combining right harpoon above (vector)]](https://www.rsc.org/images/entities/i_char_0050_20d1.gif) (ω)) in the NP, whose strength is
(ω)) in the NP, whose strength is ![[E with combining right harpoon above (vector)]](https://www.rsc.org/images/entities/i_char_0045_20d1.gif) 0(ω). The induced dipole moment (ω) is obtained from the polarizability
0(ω). The induced dipole moment (ω) is obtained from the polarizability  of the NP and the strength of the electric field as
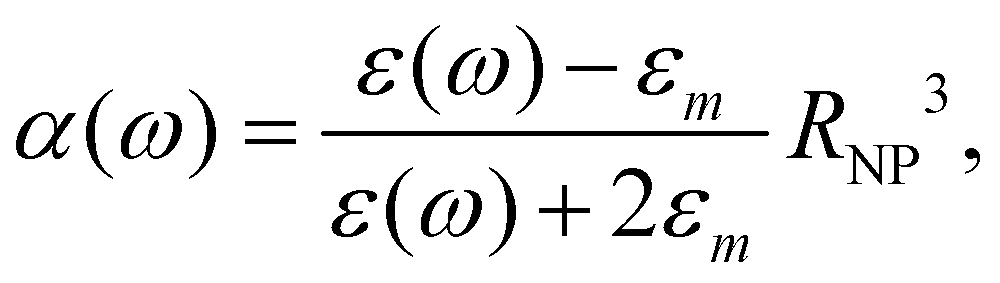
  .0(ω). The frequency-dependent polarizability
  can be estimated by using Sommerfeld–Drude theory:81–85
 | (25) |
 | (26) |
When the molecule is near the NP, the total electric field strength can be written as:
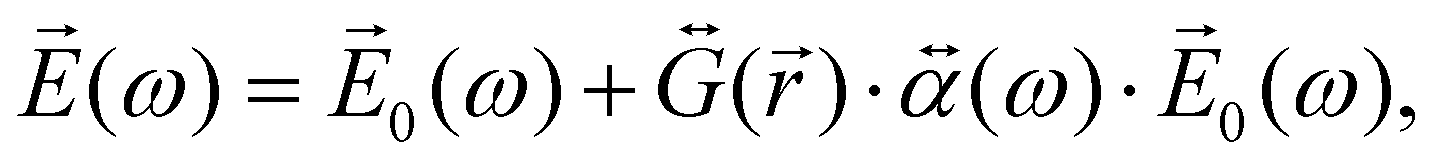 | (27) |
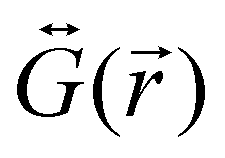 is the dyadic Green's function that in the electric dipole–dipole approximation is given by:
 | (28) |
 is the unit dyadic tensor. When the total electric field () of the molecule–NP system is known, the plasmon-affected radiative rate constant k′(
![[r with combining right harpoon above (vector)]](https://www.rsc.org/images/entities/i_char_0072_20d1.gif) ) can be expressed as:1,56,80
) can be expressed as:1,56,80 | (29) |
is the electric dipole transition moment. Thus, the plasmon-affected radiative rate constant k′() consists of three terms, where the first one is kri.e., the rate constant in the absence of the NP, the second term depends on 1/d6 and the third cross term can be positive or negative and depends on 1/d3, where d is the distance between the molecule and the NP.
The changes in kr affect  in eqn (19) and make the rate constant also dependent on d. The energy transfer occurs when the molecule is near the NP. We recently showed that the ktransfer rate constant from S1 to the NP can for short distances be written as:56
 | (30) |
 . The ktransfer rate constant can generally be written as:1,4,79,80
 | (31) |
) in eqn (31), there are two terms whose distance dependency are 1/d3 and 1/d6, respectively, which can be combined to one ktransfer(S1).
The ktransfer(S1) rate constant given by eqn (30) and (31) can be easily transformed into ktransfer(T1) by replacing p with  in eqn (30) and (31). The rate constant for the energy transfer from the T1 state of the molecule to the NP and the corresponding quantum yield can then be calculated.
The expression for the phosphorescence quantum yield of a molecule near a NP is then:
 | (32) |
The kIC(S1 → S0) rate constant can also increase due to the external electric field64,65 leading to the changes in IC(1 → 0). In this work, we have estimated this effect on Rh123 and Rh123-2Br. In the experimental studies, we use a laser with power of 0.004 W and a cross section of the beam of 0.0785 cm2 yielding an electric field of 107 V m−1. We estimate the plasmon enhancement effect on the external electric field using eqn (27). The total external field can reach 8 × 10⁷ V m−1 when the distance is 2–9 nm between the molecule and the NP. However, this electric field is still too weak to significantly increase the kIC(S1 → S0) rate constant, at least for the studied molecules. Calculations of the induced effect on kIC(S1 → S0) show that the rate constant change by more than one order of magnitude when the electric field is 5 × 10⁸ V m−1 and 1010 V m−1 for Rh123-2Br and Rh123, respectively.
We used the X–H approximation in the calculation of the changes in kIC(S1 → S0) that are induced by the electric field. The  (NACME + ) operator is used as the perturbation operator in the second-order perturbation theory expression.64 Thus, we neglect changes in kIC(S1 → S0) and in IC(1 → 0).
The employed parameters of the spherical silver NP are: RNP = 47.3 nm, εm = 3.5, γ = 2.5 × 10¹³ s−1, and n0 = 5.78 × 10¹³ m−3. The molecular parameters are calculated using quantum chemical methods as described in the next section.
3.4. Computational details
The optimization of the molecular structures (shown in Fig. 2), calculations of the second derivatives of the potential energy surface (Hessian) of the singlet and triplet states, and calculations of the NACME were performed at the DFT and TD DFT levels for the ground and excited states using the MN15 functional and the 6-31G(d,p) basis set. The calculations were done with Gaussian 16.86 However, energetically higher-lying electronic states with other spin multiplicities, spin–orbit coupling matrix elements (SOCME) and between them were calculated at the extended multi-configuration quasi-degenerate perturbation theory of second order (XMC-QDPT2)87 level of theory using GAMESS-US.88 We used the XMC-QDPT2 method to ensure that we get accurate energies of the singlet and triplet states, which is important when calculating rate constants. The accuracy of the excitation energies calculated at the TDDFT level is usually not enough for this purpose. 〈ψ(T1)||ψ(Tm)〉, 〈ψ(Sp)||ψ(S0)〉, E(T1) − E(Sp), E(S0) − E(Tm),
  , and
, and  were therefore calculated for 50 singlet and 50 triplet states at the XMC-QDPT2/6-31G(d,p) level using an active space with 12 electrons in 12 orbitals. The largest contributions to the IC(1 → 0) and kphos(1 → 0) rate constants of Rh123 and Rh123-2Br originate from the S1 → S0 and S1 → T1 transitions. For these molecules, it is enough to consider only S1 and T1 when calculating IC(1 → 0) and kphos(1 → 0) using eqn (19) and (21). However, for other molecules, it might be necessary to calculate many singlet and triplet states to obtain accurate rate constants.
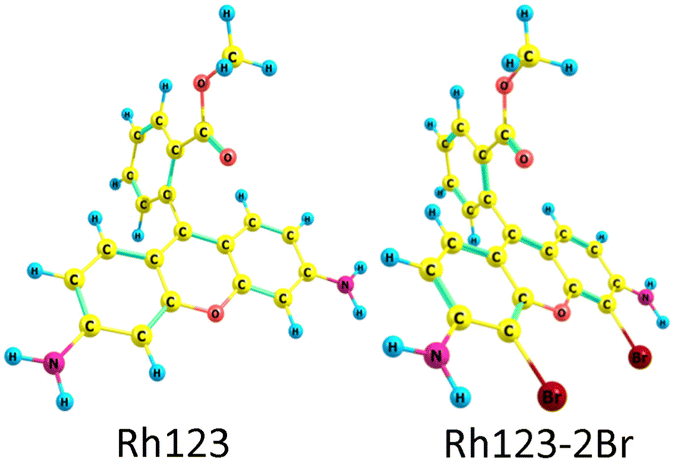 | ||
| Fig. 2 Optimized molecular structures of Rh123 and Rh123-2Br. | ||
4. Results and discussion
4.1. Photophysical properties in the absence of plasmonic NPs
The normalized absorption and fluorescence spectra or Rh123 and Rh123-2Br in polymer films are shown in Fig. 3(a). The molecules absorb between 400 and 650 nm.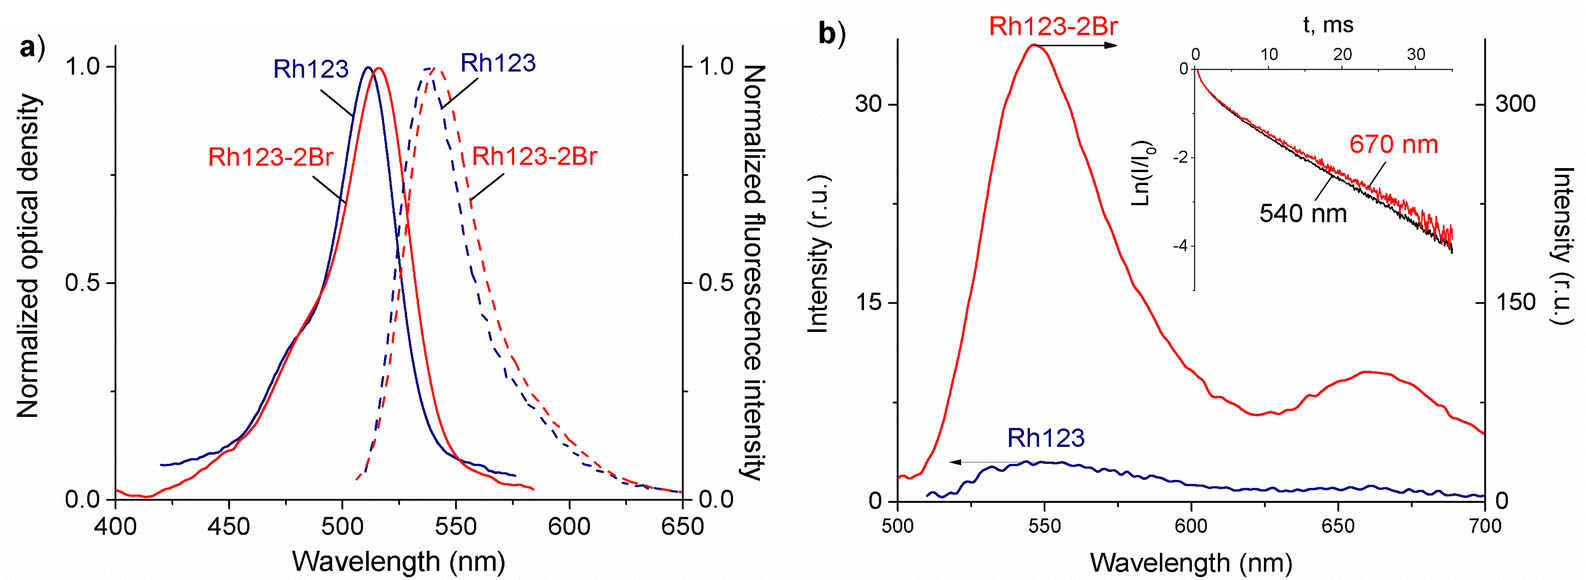 | ||
| Fig. 3 (a) Normalized absorption (solid curves) and fluorescence (dashed curves, λexc = 490 nm) spectra and (b) the DF and phosphorescence (long-lived luminescence) spectra of Rh123 and Rh123-2Br in PVA films at T = 293 K. Inset: The decay rate of the DF measured at λreg = 540 nm, which is near the fluorescence maximum, and at λreg = 670 nm, which is near the phosphorescence maximum of Rh123-2Br. The different fluorescence and delayed luminescence intensities of Rh123 is due to the larger quantum yield of fluorescence (φfl) of 84% as compared to the quantum yield of phosphorescence (φph) of 16%. | ||
The maximum of the absorption spectrum (λmaxabs) of Rh123 is at 510 nm, and the fluorescence maximum (λmaxfl) is at 535 nm. The absorption and fluorescence spectra of its brominated analog are slightly red shifted with the maximum of the absorption and fluorescence band at 515 nm and 540 nm, respectively. The fluorescence lifetime that is estimated from the decay rate is τfl = 3.48 ± 0.05 ns for Rh123 and τfl = 2.10 ± 0.05 ns for Rh123-2Br.
There are two bands in the spectrum of the long-lived luminescence of the dye film (Fig. 3(b)). The position and maximum of the first luminescence band coincides with the maximum of the fast fluorescence and is due to delayed fluorescence (DF), whereas the wide band with a maximum at ∼680 nm is due to phosphorescence.
The DF and the phosphorescence decay exponentially with a single exponent. The DF lifetime (τDF) is shorter than the one for the phosphorescence (τphos). The phosphorescence of Rh123-2Br is stronger than for Rh123. The IDF/Iphos intensity ratio for Rh123-2Br is 3.6 and 2.6 for Rh123. The intensity of the long-lived luminescence of Rh123-2Br is almost an order of magnitude higher than for Rh123. The luminescence lifetime is shorter for Rh123-2Br than for Rh123 (Table 1). The shorter fluorescence lifetime of Rh123-2Br is due to a faster decay of the S1 state. It decays not only to S0 but also to the T1 state due to the larger ISC rate constant caused by the heavy atom effect of Br.49 The shorter DF and phosphorescence lifetimes of Rh123-2Br is due to the faster decay rate of the T1 state to both S0 and S1 because of the stronger SOC of the brominated chromophore.
| Dye | λ maxabs, nm | λ maxfl, nm | τ fl, ns | φ fl | τ DF, ms | τ phos, ms |
|---|---|---|---|---|---|---|
| Rh123 | 510 | 535 | 3.48 ± 0.05 | 0.84 | 9.8 ± 0.3 | 13.6 ± 0.3 |
| Rh123-2Br | 515 | 540 | 2.10 ± 0.05 | 0.40 | 6.3 ± 0.3 | 7.5 ± 0.3 |
The triplet character of the long-lived luminescence was confirmed by temperature measurements and by quenching with molecular oxygen. The emission bands were quenched when injecting air into the evacuated chamber of the cryostat. The phosphorescence intensity decreased when the films were heated to 360 K. The DF, which is a result of the RISC from T1 to S1, has the opposite behaviour (Fig. 4). The Boltzmann population of the vibrational levels of the T1 state leads to stronger DF intensity and quenched phosphorescence when increasing temperature.
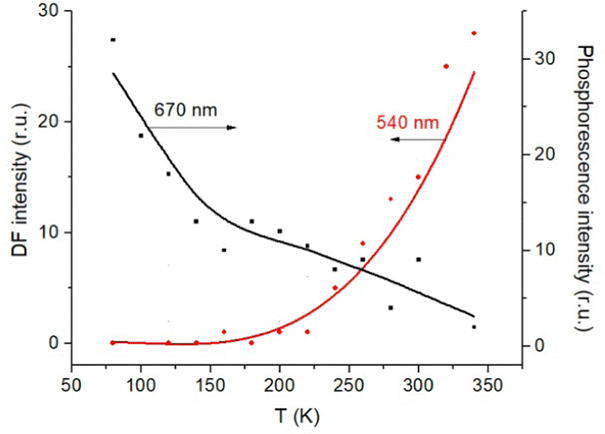 | ||
| Fig. 4 Temperature dependence of the DF and phosphorescence of Rh123-2Br in the polymer film. | ||
The obtained data indicate that triplet states are formed upon photoexcitation of the rhodamine films due to a fast singlet–triplet ISC transition. The triplet state decays through direct radiative transition (phosphorescence with an energy of hνphos) and reverse ISC from T1 to S1, which is followed by delayed fluorescence emission with an energy of hνDF. Since the phosphorescence efficiency is proportional to the number of molecules in the T1 state, its lifetime should be about the same as the radiative lifetime of S1.
However, the ratio between the two relaxation pathways is difficult to measure, which suggests that triplet–triplet annihilation may also contribute to the DF. This process occurs when the concentration of rhodamine is sufficiently high in the polymer film.
The calculated energy levels of the S1 and T1 states of the molecule (Table 2) correlate well with experimental data for the S1 → S0 and T1 → S0 transitions (Table 1). The discrepancy between the calculated and experimental energies of the S1 state is smaller than 0.1 eV, and for the T1 state it is 0.2 eV. Only one triplet (T1) lies below the S1 state. The energy difference between the S1 and T1 states (ΔEST) is 2661 and 1855 cm−1 for Rh123 and Rh123-2Br, respectively. The kISC(S1 → T1) rate constant for Rh123-2Br is two orders of magnitude larger than for Rh123 since the 〈S1|HSO|T1〉 matrix element for the brominated molecule is almost twice the one for Rh123. The 〈T1|HSO|S0〉 matrix element of Rh123-2Br is three times larger than for Rh123. Reverse ISC from T1 to S1 does not affect the total lifetime of T1 because the energy difference between the two states is too large for reverse ISC.
1 → 0)) of the studied molecules
| Rh123 | Rh123-2Br | |
|---|---|---|
| S1, eV | 2.37 (2.32) | 2.20 (2.30) |
| T1, eV | 2.04 (1.86) | 1.97 (1.85) |
| 〈S1|HSO|T1〉, cm−1 | 0.26 | 0.55 |
| 〈T1|HSO|S0〉, cm−1 | 0.33 | 1.09 |
| k ISC(S1 → T1), s−1 | 5 × 10⁶ | 1 × 10⁷ |
| k IC(S1 → S0), s−1 | 2 × 10⁷ | 8 × 10⁷ |
| k r(S1 → S0), s−1 | 2 × 10⁸ (2.4 × 10⁸) | 1 × 10⁸ (1.9 × 10⁸) |
| φ fi(S1 → S0), s−1 | 0.90 (0.84) | 0.55 (0.40) |
| k ISC(T1 → S0), s−1 | 3 × 10⁻⁷ | 3 × 10⁻⁶ |
| k phos(Ť1→ Š0), s−1 | 1.2 (1.2) | 1.5 (1.04 × 10²) |
| k RISC(T1 → S1), s−1 | 5 | 5 × 10² |
| k IC(Ť1 → Š0), s−1 | 5 × 10⁻³ | 1 × 10⁻¹ |
| k RIC(T1 → T2), s−1 | 1 × 10⁻⁹ | 90 |
| φ phos(Ť1→ Š0), s−1 | 0.23 | 0.002 |
The phosphorescence rate constants kphos(1 → 0) estimated using eqn (19) are 1.2 and 1.5 s−1 for Rh123 and Rh123-2Br, respectively, which correspond to lifetimes of 833 and 666 ms. Since the typical lifetime of the T1 state of organic molecules is in the millisecond range, the phosphorescence is not the only relaxation pathway of the T1 state.
The calculated rate constants of the reverse ISC (kRISC(T1 → S1)) at room temperature are 5 and 5 × 10² s−1 for Rh123 and Rh123-2Br, respectively. At 80 K, these processes cannot determine the total lifetime of the T1 state due to the slow reverse ISC transition from T1 to S1. When ΔEST < 1000 cm−1, thermally activated DF can occur thanks to a fast reverse ISC from T1 to S1,75,89–92 which is also observed in the present measurements.
The calculations show that T2 lies above S1 for both molecules. For Rh123-2Br, the reverse IC transfer from T1 to T2 is also possible with a rate constant of kRISC(T1 → T2) ∼ 90 s−1. The reverse IC is an additional deactivation channel of the T1 state. The most significant photophysical processes for Rh123 and Rh123-2Br with corresponding rate constants and the energy of the involved states are shown in Fig. 5.
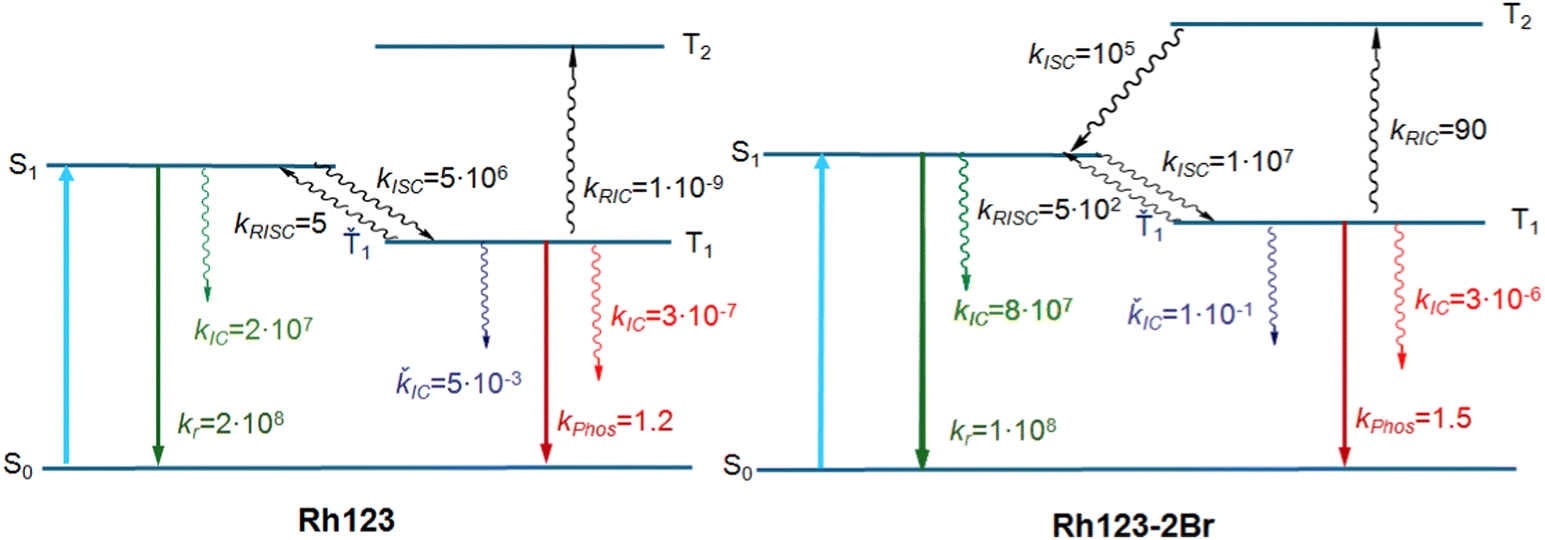 | ||
| Fig. 5 The Jablonsky diagram of Rh123 and Rh123-2Br. | ||
The rate constants of the radiative decay of S1 as well as the calculated values of φfl(S1 → S0) agree well with the ones estimated from the ratio between the measured fluorescence quantum yield and the fluorescence lifetime of rhodamine dyes using eqn (33):89
 | (33) |
The T1 → S1 RISC process is main deactivation channel of the T1 state at room temperature. The kRISC(T1 → S1) rate constant depends strongly on ΔEST. The quantum yield of phosphorescence (φphos(1 → 0)) of Rh123-2Br is therefore smaller than for Rh123. The experimental φphos(1 → 0) values are not known. The calculated total lifetime of the T1 state (τcalc(T1)) is 1 ms for Rh123-2Br and for Rh123 it is 192 ms, which can be compared to the measured ones of 7.5 ms and 13.5 ms for Rh123-2Br and Rh123, respectively. τcalc(T1) of Rh123-2Br is 7.5 times smaller than the experimental value, whereas for Rh123, the calculated total lifetime of T1 is 14 times larger than the measured one.
The calculated τcalc(T1) for Rh123-2Br is slightly shorter than the experimental value because the calculations underestimate ΔEST leading to a kRISC(T1 → S1) rate constant that is too large. The uncertainty of the calculated ΔEST values does usually not exceed 0.1 eV (800 cm−1).70 Such an uncertainty in the ΔEST of 1800 ± 800 cm−1 affects the kISC(S1 → T1) rate constant by less than an order of magnitude, whereas due to the Boltzmann factor this uncertainty in ΔEST leads to an uncertainty of more than two orders of magnitude in the kRISC(T1 → S1) rate constant for Rh123-2Br. For Rh123, the uncertainty in ΔEST of 2661 ± 800 cm−1 leads to a large uncertainty in kRISC(T1 → S1). The rate constant can vary between 10−1 and 102 s−1. The same holds for kRIC(T1 → T2). Thus, calculations of the total rate constant for T1 can lead to an uncertainty of two to three orders of magnitude because some of the individual relaxation channels depend on the Boltzmann factors that depend strongly on ΔEST.
The kIC(1 → 0) rate constant does not affect the total lifetime of T1 since the kIC(1 → 0) transition is the main decay channel of the T1 state only when E(T1 → S0) is less than 12000 cm−1.62,70 The triplet de-excitation energies of Rh123-2Br and Rh123 are larger than 15000 cm−1. The kIC(1 → 0) rate constant depends in the same way as kIC(S1 → S0) on the energy difference between the two states. The calculations suggest that this channel determines the total lifetime of T1 when its de-excitation energy is less than 12000 cm−1, which will be assessed in a future study.
4.2. Plasmon effect on the luminescence of Rh123 and Rh123-2Br
Measurements show that the shape and position of the absorption and fluorescence bands do not change in the presence of plasmonic NPs. Significant changes in the optical density was not registered either. However, in the presence of plasmonic NPs, the intensity of all kinds of light emission from Rh123 and Rh123-2Br significantly increases (Table 3 and Fig. 6).| Dye | τ SIFfl/τglassfl | τ SIFDF/τglassDF | τ SIFphos/τglassphos |
|---|---|---|---|
| Intensities | |||
| Rh123 | 4.7 | 3.8 | 3.5 |
| Rh123-2Br | 5.6 | 5.4 | 8.2 |
| τ SIFfl/τglassfl | τ SIFDF/τglassDF | τ SIFphos/τglassphos | |
|---|---|---|---|
| Lifetimes | |||
| Rh123 | 0.89 | 0.70 | 0.74 |
| Rh123-2Br | 1.00 | 1.00 | 1.00 |
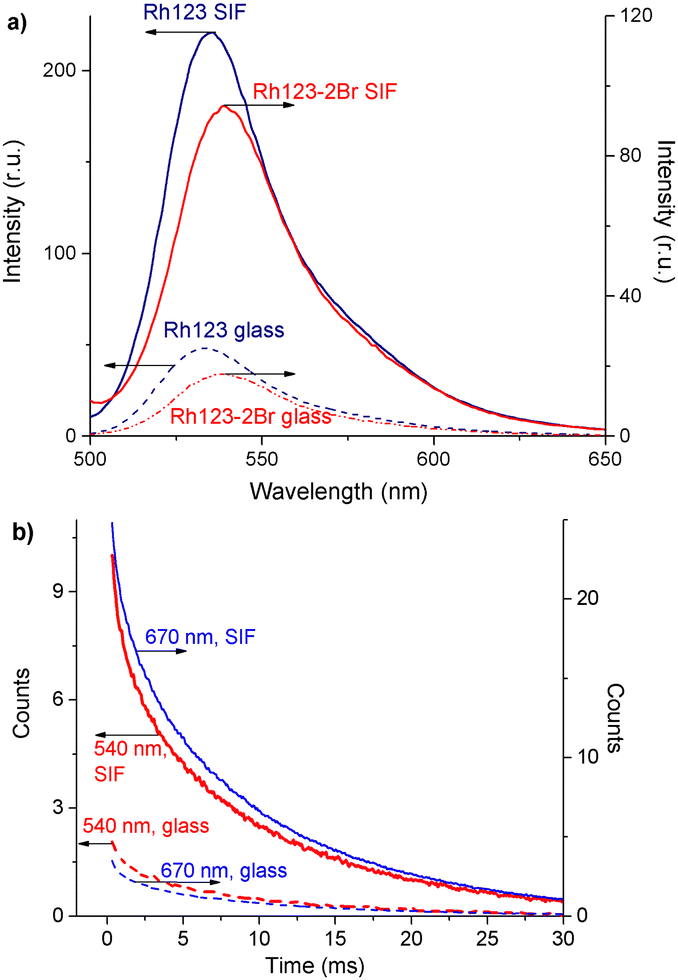 | ||
| Fig. 6 (a) Fluorescence spectra of Rh123 and Rh123-2Br on the glass and SIF surfaces; (b) the time-dependence of the DF (λreg = 540 nm) and phosphorescence (λreg = 670 nm) decay of Rh123-2Br on the glass and SIF surfaces. | ||
The plasmon enhancement factor of the fluorescence of 4.7 and 5.6 is almost the same for Rh123 and Rh123-2Br, respectively. The enhancement is due to the increase in the rate constant of the radiative decay (kr) of the S1 state (Table 4).56
1 → 0) (in s−1) and φphos(1 → 0) values that were obtained in the calculations are also reported
| Dye | k glassr | k SIFr | k SIFr/kglassr | k glassphos | k SIFphos | k SIFphos/kglassphos |
|---|---|---|---|---|---|---|
| Experimental | ||||||
| Rh123 | 2.4 × 10⁸ | 12.7 × 10⁸ | 5.3 | 1.2 | 5.7 | 4.8 |
| Rh123-2Br | 1.9 × 10⁸ | 10.6 × 10⁸ | 5.0 | 1.04 × 10² | 8.84 × 10² | 8.5 |
|
k
phos(1 → 0) |
|
|
φ
phos(1 → 0) |
|
|
|
|---|---|---|---|---|---|---|
| Calculated | ||||||
| Rh123 | 1.2 | 15.2 | 12.7 | 0.23 | 0.66 | 2.9 |
| Rh123-2Br | 1.5 | 39.1 | 26.1 | 0.002 | 0.064 | 32.0 |
The change in the DF and phosphorescence intensity due to the plasmon effect was estimated by integrating the decay curves. The decay of the DF and phosphorescence was measured at 540 nm and 670 nm, respectively.
The enhancement factor of the DF and the phosphorescence for Rh123-2Br is larger than for Rh123. The enhancement factor of the phosphorescence intensity for Rh123-2Br is larger than for the DF. The difference is probably due to the fact that DF is a two-step process and the luminescence originates from the S1 → S0 transition as fluorescence. The lifetime of all kinds of luminescence for Rh123 decreases on the surface of the SIF, whereas they are practically unaffected for Rh123-2Br.
The experimental studies show that the plasmon effect is more pronounced for Rh123-2Br than for Rh123 because the intensity-borrowing effect of the T1 → S0 transition from the Sn → S0 transitions is larger for molecules containing heavy atoms (Br).49 The calculated  and φphos(1 → 0) as a function of the distance between the molecule and the NP surface in Fig. 7 shows that the rate constant of phosphorescence and the quantum yield depend on the distance between the molecule and the plasmonic NP. The
  rate constant for Rh123 increases 12.7 times and for Rh123-2Br the phosphorescence is 26.1 times faster in the presence of the NP. At a molecular distance of 10 nm from the surface of the silver NP, the enhancement of the phosphorescence rate constant is a factor of two smaller than when the molecule is close to the NP. The changes in the calculated kphos(1 → 0) values due to the plasmonic NPs correlate with the measured plasmon effect on the phosphorescence rate constants.
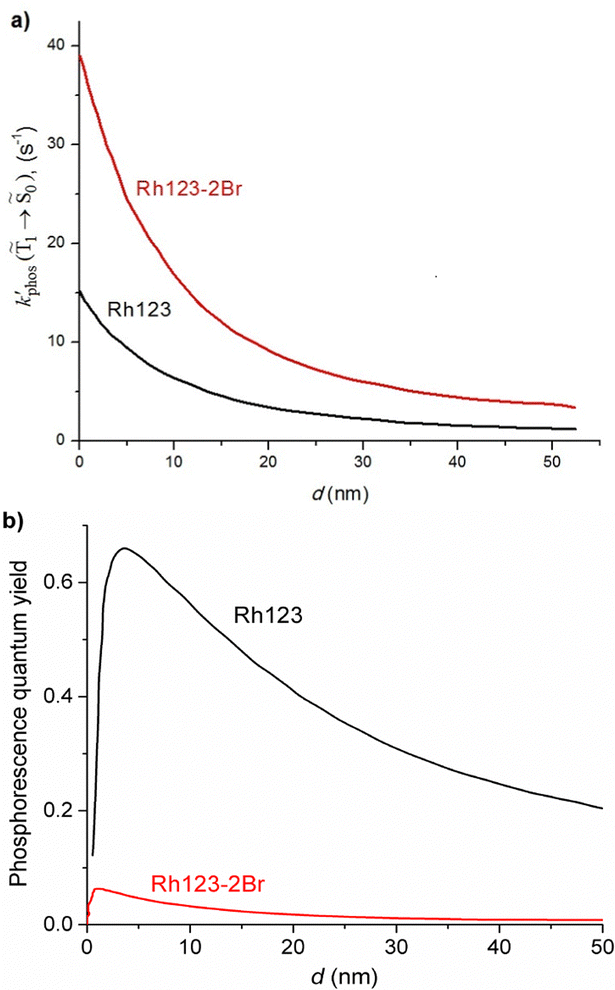 | ||
Fig. 7 The dependence of  and and  on the distance to the surface of the Ag NP. on the distance to the surface of the Ag NP. | ||
The largest  value is obtained for Rh123 when the molecule is 4 nm from the NP and for Rh123-2Br the maximum is at a distance of 2 nm (see Fig. 7(b)). At the maximum, the
  value of Rh123-2Br is 32 times larger than in the absense of the NP and for Rh123 the maximum enhancement factor of the NP is 2.9.
At the distance for the largest enhancement factor, the  rate constant is for Rh123-2Br 30 times larger than without the NP and for Rh123 the rate constant is 10 times larger. The calculated rate constants agree with those obtained experimentally (see Table 4). The plasmon effect on the phosphorescence is significantly larger for Rh123-2Br than for Rh123.
The distance to the NP for the largest  is much shorte than 10–12 nm, where φfl(S1 → S0) reaches its maximum.3,56 The energy transfer from the T1 state to the NP is less efficient than from the S1 state because
  in eqn (30) and (31) is two to three orders of magnitude larger than
  .
.
When the molecule approaches a NP, the quantum yield from S1 to T1 decreases due to an efficient energy transfer from S1 to the Ag NP that appears at a distance of 10–12 nm. The rate constant for this process is 1010–1011 s−1, which is much faster than the kISC(S1 → T1) process at a distance of 5–6 nm. The population of T1 is significantly smaller at this distance, where the efficiency of the phosphorescence enhancement also decreases due to the smaller probability for populating the T1 state as compared to the energy transfer from S1 to the NP.
5. Conclusions
A theoretical model is proposed that enables estimation of the quantum yield of phosphorescence of a molecule near a plasmonic NP. The rate constants of radiative (kr, kphos) and nonradiative intramolecular transitions (kIC, kISC, kRISC) are calculated for estimating the quantum yields of fluorescence and phosphorescence. The developed model was tested on rhodamine and brominated rhodamine. Calculations of the lowest excitation energies yielded values in good agreement with experimental data for the S1 → S0 and T1 → S0 transitions. The calculated fluorescence quantum yields are also in good agreement with experimental values.The energy difference between the S1 and T1 states (ΔEST) is 2661 and 1855 cm−1 for Rh123 and Rh123-2Br, respectively leading to a kISC(S1 → T1) rate constant for Rh123-2Br that is two orders of magnitude larger than for Rh123. The Br atoms of Rh123-2Br increase the spin–orbit coupling matrix elements 〈T1|HSO|S0〉 and 〈S1|HSO|T1〉 by a factor of 3 and 2 as compared to those of Rh123. However, the kISC(T1 → S0) rate constant does not significantly affect to the total lifetime of the triplet state because the transition is very slow due to the large excitation energy of the triplet state.
The kRISC(T1 → S1) rate constant of Rh123-2Br is two orders of magnitude larger than for Rh123. The larger rate constant of reverse ISC for Rh123-2Br leads to a significantly smaller quantum yield of phosphorescence than for Rh123. The reversed ISC process from T1 to S1 that enables thermally activated delayed fluorescence is also observed experimentally.
The luminescence processes of the studied molecules are faster in the presence of a plasmonic NP. The plasmonic effect increases the rate of the direct fluorescence by a factor of 5. The plasmonic effect on the delayed fluorescence (DF) and phosphorescence is larger for Rh123-2Br than for Rh123 because the intensity borrowing of the spin-forbidden triplet–singlet transition (T1 → S0) from the spin-allowed allowed Sn → S0 transitions is more significant for molecules with heavy atoms. The largest increase in the phosphorescence efficiency is obtained when the molecule is 4–5 nm from the NP surface, which also agrees with experimental observations.47
The results obtained in the present study support the design of plasmon-enhanced nanostructures that can be used in light-emitting media, in organic light emitting diodes (OLED), in photovoltaic devices and as catalysts for producing singlet oxygen.
Author contributions
All authors have discussed the results and contributed to the final manuscript. N. I.: conceptualization, methodology, resources, project administration, writing – review and editing; R. V.: methodology, conceptualization, calculations; modelling, data validation and visualization, software, writing – original draft; E. S.: investigation, data curation, data validation and visualization, writing – original draft; E. M.: investigation, formal analysis; R. N.: calculations; modelling, data validation and visualization; D. S.: conceptualization, data validation, writing – review and editing.Conflicts of interest
There are no conflicts to declare.Acknowledgements
This research is funded by the Science Committee of the Ministry of Science and Higher Education of the Republic of Kazakhstan (Grant No. AP14870117). This work has been supported by the Academy of Finland through projects 340582 (RRV) and 340583 (DS). We thank CSC – IT Center for Science, Finland for computer time.References
- L. Novotny and B. Hecht, Principles of Nano-Optics, Cambridge University Press, Cambridge, 2006 Search PubMed.
- R. K. Harrison and A. Ben-Yakar, Opt. Express, 2010, 18, 22556–22571 CrossRef CAS PubMed.
- P. Anger, P. Bharadwaj and L. Novotny, Phys. Rev. Lett., 2006, 96, 113002 CrossRef PubMed.
- E. Seliverstova, N. Ibrayev, G. Omarova, A. Ishchenko and M. Kucherenko, J. Lumin., 2021, 235, 118000 CrossRef CAS.
- C. D. Geddes and J. R. Lakowicz, J. Fluoresc., 2002, 12, 121–129 CrossRef.
- V. Krivenkov, P. Samokhvalov, I. Nabiev and Y. P. Rakovich, J. Phys. Chem. Lett., 2020, 11, 8018–8025 CrossRef CAS PubMed.
- P. Kumbhakar, S. Biswas and P. Kumbhakar, RSC Adv., 2019, 9, 37705 RSC.
- N. K. Ibrayev and A. K. Aimukhanov, Opt. Laser Technol., 2019, 115, 246–250 CrossRef CAS.
- E. V. Seliverstova and N. K. Ibrayev, J. Phys.: Conf. Ser., 2016, 735, 012018 CrossRef.
- A. K. Aimukhanov and N. K. Ibrayev, J. Lumin., 2018, 204, 216–220 CrossRef CAS.
- P. C. Lee and D. Meisel, J. Phys. Chem., 1982, 86, 3391–3395 CrossRef CAS.
- G. A. Baker, J. Am. Chem. Soc., 2005, 127, 14118–14119 CrossRef CAS.
- Y. Wang and T. Ding, Nanoscale, 2019, 11, 10589–19594 RSC.
- F. Shaik, I. Peer, P. K. Jain and L. Amirav, Nano Lett., 2018, 18, 4370–4376 CrossRef CAS PubMed.
- R. Ranjan, E. N. Esimbekova, M. A. Kirillova and V. A. Kratasyuk, Anal. Chim. Acta, 2017, 971, 1–13 CrossRef CAS PubMed.
- E. V. Seliverstova, N. K. Ibrayev and A. Z. Zhumabekov, Opt. Spectrosc., 2020, 128, 1449–1457 CrossRef CAS.
- R. Knoblauch, B. Bui, A. Raza and C. D. Geddes, Phys. Chem. Chem. Phys., 2018, 20, 15518–15527 RSC.
- J. Niklas, A. Agostini, D. Carbonera, V. M. Di and W. Lubitz, Photosynth. Res., 2022, 152, 213–234 CrossRef CAS PubMed.
- P. S. Maharjan and H. K. Bhattarai, J. Oncol., 2022, 2022, 7211485 Search PubMed.
- A. A. Ishchenko and A. T. Syniugina, Theor. Exp. Chem., 2023, 58, 373–401 CrossRef CAS.
- J. Dolanský, P. Henke, Z. Malá, L. Žárská, P. Kubát and J. Mosinger, Nanoscale, 2018, 10, 2639–2648 RSC.
- T. Maisch, J. Baier, B. Franz, M. Maier, M. Landthaler, R. M. Szeimies and W. Bäumler, Proc. Natl. Acad. Sci. U. S. A., 2007, 104, 7223–7228 CrossRef CAS PubMed.
- B. Minaev, Arch. Pulmonol. Respir. Care, 2022, 8, 028–033 CrossRef.
- M. P. Rayaroth, U. K. Aravind, G. Boczkaj and C. T. Aravindakumar, Chemosphere, 2023, 345, 140203 CrossRef CAS PubMed.
- A. Sagadevan, K. Ch Hwang and M.-D. Su, Nat. Commun., 2017, 8, 1812 CrossRef PubMed.
- R. Schmidt, Photochem. Photobiol., 2006, 82, 1161–1177 CrossRef CAS PubMed.
- M. Bregnhøj, M. Prete, V. Turkovic, A. U. Petersen, M. B. Nielsen, M. Madsen and P. R. Ogilby, Methods Appl. Fluoresc., 2020, 8, 014001 CrossRef PubMed.
- J. E. Guillet, J. Sherren, H. M. Gharapetian and W. K. MacInnis, J. Photochem., 1984, 25, 501–509 CrossRef CAS.
- F. Li, A. J. Gillett, Q. Gu, J. Ding, Z. Chen, T. J. H. Hele, W. K. Myers, R. H. Friend and E. W. Evans, Nat. Commun., 2022, 13, 2744 CrossRef CAS PubMed.
- L. E. de Sousa, L. dos Santos Born, P. H. de Oliveira Neto and P. de Silva, J. Mater. Chem. C, 2022, 10, 4914–4922 RSC.
- L. Naimovičius, P. Bharmoria and K. Moth-Poulsen, Mater. Chem. Front., 2023, 7, 2297–2315 RSC.
- J. Jin, T. Yu, J. Chen, R. Hu, G. Yang, Y. Zeng and Y. Li, Curr. Opin. Green Sustainable Chem., 2023, 43, 100841 CrossRef CAS.
- C. Gao, A. Shukla, H. Gao, Z. Miao, Y. Zhang, P. Wang, G. Luo, Y. Zeng, W. W. H. Wong, T. A. Smith, S. C. Lo, W. Hu, E. B. Namdas and H. Dong, Adv. Mater., 2023, 35, 2208389 CrossRef CAS PubMed.
- E. B. Namdas, B. B. Y. Hsu, Z. Liu, S. C. Lo, P. L. Burn and I. D. W. Samuel, Adv. Mater., 2009, 21, 4957–4961 CrossRef CAS PubMed.
- H. Mishra, B. L. Mali, J. Karolin, A. I. Dragan and C. D. Geddes, Phys. Chem. Chem. Phys., 2013, 15, 19538–19544 RSC.
- Y. Zhang, K. Aslan, M. J. R. Previte, S. N. Malyn and C. D. Geddes, J. Chem. Phys. B, 2006, 110, 25108–25114 CrossRef CAS PubMed.
- M. Meng, F.-L. Zhang, J. Yi, L.-H. Lin, C.-L. Zhang, N. Bodappa, C.-Y. Li, S.-J. Zhang, R. F. Aroca, Z.-Q. Tian and J.-F. Li, Anal. Chem., 2018, 90, 10837–10842 CrossRef CAS PubMed.
- S. Bidault, A. Devilez, V. Maillard, L. Lermusiaux, J.-M. Guigner, N. Bonod and J. Wenger, ACS Nano, 2016, 10, 4806–4815 CrossRef CAS PubMed.
- H. Wang, J. Jung, K. Chung, J. W. Lim, Y. You, J. Kim and D. H. Kim, J. Appl. Phys., 2017, 122, 153103 CrossRef.
- R. Lakshmanan, N. C. Shivaprakash and S. Sindhu, J. Lumin., 2018, 196, 136–145 CrossRef CAS.
- X. Cao, B. Hu, R. Ding and P. Zhang, Phys. Chem. Chem. Phys., 2015, 17, 14479–14483 RSC.
- N. L. Pacioni, M. González-Béjar, E. Alarcón, K. L. McGilvray and J. C. Scaiano, J. Am. Chem. Soc., 2010, 132, 6298–6299 CrossRef CAS PubMed.
- B. V. Enustun and J. Turkevich, J. Am. Chem. Soc., 1963, 85, 3317–3328 CrossRef CAS.
- N. Takeshima, K. Sugawa, H. Tahara, S. Jin, H. Wakui, M. Fukushima, K. Tokuda, S. Igari, K. Kanakubo, Y. Hayakawa, R. Katoh, K. Takase and J. Otsuki, ACS Nano, 2019, 13, 13244–13256 CrossRef CAS PubMed.
- J. Ostrowski, A. Mikhailovsky, D. Bussian, M. Summers, S. Buratto and G. Bazan, Adv. Funct. Mater., 2006, 16, 1221–1227 CrossRef CAS.
- C. Seo, J. Lee, M. S. Kim, Y. Lee, J. Jung, H.-W. Shin, T. K. Ahn, G. Sun, J. Kim and J. Kim, Chem. Phys. Lett., 2017, 676, 134–139 CrossRef CAS.
- D. Temirbayeva, N. Ibrayev and M. Kucherenko, J. Lumin., 2022, 243, 118642 CrossRef CAS.
- T. M. Chmereva, M. G. Kucherenko, F. Yu Mushin and A. P. Rusinov, J. Appl. Spectrosc., 2024, 91, 1–9 CrossRef CAS.
- S. P. McGlynn, T. Azumi and M. Kinoshita, Molecular Spectroscopy of the Triplet State, Prentice-Hall, Inc., Englewood Cliffs, New Jersey, 1969 Search PubMed.
- R. Valiev, V. N. Cherepanov, G. V. Baryshnikov and D. Sundholm, Phys. Chem. Chem. Phys., 2018, 20, 6121–6133 RSC.
- R. R. Valiev, R. T. Nasibullin, V. N. Cherepanov, A. Kurtsevich, D. Sundholm and T. Kurtén, Phys. Chem. Chem. Phys., 2021, 23, 6344–6348 RSC.
- R. R. Valiev, V. N. Cherepanov, R. T. Nasibullin, D. Sundholm and T. Kurten, Phys. Chem. Chem. Phys., 2019, 21, 18495–18500 RSC.
- R. R. Valiev, B. S. Merzlikin, R. T. Nasibullin, A. Kurtzevitch, V. N. Cherepanov, R. R. Ramazanov, D. Sundholm and T. Kurten, Phys. Chem. Chem. Phys., 2023, 25, 6406–6415 RSC.
- S. Perun, J. Tatchen and C. M. Marian, ChemPhysChem, 2008, 9, 282–292 CrossRef CAS PubMed.
- J. Tatchen and C. M. Marian, Phys. Chem. Chem. Phys., 2006, 8, 2133–2144 RSC.
- N. Kh Ibrayev, E. V. Seliverstova, R. R. Valiev, A. E. Kanapina, A. A. Ishchenko, A. V. Kulinich, T. Kurten and D. Sundholm, Phys. Chem. Chem. Phys., 2023, 25, 22851–22861 RSC.
- W. Feng, L. Xu, X.-Q. Li, W. Fang and Y. Yan, AIP Adv., 2014, 4, 077131 CrossRef.
- J. Cao and Z.-Z. Xie, Phys. Chem. Chem. Phys., 2016, 18, 6931–6945 RSC.
- J. C. Vincenta and F. Furche, Phys. Chem. Chem. Phys., 2013, 15, 18336–18348 RSC.
- G. Baryshnikov, B. Minaev and H. Ågren, Chem. Rev., 2017, 117, 6500–6537 CrossRef CAS PubMed.
- H. Ågren, B. F. Minaev and S. Knuts, J. Phys. Chem., 1994, 98, 3943–3949 CrossRef.
- R. R. Valiev, I. Benkyi, Y. V. Konyshev, H. Fliegl and D. Sundholm, J. Phys. Chem. A, 2018, 122, 4756–4767 CrossRef CAS PubMed.
- R. R. Valiev, B. S. Merzlikin, R. T. Nasibullin, V. N. Cherepanov, D. Sundholm and T. Kurtén, Phys. Chem. Chem. Phys., 2024, 26, 4151–4158 RSC.
- R. R. Valiev, R. T. Nasibullin, B. S. Merzlikin, K. Khoroshkin, V. N. Cherepanov and D. Sundholm, Phys. Chem. Chem. Phys., 2024, 26, 2945–2950 RSC.
- B. Merzlikin, V. Cherepanov, K. Khoroshkin and R. Valiev, Chem. Phys. Lett., 2023, 836, 141032 CrossRef.
- D. N. Butorina, A. A. Krasnovsky, L. P. Savvina and N. A. Kuznetsova, Russ. J. Phys. Chem., 2005, 79, 791–794 CAS.
- R. S. Harapanhalli, A. M. Roy, S. J. Adelstein and A. I. Kassis, J. Med. Chem., 1998, 41, 2111–2117 CrossRef CAS PubMed.
- K. Aslan, Z. Leonenko, J. R. Lakowicz and C. D. Geddes, J. Fluoresc., 2005, 15, 643–654 CrossRef CAS PubMed.
- C. Würth, M. G. González, R. Niessner, U. Panne, C. Haisch and U. R. Genger, Talanta, 2012, 90, 30–37 CrossRef PubMed.
- R. R. Valiev, V. N. Cherepanov, V. Y. Artyukhov and D. Sundholm, Phys. Chem. Chem. Phys., 2012, 14, 11508–115017 RSC.
- R. Valiev, V. N. Cherepanov, G. V. Baryshnikov and D. Sundholm, Phys. Chem. Chem. Phys., 2018, 20, 6121–6133 RSC.
- J. Strickler and R. A. Berg, Chem. Phys. Lett., 1964, 37, 814–822 Search PubMed.
- E. S. Medvedev and V. I. Osherov, Radiationless Transitions in Polyatomic Molecules, Springer-Verlag, Berlin, 1995 Search PubMed.
- C. M. Marian, Wiley Interdiscip. Rev.: Comput. Mol. Sci., 2012, 2, 187–203 CAS.
- R. M. Gadirov, R. R. Valiev, L. G. Samsonova, K. M. Degtyarenko, N. V. Izmailova, A. V. Odod, S. S. Krasnikova, I. K. Yakushchenko and T. N. Kopylova, Chem. Phys. Lett., 2019, 717, 53–58 CrossRef CAS.
- V. G. Plotnikov, Int. J. Quantum Chem., 1979, 16, 527–541 CrossRef CAS.
- V. L. Ermolaev, Opt. Spectrosc., 2016, 121, 567–584 CrossRef CAS.
- R. R. Valiev, R. T. Nasibullin, V. N. Cherepanov, G. V. Baryshnikov, D. Sundholm, H. Ågren, B. F. Minaev and T. Kurtén, Phys. Chem. Chem. Phys., 2020, 22, 22314–22323 RSC.
- A. O. Govorov, J. Lee and N. A. Kotov, Phys. Rev. B: Condens. Matter Mater. Phys., 2007, 76, 125308 CrossRef.
- M. G. Kucherenko and V. M. Nalbandyan, Phys. Proc., 2015, 73, 136–142 CrossRef CAS.
- P. Drude, Ann. Phys., 1900, 306, 566–613 CrossRef.
- P. Drude, Ann. Phys., 1900, 308, 369–402 CrossRef.
- A. Sommerfeld, Z. Med. Phys., 1928, 47, 1–32 CAS.
- O. F. Mossotti, Memorie di matematica e di fisica della Societá italiana delle scienze, Presso La Società Tipografica, Verona, 1850, vol. 2, pp. 49–74 Search PubMed.
- R. Clausius, Die mechanische Behandlung der Electricität, Vieweg + Teubner Verlag, Wiesbaden, 1879 Search PubMed.
- M. J. Frisch, G. W. Trucks, H. B. Schlegel, G. E. Scuseria, M. A. Robb, J. R. Cheeseman, G. Scalmani, V. Barone, G. A. Petersson, H. Nakatsuji, X. Li, M. Caricato, A. V. Marenich, J. Bloino, B. G. Janesko, R. Gomperts, B. Mennucci, H. P. Hratchian, J. V. Ortiz, A. F. Izmaylov, J. L. Sonnenberg, D. Williams-Young, F. Ding, F. Lipparini, F. Egidi, J. Goings, B. Peng, A. Petrone, T. Henderson, D. Ranasinghe, V. G. Zakrzewski, J. Gao, N. Rega, G. Zheng, W. Liang, M. Hada, M. Ehara, K. Toyota, R. Fukuda, J. Hasegawa, M. Ishida, T. Nakajima, Y. Honda, O. Kitao, H. Nakai, T. Vreven, K. Throssell, J. A. Montgomery, Jr., J. E. Peralta, F. Ogliaro, M. J. Bearpark, J. J. Heyd, E. N. Brothers, K. N. Kudin, V. N. Staroverov, T. A. Keith, R. Kobayashi, J. Normand, K. Raghavachari, A. P. Rendell, J. C. Burant, S. S. Iyengar, J. Tomasi, M. Cossi, J. M. Millam, M. Klene, C. Adamo, R. Cammi, J. W. Ochterski, R. L. Martin, K. Morokuma, O. Farkas, J. B. Foresman and D. J. Fox, Gaussian 16, Revision C.01, Gaussian, Inc., Wallingford CT, 2016 Search PubMed.
- A. A. Granovsky, J. Chem. Phys., 2011, 134, 214113 CrossRef PubMed.
- A. A. Granovsky, Firefly version 8.0.0, https://classic.chem.msu.su/gran/firefly/index.html Search PubMed.
- C. A. Parker, Photoluminescence of Solutions, Elsevier Publishing Co., Amsterdam, 1968 Search PubMed.
- C. J. Chiang, A. Kimyonok, M. K. Etherington, G. C. Griffiths, V. Jankus, F. Turksoy and A. P. Monkman, Adv. Funct. Mater., 2013, 23, 739–746 CrossRef CAS.
- T. J. Penfold, F. B. Dias and A. P. Monkman, Chem. Commun., 2018, 54, 3926–3935 RSC.
- R. R. Valiev, B. F. Minaev, R. M. Gadirov, E. N. Nikonova, T. A. Solodova, S. Y. Nikonov, M. B. Bushuev and T. N. Kopylova, Russ. Phys. J., 2016, 58, 1205–1211 CrossRef CAS.
Footnote |
| † Electronic supplementary information (ESI) available. See DOI: https://doi.org/10.1039/d4cp01281j |
| This journal is © the Owner Societies 2024 |