 Open Access Article
1,4-Dihydropyridine-based FA1 site-specific fluorescent probes for the selective detection and quantification of HSA levels in biofluids†
S. Shurooque
Kanneth
a,
V. C.
Saheer
b and
Lakshmi
Chakkumkumarath
 *a
*a
aDepartment of Chemistry, National Institute of Technology Calicut, Calicut-673601, Kerala, India. E-mail: lakshmic@nitc.ac.in
bDepartment of Chemistry, Government College Kasaragod, Vidyanagar, Kasaragod-671123, Kerala, India
First published on 30th July 2024
Abstract
Human serum albumin (HSA) is a multifunctional circulatory protein essential for many physiological processes including oncotic pressure maintenance, ligand/drug binding and transport, antioxidant activity, etc. Abnormal HSA levels in biological fluids have been reported in a variety of clinical disorders, making it a potential biomarker for early diagnosis. Low serum albumin levels have been linked to increased long- and short-term mortality rates in ICU patients. Therefore, quantifying HSA in biofluids such as serum and urine offers a convenient approach for the early identification of underlying clinical conditions and assessing the risk factors. Herein, we report a series of fluorescent 1,4-dihydropyridine (DHP) derivatives for the detection and quantification of HSA in biofluids. Their response towards HSA can be tuned by varying the substituents at the C-4 and the N-1 of the DHP ring. Depending on the nature of the substituents, they generated either a turn-on or ratiometric response with a LoD in low nanomolar or subnanomolar levels. A pair of enantiomers obtained by introducing a chiral center on the N-substituents highlighted the importance of stereochemistry in HSA-ligand interactions. Quantification of HSA in complex biofluids, such as blood serum and urine, was also accomplished using these probes. The high selectivity of some of the probes towards HSA over the homologous BSA allowed the discrimination of these two proteins. The preferred binding location of the probes was the hemin binding site and the detection mechanism was identified as the restriction of intramolecular rotation. Additionally, a prototype of a smartphone-integrated point-of-care device was also fabricated to demonstrate the feasibility of utilizing these probes in clinical settings.
Introduction
Human serum albumin (HSA) is a major component of blood plasma, accounting for more than 50% of the total protein content.1,2 The HSA concentration is in the range of 35–50 mg mL−1 and less than 30 mg L−1 in blood serum and urine, respectively under normal conditions.3,4 HSA is a multifunctional protein with significant physiological relevance. It plays a key role in regulating the oncotic pressure of blood, pH, and maintaining homeostasis.5–8 In addition, they also possess antioxidant properties and transport a variety of endogenous and exogenous ligands such as fatty acids, hormones, drugs, etc.9,10 Hypoalbuminemia is a clinical condition where the level of albumin in the blood serum is less than 3.5 mg mL−1. This condition can occur due to decreased hepatic synthesis, higher catabolism, or leakage from the gastrointestinal tract, kidney, extravascular space, etc.11 Hypoalbuminemia can be a manifestation of many underlying clinical conditions. It is observed in patients with liver cirrhosis, sepsis, COVID-19, malabsorption, and nephrotic syndromes.12,13 Hypoalbuminemia is also reported in cardiovascular diseases and cancer patients in advanced stages.14 Recent studies suggest a strong relationship between hypoalbuminemia and long-/short-term mortality rate in ICU patients.15 The morbidity/mortality is higher in patients having low serum albumin levels. Therefore, measuring the albumin levels can serve as a prognosticator for identifying patients at high risk. Microalbuminuria, a clinical condition with higher albumin levels in urine, is reported in cardiovascular and kidney diseases.16,17 Therefore, quantitative assessment of albumin in biological samples such as serum and urine is diagnostically relevant for an early clinical intervention.Various methodologies based on diverse techniques have been developed for the quantitative estimation of HSA. Commonly employed clinical methods for detecting HSA utilize dye-binding assays, such as the BCG and BCP techniques.18 Due to the non-specific nature of the interactions between these dyes and proteins, they frequently overestimate the level of HSA, resulting in inaccurate outcomes. Methods based on electrochemical, immunochemical, electrophoresis, and liquid chromatography coupled with mass spectrometry have also been developed for HSA detection.19,20 Despite the high efficiency of these techniques, their practical applicability is limited due to the involvement of highly sophisticated instruments, laborious sample preparation procedures, and skilled manpower. Given the importance of HSA estimation in the early diagnosis of various clinical conditions, methods for its quick, accurate, and sensitive detection are required. Fluorescence-based methods have evolved as an attractive alternative that can provide reliable quantitative information.21 The availability of low-cost portable fluorimeters, fluorescence microplate readers, and the ease of fabrication of low-cost point-of-care devices has simplified the detection process making it more viable in clinical settings.
The HSA protein is composed of three homologous domains, labelled as I, II, and III and each of these domains consists of two subdomains, A and B.1,22 HSA possesses several binding sites for a variety of ligands, with three sites being considered important. As per Sudlow's nomenclature, they are designated as site 1 (subdomain IIA), site 2 (subdomain IIIA), and hemin binding site FA1 (subdomain IB).23,24 In addition to these, secondary binding sites are also identified.25 These binding sites provide unique microenvironments with distinct polarity, viscosity, and binding site geometry, which differs from that of the surrounding bulk solution. Therefore, fluorescent probes that detect and quantify HSA are typically sensitive to their surrounding environment and exhibit a change in their intrinsic photophysical properties when bound to the HSA binding sites. The underlying mechanisms in the detection process involve twisted intramolecular charge transfer (TICT), restricted intramolecular rotation (RIR), excited-state intermolecular/intramolecular proton transfer (ESIPT), polarity-dependent emission, etc.26–37 Fluorescent sensors having a donor–acceptor arrangement typically display TICT behaviour. When they bind to HSA, the TICT process is suppressed resulting in either an off–on or a ratiometric response, enabling the detection.35–37 Fluorophores with different emission characteristics in the dispersed and aggregated state can also be used for HSA detection.38–40 HSA-mediated disassembly generates distinct changes in their photophysical profiles. The design of HSA probes has also made use of intermolecular proton transfer, intramolecular proton transfer and ESIPT.26 Additionally, AIE active fluorophores have been employed for HSA detection.31 They exhibit a turn-on behaviour due to the restriction of intramolecular rotation when confined to the binding pockets of HSA.
Fluorescent probes for HSA detection and quantification in blood and urine must have the following characteristics. The probes should be able to generate a rapid, stable, and readable signal on interaction with HSA. Due to the substantial absorption of urine in the UV range (295 nm–390 nm) and its significant autofluorescence in the blue region, it is crucial to ensure that the probes employed for sensing experiments should neither absorb nor emit in these specific regions.41 The pH of urine is known to fluctuate between 4–8, hence it is advisable to use pH-insensitive probes. Additionally, the probes need to be very sensitive because the concentration of HSA in urine is significantly lower than in blood. Only a small percentage of the HSA detection probes meet these requirements and find practical applications.
We recently reported a group of 4-methylene-N-alkyl dihydropyridine derivatives having AIE, viscosity/temperature-dependent emission enhancement, and solid-state emission.42 The AIE, and viscosity/temperature-dependent emission enhancement were attributed to the RIR of substituents at C-2, C-4, C-6, and N-1 of the DHP ring. We anticipated that if these probes could enter the distinct ligand binding pockets of HSA, they might exhibit a turn-on fluorescence response due to RIR. Herein, we detail the detection and quantification of HSA in blood and urine samples using DHP derivatives. The design consists of electron-withdrawing substituents at the C-4 position of the DHP ring and alkyl/alkyl aryl units on the ring nitrogen. The C-4 substituent was found to play a decisive role in the binding process, whereas the N-substituents controlled both the binding and sensitivity. Depending on these substituents, they exhibited either turn-on, ratiometric or no response on interaction with HSA. These probes showed a clear preference towards FA1, a less common location for drug binding. Using a pair of enantiomers with a chiral N-substituent, the role of chirality in HSA–probe interactions was also demonstrated. Additionally, they responded differently to BSA and HSA, which made it possible to discriminate between them. A smartphone-integrated portable point-of-care device was fabricated to illustrate the probes’ potential in real-life applications. The details of these investigations and their conclusion are described in the following sections.
Results and discussion
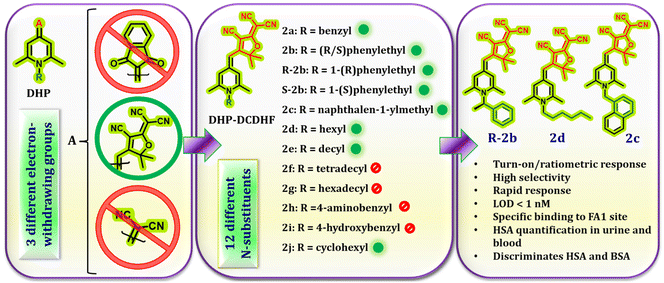
In order to generate a readable signal on interaction with HSA, these probes must have access to the binding sites of HSA, and develop interactions that will hold them in the binding cavity. Therefore, the key factors that determine the probes’ efficiency are their size, geometry, spatial orientation, and the ability to form non-covalent interactions. Initially, we aimed to assess the impact of the C-4 substituent on HSA binding. To accomplish this, we identified three electron-withdrawing substituents, namely dicyanomethylene, 2-dicyanomethylene-3-cyano-2,5-dihydrofuran (DCDHF), and 1,3-indanedione (Fig. 1). These units exhibit distinct electronic features, different sizes and geometry, and differ in their capacity to form non-covalent interactions. The N-alkyl substituent was fixed as a hexyl group. The response of compounds 1d, 2d, and 3d towards HSA was evaluated by recording their emission in the absence and presence of HSA in PBS buffer (1 mM, pH 7.4). Out of these, only compound 2d showed significant emission enhancement, while the other two compounds did not produce a discernible signal. Based on this result, we synthesized a series of compounds 2a–j by varying the N-substituents (Fig. 1) to evaluate their role in HSA detection. The substituents included in this investigation consist of long alkyl chains, alkyl aryl units, 4-hydroxy/4-amino benzyl, and cyclohexyl groups. These substituents were expected to regulate the entry of the probe into the HSA binding sites and contribute to the binding through various non-covalent interactions. A previous research paper from our group presented comprehensive information on the synthesis, characterization and photophysical properties of compounds 2a–g.42 Compounds R-2b, S-2b, and 2h–j were also synthesized following the same strategy and characterized using standard techniques. Their spectral data and photophysical properties are given in the ESI (spectra S1–S11 & Table S1†). As expected, all these compounds exhibited negative solvatochromism, AIE behaviour, and viscosity-dependent emission enhancement (Fig. S1–S6†).HSA detection
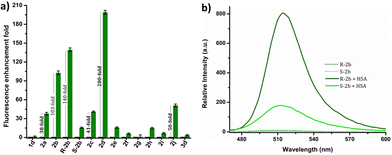
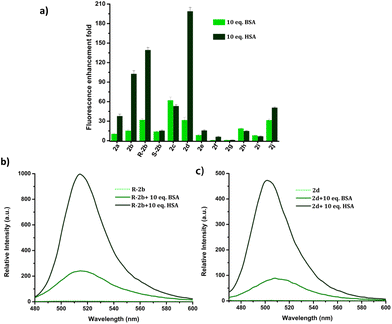
The response of these compounds towards HSA was studied by mixing their solutions in PBS buffer (1 mM, pH 7.4) with 0.5, 1, 5, and 10 eq. of HSA taken in PBS buffer (1 mM, pH 7.4). Fig. S7† clearly shows that compounds 2b, R-2b, 2c, and 2d displayed significant emission enhancement. Compounds 2a and 2j also showed good response, whereas the rest demonstrated a weak response. The relative fluorescence enhancement of each compound in the presence of 10 eq. of HSA is shown in Table 1 and Fig. 2a. Among the N-alkyl derivatives, N-hexyl derivative 2d and the corresponding cyclohexyl derivative 2j exhibited an emission enhancement of 200-fold and 50-fold, respectively. The long alkyl derivative 2e exhibited a weak response, whereas 2f, and 2g were nonresponsive. The emission enhancement observed in alkyl aryl derivatives also varied depending on the substituents. For instance, the N-benzyl derivative 2a showed an enhancement of 38-fold. We anticipated that adding hydroxy or amino groups to the phenyl ring could increase the sensitivity by promoting hydrogen bonding with the amino acids present in the HSA binding sites. Contrary to our expectations, the emission enhancement of 2h and 2i in the presence of HSA was only marginal, 15-fold and 7-fold respectively. However, replacing the benzyl unit with a 1-(naphthalen-1-ylmethyl) unit (2c) resulted in a good emission enhancement of 41-fold on adding HSA. Interestingly, replacing the benzyl group with a 1-phenylethyl unit (2b) led to an emission enhancement of 103-fold. Since 2b was a racemic mixture, we synthesized the individual enantiomers to evaluate the impact of chirality on the binding process. To our surprise, the addition of 10 eq. of HSA to R-2b resulted in an emission enhancement of 140-fold, whereas the corresponding S-enantiomer (S-2b) displayed only a 16-fold enhancement (Fig. 2b). Hence it can be concluded that the response of 2b towards HSA is predominantly due to R-2b. This observation demonstrates the significance of ligand stereochemistry in HSA binding. In prior work, we reported a similar finding about how stereochemistry affects the site-specific binding of 8-aminoBODIPY derivatives to HSA.43| Compound | Relative enhancement in emission intensity | LoD (nM) | QY in presence of 1 eq. of HSAa (%) | Lifetime in presence of HSAb (ns) | |
|---|---|---|---|---|---|
| 1 eq. HSA | 10 eq. HSA | ||||
| a Quantum yield in solution was calculated using equation F = FR (I/IR) (ODR/OD) (η2/ηR2), where F is the emission quantum yield, I is the integrated emission intensity, OD is the optical density, and η is the refractive index. The subscript R refers to the reference fluorophore of known quantum yield. Fluorescein in 0.1 M NaOH (QY = 0.79) was used as the reference. b The average lifetime τ was calculated using equation τ = ∑(αiτi2)/∑(αiτi), where αi is the amplitude of the lifetime component and τi is the respective lifetime value. | |||||
| 2a | 12 | 38 | 2.8 | 1.5 | 3.04 |
| 2b | 51 | 103 | 2.3 | 3.2 | 2.81 |
| R-2b | 84 | 140 | 1.9 | 3.5 | 2.91 |
| S-2b | 6 | 16 | 4.5 | 0.75 | 3.07 |
| 2c | 31 | 41 | 1.4 | 2.9 | 2.84 |
| 2d | 68 | 200 | 0.31 | 2.0 | 2.46 |
| 2e | 8 | 16 | 33 | 1.3 | 3.07 |
| 2j | 21 | 50 | 2.4 | 0.8 | 2.99 |
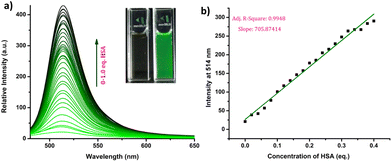
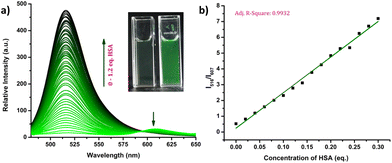
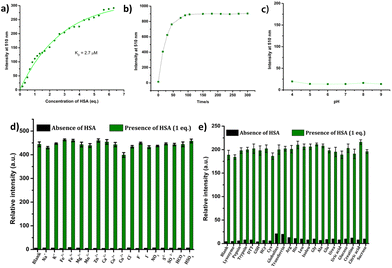
The response of the compounds towards HSA was studied in detail by titrating 1.66 μM solution of the probes in PBS buffer (1 mM, pH 7.4) against HSA solution. For instance, compound R-2b exhibited a very weak emission in the PBS buffer, however incremental addition of HSA resulted in a gradual emission enhancement without any change in λem.max (Fig. 3a). An emission enhancement of 84-fold was observed with the addition of 1 eq. of HSA. The intense green emission developed with the addition of HSA was visible on viewing the solution under a flashlight torch (Fig. 3a, inset). The compound exhibited a linear response to HSA in a concentration range of 33 nM to 660 nM with an R2 value of 0.9948. The detection limit (LoD) calculated using the equation, LoD = 3σ/slope was found to be 1.9 nM and the dissociation constant was estimated as 2.7 μM. Titration of compound 2d with HSA also yielded similar results (Fig. S8†). An emission enhancement of 68-fold was seen upon the addition of 1 eq. of HSA, which was visible when observed under a flashlight. A linear response to HSA was obtained in the concentration range of 33 nM to 330 nM with an R2 value of 0.9837 and the LoD was estimated as 0.31 nM, the lowest among the probes. Repeating the experiments using compounds 2a, 2b, S-2b, 2e, 2h, 2i, and 2j also yielded similar results. They all generated a turn-on response to HSA without any change in the peak position. The titration data and LoDs are given in ESI (Fig. S9–S15, Table 1 & Table S2†). Interestingly, compound 2c exhibited a ratiometric response to HSA. The compound showed weak and broad emissions at 516 nm and 607 nm in the PBS buffer. Adding HSA resulted in a decrease in emission at 607 nm with a concomitant increase in the intensity of the peak at 516 nm (Fig. 4a). A plot of I516/I607vs. the concentration of HSA was linear in the range of 33 nM to 500 nM with an R2 value of 0.9932 and the detection limit was calculated as 1.4 nM (Fig. 4b). In brief, the results of these titrations clearly show that N-substituents significantly alter the probe's response and sensitivity to HSA. Further, the detection limits in the nanomolar levels and the linear response at lower concentrations make them suitable for monitoring HSA levels in blood and urine.
The suitability of fluorescent probes for clinical studies depends upon their ability to generate rapid and stable signals in response to specific analytes. The response time of the probes to HSA was estimated using time-dependent fluorescent studies. All the probes generated a stable signal in less than 2 minutes (Fig. 5b & Fig. S16†). The probes were also found to be insensitive to variations in pH in the range of 4–9 (Fig. 5c & Fig. S17†), which makes them suitable for the detection of HSA in biological samples. To evaluate the possibility of employing them for detecting HSA in blood and urine, we analyzed their response to various serum and urine components, such as metal ions, anions, amino acids, proteins, thiols, etc. As shown in Fig. 5 & Fig. S18–S21,† these probes exhibited high selectivity towards HSA. The interference from various metal ions, anions, amino acids, proteins, thiols, etc., was also found to be negligible.
HSA quantification in serum
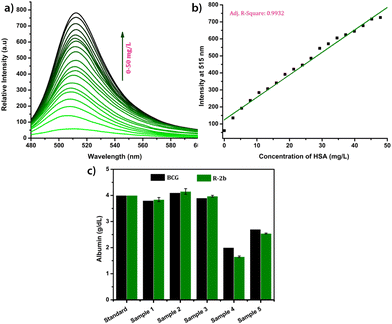
All experiments on serum and urine were performed in accordance with the guidelines of the National Institute of Technology Calicut and approved by the ethics committee at the National Institute of Technology Calicut. Informed consent was obtained from human participants of this study.Due to their superior performance in preliminary studies, R-2b and 2d were used to monitor HSA levels in blood serum. Standard serum from a healthy individual was collected from the National Institute of Technology Calicut Health Centre and diluted 10 times using PBS buffer (1 mM, pH 7.4). The diluted serum (1–20 μL) was added in increments to 1.66 μM probe solution in 3 mL PBS buffer (1 mM, pH 7.4). After each addition, the mixture was allowed to stand for 1 minute and thereafter the fluorescence spectrum was recorded (Fig. 6a). A standard calibration curve was generated by plotting fluorescence intensity against serum concentration (Fig. 6b). To validate the clinical diagnostic capacity of the probes, we conducted HSA measurements using serum samples collected from both healthy individuals and patients diagnosed with hypoalbuminemia. The total HSA concentrations (CHSA) in these samples were determined using the equation CHSA/CSTD = F/FSTD, where CHSA and CSTD are concentrations of HSA in unknown and reference samples, respectively. F and FSTD are the corresponding fluorescence intensities on the addition of a particular volume of serum from the unknown and standard samples. The HSA concentrations thus calculated were consistent with those obtained from the clinical BCG results (Fig. 6c). Each of the measurements was evaluated for accuracy, precision, robustness, and percentage recovery, and was found to be satisfactory (Tables S3–S5†). The studies were repeated with 2d, and the findings were similar to those obtained with R-2b (Fig. S22†). In conclusion, the results of these experiments demonstrated that 2d and R-2b can be effectively employed to estimate HSA levels in the serum of both healthy individuals and hypoalbuminemia patients.
HSA quantification in urine
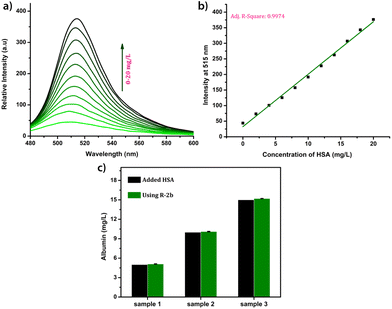
Due to the lower albumin concentration in urine, fluorescent probes used for the urine HSA analysis need high sensitivity. Another challenge in the urinary albumin analysis is the potential interference from urine autofluorescence, particularly when excited in the range of 250–400 nm. Minimizing urine autofluorescence is essential to achieve precise quantitative analysis. Many reported probes have excitation wavelengths below 400 nm, rendering them unsuitable for urine analysis. DHP derivatives reported here have a high sensitivity towards HSA and their excitation wavelength is in the range of 460–480 nm making them ideal candidates for quantification of HSA in urine. In order to assess the feasibility, urine samples of a healthy individual were obtained from the National Institute of Technology Calicut Health Centre and verified for the absence of HSA using clinical tests. The urine samples were then spiked with 3.33 μM HSA (213 mg L−1). The fluorescence responses of R-2b were then measured by adding 0–300 μL of urine (concentrations of HSA 0–21.3 mg L−1). A standard curve obtained by plotting emission intensity at 515 nm vs. the concentration of HSA was found to be linear with an R2 value of 0.997 (Fig. 7). We used this plot to determine HSA in unknown urine samples. Urine samples containing 5 mg L−1, 10 mg L−1, and 15 mg L−1 HSA were added to R-2b and the emissions were recorded subsequently. The concentrations of HSA were determined to be 5.1 mg L−1, 10.1 mg L−1, and 15.2 mg L−1, which closely matched the actual values (Fig. 7c).Mechanism of sensing and binding site determination
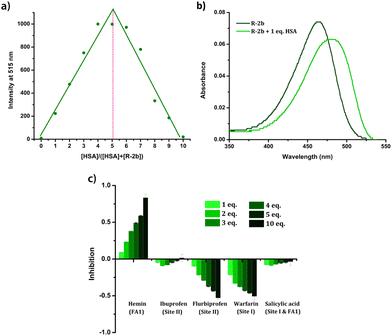
Since HSA presents multiple ligand-binding sites, our initial objective was to determine the binding ratio between the probe and HSA. Job's plot was generated by measuring the emissions of the HSA–probe combinations at different molar ratios (Fig. 8a & Fig. S24†). From Job's plot, it is evident that a binding stoichiometry of 1![[thin space (1/6-em)]](https://www.rsc.org/images/entities/char_2009.gif) :
:![[thin space (1/6-em)]](https://www.rsc.org/images/entities/char_2009.gif) 1 is maintained in all the cases, which is suggestive of a specific binding location on HSA. The binding of the probes in distinct binding pockets of HSA was additionally verified by subjecting the protein to denaturation using urea treatment. The addition of urea (9 M) to the HSA–probe solution caused a considerable decrease in emission due to the loss of specific binding sites on denaturation (Fig. S25†). The evidence for the localization of the probes in the hydrophobic pockets of HSA was also obtained from UV-Vis spectra. The UV-Vis spectra of the probes in the presence of HSA exhibited a redshift (Fig. 8b & Fig. S26†). Since the probes displayed notable negative solvatochromism in their absorption, the observed redshift can be attributed to the localization of the probes in a nonpolar hydrophobic environment. The fact that the interaction of probes with HSA resulted only in emission enhancement without any changes in their λem.max suggests that the enhancement can be attributed to RIR. Additional evidence for RIR was also obtained from the quantum yield and lifetime measurements. In the absence of HSA, the compounds were very weakly emissive in the PBS buffer and we could not determine the quantum yields as well as fluorescence lifetime. However, in the presence of HSA, the quantum yield and lifetime were found to be in the range of 0.75–3.5% and 2.46 ns–3.07 ns (Table 1). The increase in quantum yield and lifetime could be due to RIR which deactivates the nonradiative decay pathways when the probes are held in the binding sites of HSA. Compound 2c, which displayed ratiometric behaviour, has two emission peaks at 516 nm and 607 nm in the PBS buffer. The peak at 607 nm corresponded to the emission of microcrystals formed due to the limited solubility of the compound in aqueous media.42 The decrease in emission of the peak at 607 nm with the addition of HSA could be due to the dissolution of the aggregates in the presence of HSA. Given that the interactions between the probe and HSA are site-specific, we conducted displacement assays to identify the preferred binding location of these probes. The addition of site 1 and site 2 specific drugs such as warfarin, ibuprofen, and flurbiprofen failed to quench the emission of the probe–HSA complex (Fig. 8c & Fig. S27†). This observation indicates that the probes avoid these two major drug-binding sites. However, adding hemin led to a substantial reduction in emission, suggesting the probe's displacement from the FA1 site. From these observations, it can be concluded that the probes preferentially bind to the FA1 site. Since FA1 is not a preferred drug-binding site, specificity to this site potentially eliminates the interference from site 1 and site 2 binding drugs while analyzing blood samples from patients on medication.44 At the same time, an enhancement in the emission of the probe–HSA complex was observed on adding warfarin and flurbiprofen. HSA is a conformationally flexible protein, which is manifested in its ability to accommodate a wide variety of ligands. This conformational flexibility also contributes to the cooperative and allosteric modulation in the ligand binding.45,46 Therefore, when warfarin or flurbiprofen occupies site I, there could be conformational changes that might favorably affect the DHP-HSA interaction at the FA1 site resulting in emission enhancement.
1 is maintained in all the cases, which is suggestive of a specific binding location on HSA. The binding of the probes in distinct binding pockets of HSA was additionally verified by subjecting the protein to denaturation using urea treatment. The addition of urea (9 M) to the HSA–probe solution caused a considerable decrease in emission due to the loss of specific binding sites on denaturation (Fig. S25†). The evidence for the localization of the probes in the hydrophobic pockets of HSA was also obtained from UV-Vis spectra. The UV-Vis spectra of the probes in the presence of HSA exhibited a redshift (Fig. 8b & Fig. S26†). Since the probes displayed notable negative solvatochromism in their absorption, the observed redshift can be attributed to the localization of the probes in a nonpolar hydrophobic environment. The fact that the interaction of probes with HSA resulted only in emission enhancement without any changes in their λem.max suggests that the enhancement can be attributed to RIR. Additional evidence for RIR was also obtained from the quantum yield and lifetime measurements. In the absence of HSA, the compounds were very weakly emissive in the PBS buffer and we could not determine the quantum yields as well as fluorescence lifetime. However, in the presence of HSA, the quantum yield and lifetime were found to be in the range of 0.75–3.5% and 2.46 ns–3.07 ns (Table 1). The increase in quantum yield and lifetime could be due to RIR which deactivates the nonradiative decay pathways when the probes are held in the binding sites of HSA. Compound 2c, which displayed ratiometric behaviour, has two emission peaks at 516 nm and 607 nm in the PBS buffer. The peak at 607 nm corresponded to the emission of microcrystals formed due to the limited solubility of the compound in aqueous media.42 The decrease in emission of the peak at 607 nm with the addition of HSA could be due to the dissolution of the aggregates in the presence of HSA. Given that the interactions between the probe and HSA are site-specific, we conducted displacement assays to identify the preferred binding location of these probes. The addition of site 1 and site 2 specific drugs such as warfarin, ibuprofen, and flurbiprofen failed to quench the emission of the probe–HSA complex (Fig. 8c & Fig. S27†). This observation indicates that the probes avoid these two major drug-binding sites. However, adding hemin led to a substantial reduction in emission, suggesting the probe's displacement from the FA1 site. From these observations, it can be concluded that the probes preferentially bind to the FA1 site. Since FA1 is not a preferred drug-binding site, specificity to this site potentially eliminates the interference from site 1 and site 2 binding drugs while analyzing blood samples from patients on medication.44 At the same time, an enhancement in the emission of the probe–HSA complex was observed on adding warfarin and flurbiprofen. HSA is a conformationally flexible protein, which is manifested in its ability to accommodate a wide variety of ligands. This conformational flexibility also contributes to the cooperative and allosteric modulation in the ligand binding.45,46 Therefore, when warfarin or flurbiprofen occupies site I, there could be conformational changes that might favorably affect the DHP-HSA interaction at the FA1 site resulting in emission enhancement.
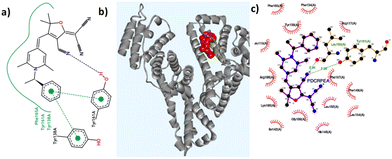
Molecular docking simulations were performed using the AutoDock software to gain a deeper understanding of the binding interactions between the probes and the coordinates of HSA (PDB ID: 1N5U) at its FA1 binding pocket. Detailed binding scores and other data related to docking calculations are available in the ESI (Table S6†). All the molecules showed favourable negative binding energies indicative of a spontaneous binding process leading to a stable adduct. R-2b having a binding score of −12.35 kcal mol−1 showed several interactions including H-bonding with TYR161 and a weak one with SER193 residues, and hydrophobic interactions with nearby residues particularly with TYR138, LEU115, PHE165, LYS190, ARG186, and ILE142 (Table S7†). Favourable π-stacking interactions are also seen with TYR138 and TYR161 as shown in Fig. 9. The molecular docking studies of 2d showed a binding score of −10.91 kcal mol−1 and involved several hydrophobic interactions with amino acid residues and a weak hydrogen bonding interaction with ARG117 (Table S8†). However, no significant π-stacking interactions were seen in this case. Although probes R-2b and S-2b showed different sensitivity toward HSA, their binding score are comparable. This observation suggests that the difference in stereochemistry could be affecting the entry of the probe into the binding site. Details of the docking studies of the remaining molecules are given in the ESI (Fig. S28–S34†). Based on the experimental and molecular docking studies it can assumed that differential binding of the probes to HSA could be arising from the difference in the size of N-substituents. For instance, compounds with long alkyl chains as N-substituents (2e, 2f, and 2g) did not interact with HSA. The overall size of the N-substituents is somewhat equivalent in the rest of the DHP derivatives and they elicited good to excellent responses on interaction with HSA. However, the failure of compounds 2h and 2i having N-4-hydroxybenzyl and N-4-aminobenzyl substituents to detect HSA could be attributed to the probes’ nonspecific attachment to the HSA surface as a result of the presence of –OH and amino groups, which can bring additional secondary interaction.
Discrimination of HSA and BSA
HSA is used in the treatment of hypovolemia and hypoalbuminemia resulting from a range of clinical disorders, as well as surgical procedures and injuries.47 Bovine serum albumin (BSA) is homologous with HSA and has similar functions and physicochemical properties.48 However, these two proteins have only 76% sequence homology and display variations in their binding pocket topologies, surface structure, and charge distribution, which subsequently impact their abilities to bind and transport drugs. Despite these differences, BSA is often used as a substitute for HSA due to its affordability and ready availability. Due to the limited understanding of the biological functions of BSA in humans, its utilization in therapeutic applications may potentially result in disastrous outcomes for patients. Hence it is important to distinguish between BSA and HSA in clinical settings.49–51 The structural and binding site similarities between BSA and HSA pose a challenge in the development of fluorescent probes that can distinguish between the two. The response of DHP derivatives towards BSA and HSA was assessed by adding 10 eq. of these proteins to the probe solutions. Fig. 10 depicts the relative enhancement in emission resulting from the addition of BSA and HSA. For instance, 200-fold emission enhancement was observed on mixing 2d with HSA, however, the corresponding enhancement with BSA was only 31-fold. Similarly, R-2b showed 140-fold enhancement to HSA, whereas only 29-fold enhancement in the presence of BSA. The fluorescence intensity of 2d and R-2b were 6.5 and 4.8 times higher, respectively, in the presence of HSA compared to their intensity in the presence of BSA.Point-of-care device for HSA quantification
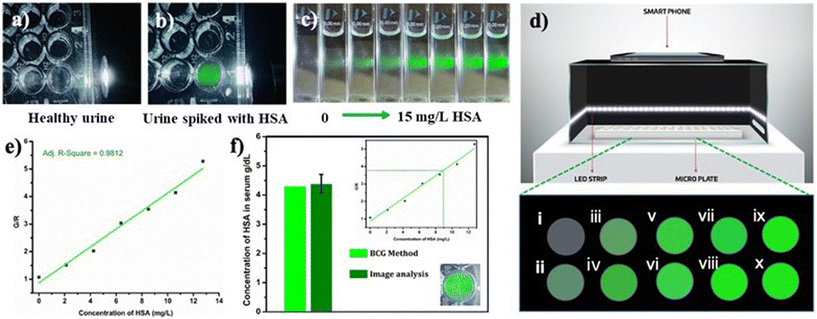
In order to examine the feasibility of developing a prototype of a point-of-care device, a microplate well was filled with 1.66 μM PBS solution of R-2b containing 20 μL urine from a healthy donor. The sample was found to be nonfluorescent when illuminated using a white light LED torch (Fig. 11a). The experiment was repeated using urine spiked with HSA to mimic microalbuminuria. This sample emitted intense green fluorescence when illuminated as mentioned above (Fig. 11b). This observation encouraged us to develop a prototype of a point-of-care device for the quantitative estimation of HSA. The device consisted of a black box to minimize interference from ambient light. The interior of the box was lined with blue or white LED strips as an excitation source and with a provision to integrate a smartphone (Fig. 11d) for capturing the emission from the samples during analysis. In a typical experiment, 96-well nonfluorescent microplate wells were loaded with 1.66 μM solution of R-2b in PBS buffer (1 mM, pH 7.4). To this, an increasing concentration of HSA (0–13 mg L−1) was added and imaged using a smartphone (Fig. 11d). The images obtained were analyzed using a color picker app “Colorgrab” installed in the smartphone by converting them to the corresponding RGB values. As the HSA concentration increased from 0–13 mg L−1, the G/R values also increased linearly. A plot of G/R vs. the concentration of HSA generated a linear response with an R2 value of 0.9812. The lowest detection limit obtained by this method was 0.6 mg L−1 (9.3 nM) using equation 3σ/slope, where σ is the standard deviation of the G/R value of 10 different blank measurements. Using the same protocol, the HSA levels in blood serum were also determined. The fluorescence images of microwells loaded with R-2b containing varying amounts of diluted serum ([HSA] = 4.3 g dL−1 by BCG method) were captured using a smartphone and analyzed using Colorgrab to yield the corresponding G and R values. These G/R values were then extrapolated from the standard curve to obtain the HSA concentration in the serum sample. This method yielded a serum concentration of 4.38 g dL−1, which was consistent with the result obtained using the BCG method.Conclusions
In summary, we have demonstrated the suitability of 1,4-dihydropyridine derivatives for quantitatively estimating HSA in complex biofluids such as blood serum and urine. The response of DHP derivatives toward HSA was tuned by introducing suitable substituents at the C-4 and N-1 positions. Although three different electron-withdrawing units namely, dicyanomethylene, DCDHF, and 1,3-indanedione were introduced at the C-4 position, only DHP-DCDHF exhibited a response towards HSA. Subsequently, a series of DHP-DCDHF derivatives were synthesized by varying the N-1 substituents, which included alkyl, cycloalkyl, and aryl alkyl units. A systematic evaluation of the interaction of the probes with HSA revealed that the N-substituents greatly influenced the probe's sensitivity. Derivatives having long alkyl chains, 4-hydroxybenzyl, and 4-aminobenzyl derivatives as N-substituents were nonresponsive towards HSA. However, other substituents such as hexyl, cyclohexyl, 1-naphthalen-1-ylmethyl, and 1-phenylethyl generated good to excellent responses. These probes generated a turn-on response to HSA except N-naphthalen-1-ylmethyl derivative, which showed a ratiometric behaviour. The role of stereochemistry in tuning the binding has also been demonstrated using a pair of enantiomers obtained by introducing (R/S)-1-phenylethyl group. The R-enantiomer displayed significant emission enhancement in the presence of HSA, whereas the corresponding S-enantiomer elicited a weak response. These probes were pH insensitive, highly selective for HSA, and generated a rapid response with a detection limit in the low nanomolar/subnanomolar levels. The linear change in the fluorescence intensity of the probes in response to HSA in the biologically relevant range allowed us to quantitatively estimate HSA levels in serum and urine obtained from healthy volunteers and patients with hypoalbuminemia. The values obtained were in good agreement with clinical BCG results. Among the several binding sites on HSA, the probes preferred the FA1 binding site as shown by the drug displacement assay. Since the binding of the probes to HSA resulted only in emission enhancement without any peak shift, the detection mechanism was attributed to RIR. Two probes, R-2b and 2d could also distinguish between HSA and BSA because of their distinct responses to these two proteins. A prototype of a smartphone-integrated point-of-care device was also fabricated and successfully used to quantify HSA levels in blood serum and urine.Author contributions
S. S. K.: Synthesis, characterization, photophysical studies, data analysis, manuscript preparation; S. V. C.: molecular docking studies; L. C.: conceptualization, supervision, data analysis, manuscript preparation, review and editing.Data availability
The data supporting this article have been included as part of the ESI.†Conflicts of interest
The authors declare no competing financial interest.Acknowledgements
The authors thank DST-FIST for the HRMS facility at NIT Calicut, and the Centre for Materials Characterization (CMC)-NIT Calicut for the NMR facility. Dr Subi Jacob George (JNCSR) is gratefully acknowledged for allowing us to use his CPL facility. We also thank SAIF, MG University, Kottayam for fluorescence lifetime measurements. S. S. K. thanks CSIR for the fellowship.References
- X. M. He and D. C. Carter, Nature, 1992, 358, 932–935 CrossRef PubMed.
- G. J. Quinlan, G. S. Martin and T. W. Evans, Hepatology, 2005, 41, 1211–1219 CrossRef PubMed.
- Y. T. Yu, J. Liu, B. Hu, R. L. Wang, X. H. Yang, X. L. Shang, G. Wang, C. S. Wang, B. L. Li, Y. Gong, S. Zhang, X. Li, L. Wang, M. Shao, M. Meng, F. Zhu, Y. Shang, Q. H. Xu, Z. X. Wu, D. C. Chen and P. F. Wei, Chin. Med. J., 2021, 134, 1639–1654 CrossRef PubMed.
- J. P. Nicholson, M. R. Wolmarans and G. R. Park, Br. J. Anaesth., 2000, 85, 599–610 CrossRef CAS PubMed.
- J. Van De Wouw and J. A. Joles, Clin. Kidney J., 2022, 15, 624–634 CrossRef CAS PubMed.
- N. Wu, T. Liu, M. Tian, C. Liu, S. Ma, H. Cao, H. Bian, L. Wang, Y. Feng and Q. I. Jianni, Mol. Med. Rep., 2024, 29, 1–15 Search PubMed.
- E. S. Ward, D. Gelinas, E. Dreesen, J. Van Santbergen, J. T. Andersen, N. J. Silvestri, J. E. Kiss, D. Sleep, D. J. Rader, J. J. P. Kastelein, E. Louagie, G. Vidarsson and I. Spriet, Front. Immunol., 2022, 13, 1–13 Search PubMed.
- G. Fanali, A. Di Masi, V. Trezza, M. Marino, M. Fasano and P. Ascenzi, Mol. Aspects Med., 2012, 33, 209–290 CrossRef CAS PubMed.
- G. De Simone, A. Di Masi and P. Ascenzi, Int. J. Mol. Sci., 2021, 22, 1–23 Search PubMed.
- M. Taverna, A. L. Marie, J. P. Mira and B. Guidet, Ann. Intensive Care, 2013, 3, 1–7 CrossRef PubMed.
- S. Smale, I. Forgacs and I. Bjarnason, Encycl. Gastroenterol., 2004, 251–254 Search PubMed.
- A. Rombauts, G. Abelenda-Alonso, A. F. Simonetti, G. Verdejo, Y. Meije, L. Ortega, M. Clemente, J. Niubó, Y. Ruiz, C. Gudiol, C. Tebé, S. Videla and J. Carratalà, Trials, 2020, 21, 1–8 CrossRef PubMed.
- C. J. Wiedermann, Int. J. Mol. Sci., 2021, 22, 4496 CrossRef CAS PubMed.
- S. Arques, Eur. J. Intern. Med., 2018, 52, 8–12 CrossRef CAS PubMed.
- A. Akirov, H. Masri-Iraqi, A. Atamna and I. Shimon, Am. J. Med., 2017, 130, 1465.e11–1465.e19 CrossRef PubMed.
- J. I. Barzilay, Y. M. K. Farag and J. Durthaler, J. Am. Heart Assoc., 2024, 13, 1–14 Search PubMed.
- A. Singh and S. C. Satchell, Pediatr. Nephrol., 2011, 26, 1957–1965 CrossRef PubMed.
- S. E. Smith, J. M. Williams, S. Ando and K. Koide, Anal. Chem., 2014, 86, 2332–2336 CrossRef CAS PubMed.
- J. F. Xu, Y. S. Yang, A. Q. Jiang and H. L. Zhu, Crit. Rev. Anal. Chem., 2022, 52, 72–92 CrossRef CAS PubMed.
- D. Kumar and D. Banerjee, Clin. Chim. Acta, 2017, 469, 150–160 CrossRef CAS PubMed.
- X. Fang, Y. Zheng, Y. Duan, Y. Liu and W. Zhong, Anal. Chem., 2019, 91, 482–504 CrossRef CAS PubMed.
- S. Sugio, A. Kashima, S. Mochizuki, M. Noda and K. Kobayashi, Protein Eng., 1999, 12, 439–446 CrossRef CAS PubMed.
- G. Sudlow, D. J. Birkett and D. N. Wade, Mol. Pharmacol., 1975, 11, 824–832 CAS.
- G. Sudlow, D. J. Birkett and D. N. Wade, Mol. Pharmacol., 1976, 12, 1052–1061 CAS.
- M. Fasano, S. Curry, E. Terreno, M. Galliano, G. Fanali, P. Narciso, S. Notari and P. Ascenzi, IUBMB Life, 2005, 57, 787–796 CrossRef CAS PubMed.
- Z. Xu, M. Zhang, Z. Chen, Y. Zhao, L. Wang, X. Chen, B. Liu and X. Peng, Chem. Commun., 2023, 59, 5775–5778 RSC.
- L. Su, F. Yang, W. Li, H. Li, C. Wang, Q. Wang and L. Yuan, Mater. Chem. Front., 2022, 6, 3084–3093 RSC.
- Y. Wang, F. Huo and C. Yin, J. Phys. Chem. B, 2024, 128, 1121–1138 CrossRef CAS PubMed.
- Z. Chen, Z. Xu, T. Qin, D. Wang, S. Zhang, T. Lv, L. Wang, X. Chen, B. Liu and X. Peng, Sens. Actuators, B, 2024, 398, 134687 CrossRef CAS.
- B. Liu, X. Zhao, M. Zhou, C. Song, C. Zeng, T. Qin, M. Zhang and Z. Xu, Spectrochim. Acta, Part A, 2022, 268, 120666 CrossRef CAS PubMed.
- Y. Yu, Q. T. Gong, W. F. Lu, Y. H. Liu, Z. J. Yang, N. Wang and X. Q. Yu, ACS Appl. Bio Mater., 2020, 3, 5193–5201 CrossRef CAS PubMed.
- M. Zhang, J. Cao, C. Huang, M. Liu, Y. Li, C. Wang and Y. Tu, Dyes Pigm., 2022, 208, 110867 CrossRef CAS.
- J. Fan, Z. Li, Y. R. Zhao, H. C. Wang, X. J. Yan, S. H. Shi, H. B. Liu, C. Z. Xie and J. Y. Xu, Dyes Pigm., 2023, 216, 111330 CrossRef.
- Y. Ke, J. Cao, J. Gong and N. Fu, Sens. Actuators, B, 2022, 352, 131015 CrossRef.
- N. Kang, S. Pei, C. Zhang, G. Zhang, Y. Zhou, L. Fan, Q. J. Yao, W. Wang, S. Shuang and C. Dong, Spectrochim. Acta, Part A, 2021, 250, 119409 CrossRef PubMed.
- W. Yang, C. Liu, S. Lu, S. Cheng, J. Du, Q. Gao, P. Shen, H. Luo, Y. Liu and C. Yang, J. Lumin., 2017, 192, 478–485 CrossRef CAS.
- D. J. Zheng, J. Xu, M. M. Su, Z. G. Sun, Q. C. Jiao, Y. S. Yang and H. L. Zhu, Sens. Actuators, B, 2018, 271, 82–89 CrossRef CAS.
- Z. G. Wang, X. J. Yan, H. B. Liu, D. L. Zhang, W. Liu, C. Z. Xie, Q. Z. Li and J. Y. Xu, J. Mater. Chem. B, 2020, 8, 8346–8355 RSC.
- P. Singh, L. S. Mittal, S. Kaur, S. Kaur, G. Bhargava and S. Kumar, Sens. Actuators, B, 2018, 255, 478–489 CrossRef CAS.
- Z. Luo, T. Lv, K. Zhu, Y. Li, L. Wang, J. J. Gooding, G. Liu and B. Liu, Angew. Chem., Int. Ed., 2020, 59, 3131–3136 CrossRef CAS PubMed.
- M. J. P. Leiner, M. R. Hubmann and O. S. Wolfbeis, Anal. Chim. Acta, 1987, 198, 13–23 CrossRef.
- S. S. Kanneth, D. Mathew, P. Parameswaran, A. K. Sajeev, K. N. N. Unni and L. Chakkumkumarath, J. Org. Chem., 2023, 88, 15007–15017 CrossRef CAS PubMed.
- T. K. Jithinraj, V. C. Saheer and L. Chakkumkumarath, Analyst, 2023, 148, 286–296 RSC.
- W. Deng, Z. Xu, N. Li, T. Lv, L. Wang, M. Li, X. Chen and B. Liu, Int. J. Biol. Macromol., 2024, 261, 1–9 Search PubMed.
- P. Ascenzi, A. Bocedi, S. Notari, G. Fanali, R. Fesce and M. Fasano, Mini-Rev. Med. Chem., 2006, 6, 483–489 CrossRef CAS PubMed.
- K. Yamasaki, S. Hyodo, K. Taguchi, K. Nishi, N. Yamaotsu, S. Hirono, V. T. G. Chuang, H. Seo, T. Maruyama and M. Otagiri, PLoS One, 2017, 12, 1–15 Search PubMed.
- E. Farag and A. Kurz, Fluid Manag., 2016, 1–407 Search PubMed.
- R. Maier, M. R. Fries, C. Buchholz, F. Zhang and F. Schreiber, Cryst. Growth Des., 2021, 21, 5451–5459 CrossRef CAS.
- Y. J. Xu, M. M. Su, H. L. Li, Q. X. Liu, C. Xu, Y. S. Yang and H. L. Zhu, Anal. Chim. Acta, 2018, 1043, 123–131 CrossRef CAS PubMed.
- J. Fan, W. Sun, Z. Wang, X. Peng, Y. Li and J. Cao, Chem. Commun., 2014, 50, 9573–9576 RSC.
- Y. Huyan, X. Nan, H. Li, S. Sun and Y. Xu, Chem. Commun., 2024, 60, 3810–3813 RSC.
Footnote |
| † Electronic supplementary information (ESI) available: Experimental section, synthesis, characterisation, absorption and emission spectra in different solvents, HSA sensing using 2a, 2b, 2d, 2e, and 2h–j, response time, effect of pH, jobs plot analysis, absorption spectra in presence of HSA and molecular docking studies. See DOI: https://doi.org/10.1039/d4an00881b |
| This journal is © The Royal Society of Chemistry 2024 |

