 Open Access Article
Metal-loaded zeolites in ammonia decomposition catalysis†
Kwan Chee
Leung‡
,
Ephraem
Tan‡
,
Guangchao
Li
,
Bryan Kit Yue
Ng
 ,
Ping-Luen
Ho
,
Konstantin
Lebedev
and
Shik Chi Edman
Tsang
,
Ping-Luen
Ho
,
Konstantin
Lebedev
and
Shik Chi Edman
Tsang
 *
*
The Wolfson Catalysis Centre, Department of Chemistry, University of Oxford, Oxford, OX1 3QR, UK. E-mail: edman.tsang@chem.ox.ac.uk
First published on 6th January 2023
Abstract
The viability of using ammonia as a hydrogen storage vector is contingent on the development of catalytic systems active for ammonia decomposition at low temperatures. Zeolite-supported metal catalysts, unlike systems based on supports like MgO or carbon nanotubes (CNTs), are crystalline and lend themselves to analytic techniques like synchrotron X-ray powder diffraction (SXRD) and Rietveld refinement, allowing precise characterisation of catalytic active sites, and therefore mechanistic elucidation. This study focuses on characterising and optimising novel zeolite-supported Ru catalysts for ammonia decomposition, with a focus on the effects of N-substitution on catalyst structure and activity. Characterisation focuses on an unsubstituted and N-substituted Ru–zeolite Y pair with NMR, FTIR, TEM, XRD, XAS, ICP, and BET, demonstrating the successful incorporation of N into the zeolite framework and an enhancement in metal dispersion upon N-substitution. A series of 18 monometallic and bimetallic catalysts is then synthesised on X and USY supports and screened for catalytic activity. Ru is identified as the most active metal for ammonia decomposition. Observed trends suggest catalyst dispersion can be increased with substantially lower metal loadings, and in particular via the formation of stably anchored oligonuclear metal clusters within the zeolite framework, as opposed to much larger nanoparticles (NPs) on its exterior, following N-substitution of the framework. DFT modelling proposes a prismatic Ru6N6 cluster fitted to XAS data. High-activity catalyst Ru-β (N) 2.4% demonstrates comparable or better ammonia conversion by Ru wt% than recently reported catalysts in the literature at 450 °C and 30![[thin space (1/6-em)]](https://www.rsc.org/images/entities/char_2009.gif) 000 WHSV.
000 WHSV.
Introduction
The development of economically viable alternatives to fossil fuels is imperative to reducing our currently unsustainable rate of greenhouse gas emissions, and enabling our transition to a decarbonised energy economy. Hydrogen (H2) has been explored as an attractive candidate, being a carbon-neutral fuel finding application in Proton-Exchange Membrane Fuel Cells (PEMFCs), which have an energy conversion efficiency of 40–60%.1 Recent improvements in photocatalytic water splitting efficiency2 additionally allow for sustainable production of H2, as opposed to COx emission-heavy steam reforming of natural gas, which currently accounts for nearly 50% of global H2 production.3Regrettably, challenges in storage and transport plaguing H2 has limited its uptake as a fuel. Its low volumetric energy density and safety issues concerning its wide range of combustion in air (4–75%) can be circumvented by the chemical storage of hydrogen in ammonia (NH3), which has a high wt% hydrogen content of 17.8, is easily liquefied at 8 bar at 20 °C (meeting the US Department of Energy 2015 targets for volumetric and gravimetric capacities for physical storage of hydrogen), and has a narrower combustion range (16–25%) than H2.4 Provided a viable catalytic decomposition pathway is available, NH3 can serve as a hydrogen vehicle for purposes of storage and transport, and be broken down on demand to generate H2in situ for use in fuel cells.
NH3 decomposition (eqn (1)) was first proposed by Green in 1982 to enable the use of NH3 as a low-cost H2 storage and transport vehicle:5
| 2NH3 ⇌ 3H2 + N2 | (1) |
NH3 decomposition is initiated by adsorption of NH3 onto an active catalytic surface, followed by successive N–H bond scission. Hydrogen adatoms can then migrate, recombine, and desorb, releasing molecular H2; nitrogen adatoms similarly undergo associative desorption, yielding molecular N2:8
| NH3(g) → NH3(ad) | (2) |
| NH3(ad) → NH2(ad) + H(ad) | (3) |
| NH2(ad) → NH(ad) + H(ad) | (4) |
| NH(ad) → N(ad) + H(ad) | (5) |
| 2H(ad) → H2(ad) | (6) |
| H2(ad) → H2(g) | (7) |
| 2N(ad) → N2(ad) | (8) |
| N2(ad) → N2(g) | (9) |
This work has presently focused to the choice of catalyst support, as it can profoundly influence catalyst properties and activity. Zeolites are crystalline and nanoporous aluminosilicate minerals, whose properties of high porosity and surface area, tunable acidity, thermal stability, and shape-selectivity have long been exploited in industrial catalysis, particularly in fluid catalytic cracking.14 Zeolite frameworks are assembled from corner-linked TO4 tetrahedra (T = primarily Si and Al, occasionally B, P etc.), and the specific connection of these tetrahedra determines the zeolite structure adopted. In faujasite-type (FAU) structures, for instance, these tetrahedra form secondary units of sodalite cages linked by hexagonal prisms, forming a highly porous three-dimensional network.15 Sodalite cages, with a diameter of around 0.23 nm,16 are largely inaccessible to molecules in the context of catalysis; the larger supercages at around 1.3 nm are more accessible through channels 7.4 Å in diameter, and promising sites for ion-exchange in the development of metal cluster catalysts (it is worth noting larger NPs, on the scale of nanometres, must anchor on the exterior of the zeolite).15,17 In this work, 13X, USY15, and HY5.4 adopt the FAU structure. Zeolites X and Y differ by Si/Al ratios: between 1 and 1.5 for zeolite X, and between 1.5 and 3 for zeolite Y.18 A second zeolite structure, MFI, is relevant to this work, and is adopted by H-ZSM-5 and Hβ-25. Díaz et al. describe it as two interconnected channel systems: straight channels that run down one axis (10 MR channels for H-ZSM-5, 12 MR for Hβ-25); sinusoidal channels that run down a second axis (again, 10 MR/12 MR), connecting the straight channels; and a tortuous pore path along the remaining axis.19
MFI pore sizes are approximately 5.5 Å in diameter, allowing for molecular diffusion and making metal clusters coordinated to exchange sites within them catalytically active17 – again, these features will be inaccessible to NPs on the basis of size. Structure aside, the negative charge begat from the substitution of framework Si for Al is typically compensated for by the presence of extra-framework H+, or Group I or II cations like Na+ and Ca2+.20 These extra-framework species can undergo facile ion-exchange, resulting in the encapsulation of active cluster species within the zeolite framework. Exchange initially occurs in sodalite cages and hexagonal prisms in FAU structures, maximising the coordination number of the guest metal at the most favourable exchange sites, only later occupying supercage ion-exchange sites; in MFI, exchange occurs in straight or sinusoidal channels, or at channel intersections.17 In this work, five zeolites are employed as catalysts supports: Na-13X, HY5.4, and USY15, which share the FAU structure, hereby referred to as zeolites X, Y, and USY for clarity; and Hβ-25 (dealuminated; refer to Experimental methods) and H-ZSM-5, which share the MFI structure, hereby referred to as zeolites β and ZSM-5.
Post-synthetic modifications to the zeolite framework of nitridation and dealumination have recently been investigated as ways of tuning the properties of zeolite and zeolite-supported catalysts. Nitridation is a basic way to substitute a proportion of framework O with N by treating the zeolite with ammonia. Dogan and colleagues established preferential substitution at Brønsted acidic Si–OH–Al sites (with respect to Si–OH–Si sites).21 This modification has been reported to increase zeolite basicity due to the lower electronegativity of N;22 degree of N-incorporation has also been found to increase with both temperature and duration of nitridation treatment. Dealumination, meanwhile, most frequently performed via steam treatment or acid leaching, is a common method employed in the formation of mesopores (diameters between 2 nm and 50 nm) within microporous (diameter < 2 nm) zeolites.23 Extraction of framework aluminium during these processes results in vacancies that can grow to form mesopores; these, in turn, can enhance the accessibility of reactants to micropore-confined catalysts through substantially improved diffusional transport,24 improving catalytic performance. Of interest to this work are such zeolite-supported metal catalysts, which have been successfully fabricated for catalysis of a wide range of size-selective reactions and small molecule activation, including CO2 conversion,25 CO oxidation,26 methane to methanol and acetic acid,27 and shape-selective nitroarene hydrogenation.28 Our attention has turned to the optimisation of catalysts supported on zeolites for NH3 decomposition.
Contrary to what might be expected from the principle of microscopic reversibility, Boisen et al. established in 2004 that the optimal NH3 decomposition catalyst is not necessarily the optimal NH3 synthesis catalyst (they in fact demonstrate the two can never be the same, except at equilibrium).29 This stems from the difference in reaction conditions: very different partial pressures of ammonia, hydrogen, and nitrogen present in NH3 decomposition and NH3 synthesis lead to varying concentrations of surface species, in turn leading to different optimal metal–nitrogen binding energy. The Sabatier principle in heterogeneous catalysis states that the adsorption energy of reactants with their catalytic surface should fall within an intermediate range; too weak a binding energy leads to insufficient reactant surface coverage, while too strong a binding energy poisons active sites and decreases catalytic efficiency.30 Classic volcano-shaped curves of activity vs. nitrogen binding energy have been empirically observed with both NH3 synthesis and decomposition; Ru, with an optimal metal–N binding energy, sits at the top of the curve for NH3 decomposition. This agrees with work by Ganley et al., which showed catalytic activity on activated alumina varied in the order Ru > Ni > Rh > Co > Ir > Fe ≫ Pt > Cr > Pd > Cu ≫ Te, Se, Pb,10 and work by Yin et al., which established a slightly different order on supports of carbon nanotubes (CNTs) of Ru > Rh ≈ Ni > Pt ≈ Pd > Fe.1 Of the monometallic catalysts, Ru has been well established as the most active for NH3 decomposition; its scarcity and high cost, however, limit the widespread uptake of Ru-based systems for large-scale applications.9 Of recent interest have been bimetallic systems seeking to reproduce the activity of Ru via the concept of Periodic Table interpolation, wherein the linear combination of nitrogen binding energies of two parent metals gives a mixed metal surface an intermediate binding energy.8 CoMo and FeCo bimetallic catalysts, for instance, have been shown to be active for ammonia decomposition on supports of MCM-41 and CNTs, albeit at elevated temperatures of 550 °C–600 °C.31,32 This work will briefly explore the viability of earth-abundant elements in bimetallic catalysts as alternatives to Ru-based ones, in addition to its primary focus of using N-modified zeolites to increase the economy of Ru utilisation by increasing its dispersion as small clusters rather than large NPs.
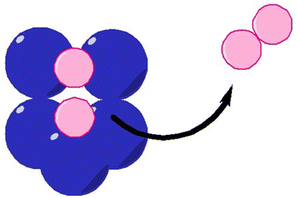
The highly structure-sensitive33 decomposition of NH3 over Ru NPs is dominated by highly active B5 surface sites, which comprise three Ru atoms in a bottom layer, and two more Ru atoms on a monoatomic step directly above them on a Ru (0001) terrace.34 A scheme of associative desorption of molecular N2 at a B5 site is illustrated in Fig. 1; as established earlier, this step is rate-limiting at low temperatures, and maximising the concentration of B5 sites in catalysts whose activity is dominated by NPs becomes important in optimising catalytic performance. A critical mean size of 2 nm for Ru NPs was proposed by Bielawa et al. in 2001 to maximise the number of B5 sites using a simple geometric model;35 work by Raróg-Pilecka and colleagues on carbon-based Ru systems in 2005 suggest a larger optimal NP size of 3–4 nm (ref. 36) (they suggest a possible explanation for this discrepancy lies in the evolving morphology of Ru NPs with increasing particle size exposing more B5 sites, an observation made by Song et al. a year earlier with Ru/graphite systems37). NPs, however, are unstable with respect to agglomeration, particularly at elevated temperatures.32 Some control over particle size can nevertheless be achieved, for instance through the use of structural promoters preventing sintering38 or microporous supports.39 More attention has recently been given to single-atom (SA) catalysts, which can enhance selectivity and catalytic activity owing to the homogeneity of their active sites,40 are more amenable to mechanistic study, and have a better economy of atom utilisation,41 which is pertinent to catalytic systems employing costly metals like Ru. At higher metal loadings, dinuclear and oligonuclear clusters form in addition to SA species.17,42 Of relevance to this work are oligonuclear metal clusters, which we later show are likely active for NH3 decomposition in our samples. Similar to NPs, the high surface energy of isolated clusters makes challenging their high yield synthesis (>1 wt% metal) and stabilisation.43 Microporous supports like zeolites can help stabilise clusters by spatially trapping them within cages, avoiding agglomeration even at high temperatures through the confinement effect.44 The enhanced catalytic activity of SAs on zeolites as opposed to non-acidic supports additionally suggests a co-operative dynamic between SA catalysts and BASs in proximity,45 making zeolites an attractive catalyst support.
This paper aims to optimise and characterise novel metal–zeolite catalysts for NH3 decomposition active at lower temperatures, leveraging the enhanced reactivity of metal catalysts confined within zeolite cages.46 In particular, this paper focuses on the effects of N-substitution on catalyst performance; comparative characterisations of an unsubstituted and N-substituted zeolite pair will be conducted to investigate the effects of substitution on decomposition activity, framework structure, and metal dispersion. Work then shifts to optimising metal–zeolite catalysts by observing trends in metal loading and N-substitution on activity to increase the economic viability of large-scale NH3 decomposition.
Experimental
Materials
Reagents used in the course of this work were as follows: molecular sieves 13X powder (Na-13X, Alfa Aesar); zeolite HY-15 (USY15, SMH); zeolite HY5.4 (Nankai University Catalyst Co. Ltd); zeolite H-Beta-25 (Nankai University Catalyst Co. Ltd); H-ZSM-5 (Nankai University Catalyst Co. Ltd); iron(III) nitrate nonahydrate (Fe(NO3)3·9H2O, ≥98%, ACS reagent, Sigma-Aldrich); cobalt(II) nitrate hexahydrate (Co(NO3)2·6H2O, ≥98%, ACS reagent, Sigma-Aldrich); nickel(II) nitrate hexahydrate (Ni(NO3)2·6H2O 98%, Alfa Aesar); ammonium molybdate tetrahydrate ((NH4)6Mo7O24, ≥99.0%, BioUltra, Sigma-Aldrich); ruthenium(III) chloride hydrate (RuCl3·H2O, Fluorochem); ammonium nitrate (NH4NO3, ≥98%, ACS reagent, Sigma-Aldrich).Zeolite framework modification
Framework modification of N-incorporation and/or dealumination of select zeolites (Y, β, and ZSM-5) was carried out to investigate structural changes and effects on catalytic performance upon their introduction.N-substitution
Typically, 2.0 g of zeolite would be heated from room temperature (RT) to 400 °C at 1 °C min−1 in N2 (0.2 L min−1), and held for 6 h to purge water molecules. Flowing gas would then be switched to pure NH3 (0.6 L min−1), and temperature increased to 750 °C at 1 °C min−1, and held for 8 h for nitridation. Flowing gas would then be switched back to N2 (0.2 L min−1), and the catalyst allowed to cool back to RT. Zeolites undergoing negative control treatment would be heated to 750 °C in N2 (0.6 L min−1) flow instead of NH3 (0.6 L min−1), with all other parameters remaining constant.Dealumination via acid-wash
Dealumination of zeolites was conducted by treatment in HNO3 solution (13 M for β, 0.1 M for Y; 20 mL g−1 (zeolite)) at 100 °C for 20 h. Similar dealumination treatments in the literature have resulted in no loss of crystallinity, and SiO2![[thin space (1/6-em)]](https://www.rsc.org/images/entities/char_2009.gif) :
:![[thin space (1/6-em)]](https://www.rsc.org/images/entities/char_2009.gif) Al2O3 ratios exceeding 1300
Al2O3 ratios exceeding 1300![[thin space (1/6-em)]](https://www.rsc.org/images/entities/char_2009.gif) :
:![[thin space (1/6-em)]](https://www.rsc.org/images/entities/char_2009.gif) 1.47,48
1.47,48
Synthesis of metal-loaded zeolites
Catalysts were typically prepared in batches of 300 mg. Synthesis occurred via the ion-exchange method: an amount of metal precursor corresponding to a desired M![[thin space (1/6-em)]](https://www.rsc.org/images/entities/char_2009.gif) :
:![[thin space (1/6-em)]](https://www.rsc.org/images/entities/char_2009.gif) Al loading would be dissolved in deionised (DI) water (20 mL for 300 mg of zeolite) heated to 80 °C under stirring in a round-bottom flask. The zeolite would then be added to the solution, and left to stir for 2 h.
Al loading would be dissolved in deionised (DI) water (20 mL for 300 mg of zeolite) heated to 80 °C under stirring in a round-bottom flask. The zeolite would then be added to the solution, and left to stir for 2 h.
Following ion-exchange, samples would be washed to remove impurities or excess precursor. Samples would be shaken with 40 mL of DI water in a centrifuge tube, spun down at 5000 rpm for 5 min, and the supernatant discarded. For Ru-based catalysts, bath sonication for 5 min at RT in a Fisherbrand FB15051 was carried out between washes to agitate the sample into solution, as they were wont to stick to the bottom of the tube. Catalysts would be given a minimum of four washes. They would then be dried in a vacuum oven at 80 °C overnight.
Calcination of metal-loaded zeolite in H2 flow
Catalysts would then be activated by reductive calcination. Loaded in quartz boats in a tubular Carbolite MTF 12/38/250 furnace and in 5% H2/Ar flow, samples would be heated from room temperature to 110 °C at 5 °C min−1, and held for 2 h to purge water molecules. Temperature would then be raised to 350 °C at 1 °C min−1, and held for 6 h to ensure no further changes to catalyst structure and dispersion. Following cooling to room temperature, catalysts would be collected and labelled in glass vials. Catalysts would be designated a label in the form M-zeolite (e.g. Ni-X for Ni loaded on Na-13X), with supplementary parenthetical labels: (N) denoting N-substitution of a zeolite and (N2) denoting non-substituting control treatment; (0.1 M) and (13 M) denoting dealumination treatment of a zeolite with the respective concentrations of HNO3. Percentages at the end of a label reflect metal wt%.Catalyst activity testing
Testing of NH3 decomposition activity was done with a continuous flow reactor coupled to an Agilent Technologies 7890B gas chromatograph (GC). 50 mg of catalyst would be loaded into a quartz tube of diameter 3.8 mm, with quartz wool plugged at both ends. Heating and rate of gas flow to the reactor were controlled digitally. Typically, standardised reaction conditions of 450 °C and 30![[thin space (1/6-em)]](https://www.rsc.org/images/entities/char_2009.gif) 000 weight hourly space velocity (WHSV) pure ammonia (mLNH3 gcat−1 h−1) were employed to allow for clear performance comparison. Quantification of gaseous products H2, N2, and NH3 would then be done with the coupled GC. Data readings from the GC would be taken after an initial induction period of 30 min during which gas output readings would stabilise, likely due to the excellent adsorption capacities of zeolites.20,49 Duplicates or triplicate measurements were typically performed. Conversion rates reflect an average of readings with values within a small margin of error (±5%). Due to early experiments suggesting the re-adsorption of water into zeolite pores leading to poorer activity following calcination treatment in tube furnaces, catalyst calcination was subsequently typically performed in situ in the reactor immediately before NH3 decomposition (with precisely the same heating methodology and 5% H2 flow), avoiding this issue.
000 weight hourly space velocity (WHSV) pure ammonia (mLNH3 gcat−1 h−1) were employed to allow for clear performance comparison. Quantification of gaseous products H2, N2, and NH3 would then be done with the coupled GC. Data readings from the GC would be taken after an initial induction period of 30 min during which gas output readings would stabilise, likely due to the excellent adsorption capacities of zeolites.20,49 Duplicates or triplicate measurements were typically performed. Conversion rates reflect an average of readings with values within a small margin of error (±5%). Due to early experiments suggesting the re-adsorption of water into zeolite pores leading to poorer activity following calcination treatment in tube furnaces, catalyst calcination was subsequently typically performed in situ in the reactor immediately before NH3 decomposition (with precisely the same heating methodology and 5% H2 flow), avoiding this issue.
Results and discussions
Characterisation of select Ru catalysts
With the aim of optimising catalysis for NH3 decomposition, characterisation of Ru catalysts was performed to better understand their composition, structural properties, and mechanism of NH3 decomposition – and in particular the effect of N-substitution on these parameters. To that end, Ru-Y 6.4% and Ru-Y (N) 6.4% were the primary focus of these techniques, allowing clear comparison between an unsubstituted and N-substituted zeolite framework. The Ru-Y series was selected due to promising early catalyst testing results.ICP-MS
Table 1 shows ICP-MS results obtained for samples Ru-Y 6.4% and Ru-Y (N) 6.4%; real Ru loadings were 2.5% for both samples, substantially lower than nominal loadings of 6.4%. This was likely due to poor uptake during the ion-exchange process, or loss of Ru species during sonication and washing steps.| Sample | Ru wt% |
|---|---|
| Ru-Y 6.4% | 2.46 |
| Ru-Y (N) 6.4% | 2.54 |
NMR
To provide evidence of N-incorporation into zeolite supports used, 29Si NMR spectra of Y, β, and ZSM-5 before and after N-substitution were obtained. Table 2 shows good agreement between predicted 29Si chemical shifts and our experimentally observed shifts, providing compelling evidence for the successful substitution of framework O for N. Our 29Si shifts of −93.1 ppm for the beta zeolite and −93 ppm for ZSM-5 also compare reasonably with the values of −91 ppm and −90 ppm obtained by Kweon et al. for Si–N–T 29Si shifts in the respective zeolites.50 An integration of peak area was performed for all samples to approximate the proportion of framework O substituted for N, given in Fig. 2. Hammond et al. calculated with Gaussian on a FAU structure (which Y adopts) that substitution of framework O for N requires significantly less energy (35 kJ mol−1, from 98 kJ mol−1 at a siliceous site) with an adjacent Al present.51 Of the three zeolites, Y had the highest Al content with a Si![[thin space (1/6-em)]](https://www.rsc.org/images/entities/char_2009.gif) :
:![[thin space (1/6-em)]](https://www.rsc.org/images/entities/char_2009.gif) Al ratio of 2.7, and therefore incorporated the most N into its framework (28%); β and ZSM-5, with Si
Al ratio of 2.7, and therefore incorporated the most N into its framework (28%); β and ZSM-5, with Si![[thin space (1/6-em)]](https://www.rsc.org/images/entities/char_2009.gif) :
:![[thin space (1/6-em)]](https://www.rsc.org/images/entities/char_2009.gif) Al ratios of 12.5 and 9 respectively, incorporated less (15% and 7.6%).
Al ratios of 12.5 and 9 respectively, incorporated less (15% and 7.6%).
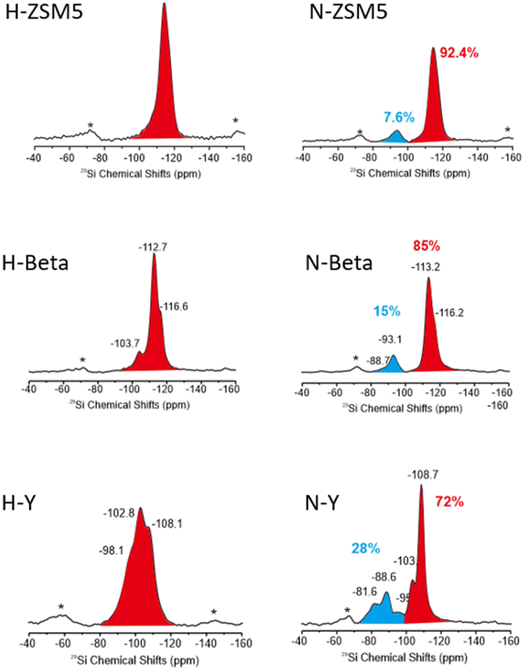 | ||
| Fig. 2 29Si NMR spectra of unsubstituted and N-substituted ZSM-5, β, and Y zeolites, referenced to Kaolin (−91.5 ppm). | ||
FTIR
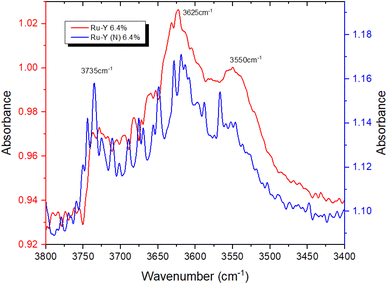
To provide further evidence of successful N-incorporation, FTIR spectra were first collected on pristine Y and nitridated Y (N) (Fig. 3) and compared, to establish the presence of nitrogenous species present in the latter. Two new bands at 3401 cm−1 and 3367 cm−1 appeared in the spectrum following N-doping, corresponding to the imido N–H stretches of Si–NH–Si (Si–NH2–Al) and Si–NH–Al groups, respectively, confirming the presence of nitrogen within the zeolite framework.22,52 The larger peak intensity of Si–NH–Si (Si–NH2–Al) vs. Si–NH–Al, counterintuitive due to the higher energy of substitution at siliceous sites, may be rationalised by the higher population of Si–OH–Si vs. Si–OH–Al sites in Y. The N–H stretching regimes of Y (N) and Ru-Y (N) 6.4% were then compared, to establish Ru–N coordination in the latter (Fig. 4). The absence of both imido N–H peaks following Ru loading indicated the coordination of Ru species to framework N – the small sodalite cage and supercage sizes of 0.23 nm and 1.3 nm (ref. 17) additionally suggest these should be Ru clusters, as opposed to larger NPs. To investigate the effects of N-substitution on the anchoring of Ru species at Brønsted acidic sites within the zeolite to form cluster species, the O–H stretching regions of Ru-Y 6.4% and Ru-Y (N) 6.4% are compared in Fig. 5. A drop in peak intensity is observed for the lower-frequency sodalite O–H peak (3550 cm−1) and in particular the higher-frequency supercage O–H peaks (between 3650–3615 cm−1) upon N-substitution,53 indicating coordination of Ru to these bridging oxygens, and an increased confinement of cluster species in sodalite cages and catalytically active supercages. A relative increase in peak intensity is also observed for the terminal silanol O–H peak at 3735 cm−1, indicating Ru coordination at these groups for Ru-Y (N) 6.4%, collected at 400 °C in N2 flow, decreases.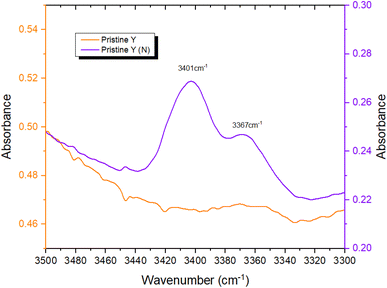 | ||
| Fig. 3 FTIR spectra comparing N–H stretching regimes of pristine Y and Y (N) collected at 400 °C in N2 flow. | ||
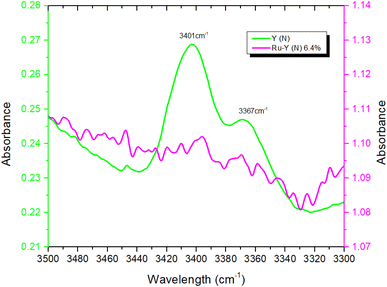 | ||
| Fig. 4 FTIR spectra comparing the N–H stretching regimes of Y (N) and Ru-Y (N) 6.4%, collected at 400 °C in N2 flow. | ||
This agrees with our understanding of N-substitution occurring primarily at Al-adjacent bridging OH groups as opposed to siliceous sites like silanol,51 and the higher basicity of N compared with O leading to stronger Ru–N coordination, and increased anchoring of Ru to Al-adjacent NH2 sites within the framework. Anchored Ru coordination to proximal framework O’s is then possible, given the small sodalite and supercage sizes of 2.3 Å and 13 Å (both of which are 6-membered oxygen rings), resulting in the observed drop in corresponding OH peak intensities. This suggests Ru–N interactions are stronger than Ru–O and increase Ru dispersion in FAU as clusters; TEM imaging and XAS data will later corroborate these findings. TEM images of Ru-Y 6.4% and Ru-Y (N) 6.4% were procured to visualise the size and morphology of Ru NPs distributed throughout their frameworks. Regrettably, metal loading and calcination treatment of both zeolites had compromised crystallinity to the extent high-resolution imaging of Ru species within zeolite pores or supercages could not be obtained. It is worth noting again the small diameters of intrazeolitic features (Y supercage size: 1.3 nm, pore sizes: 0.74 nm) means only small oligonuclear Ru clusters may form within the framework; large Ru NPs, on the scale of nanometres, necessarily form on the external surface of the zeolite.
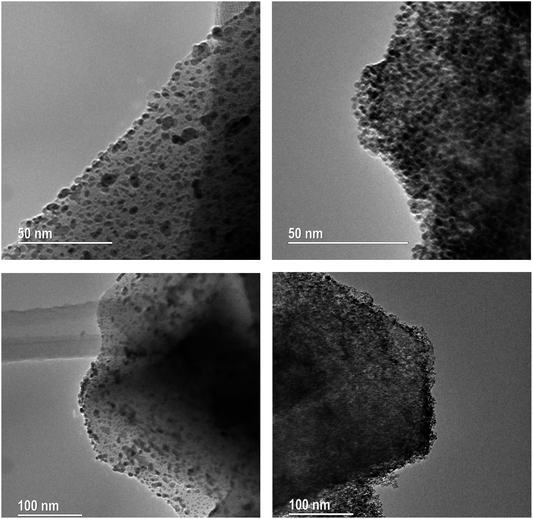
Shown in Fig. 6 are bright-field TEM images of Ru NPs located on the external surface of the zeolites. Metallic Ru NPs (Z = 44) scatter electrons more strongly than Si (Z = 14) and Al (Z = 13), and show up as dark particles. At a 50–100 nm scale on Ru-Y 6.4% we observe the formation of large Ru NPs with a broad, non-uniform dispersion; at the same scale, Ru-Y (N) 6.4% exhibits a more uniform dispersion of smaller Ru clusters throughout the structure, agreeing with the respective presence and absence of Ru(101) peaks in the XRD in Fig. 7. Regrettably, more systematic study of the samples identifying Ru positions within the zeolite pores of different sizes was unable to be conducted due to electron beam damage to the samples as well as high metal loading compromising zeolite crystallinity. Future work may involve imaging zeolites with a much lower metal loading, to avoid the issue of amorphicity and provide evidence for the confinement of Ru species within the zeolite structure, as well as particle analysis using ImageJ software to obtain a quantitative size distribution of exterior-located Ru NPs.
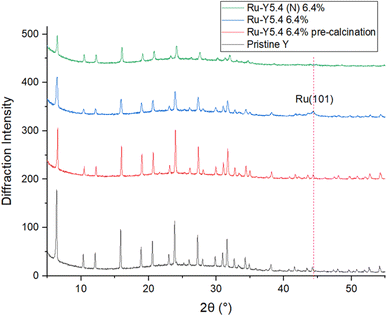 | ||
| Fig. 7 XRD of pristine Y, pre-reduced Ru-Y 6.4%, Ru-Y 6.4%, and Ru-Y (N) 6.4%. (N) denotes N-doping has been performed on the sample. | ||
To investigate effects of Ru loading on crystallinity and N-substitution on catalyst dispersion, XRD patterns of the Y series were obtained. XRD results in Fig. 7 show pristine Y is highly crystalline; upon Ru loading into the support, a slight drop in intensity of all peaks suggests a decrease in microporous volume corresponding to formation of confined Ru cluster species within zeolite supercages. Upon calcination and reduction, a further drop in peak intensity was observed, in addition to the presence of a new peak at 2θ = 44°, corresponding to the (101) phase of hcp Ru NPs.54 This reflects the expected reduction and agglomeration of Ru species into NPs at the elevated temperatures of calcination (350 °C) under H2 flow. A very slight shift of all peaks to higher values of 2θ was also observed upon loading of Ru and other transition metals, indicating a contraction in unit cell parameter – possibly due to the presence of Ru species coordinating to multiple framework oxygen units in the zeolite supercage resulting in slight pore distortion; Cu2+ has been documented to distort 6-membered rings (6 MRs) this way to obtain 4-fold coordination.17
Application of the Scherrer equation was used to estimate Ru crystallite sizes from the diffraction pattern of Ru-Y 6.4%, giving a large value of 15.7 nm. It is worth noting that this likely represents the lower limit of Ru NP sizes, as NPs are often aggregations of crystallites. Other methods like TEM should be used in conjunction with this technique in the determination of particle size, although varying methods of particle size estimation are expected to yield different results: TEM, for instance, is subjective, and is prone to selection bias wherein the experimentalist focuses on larger, more visible particles.
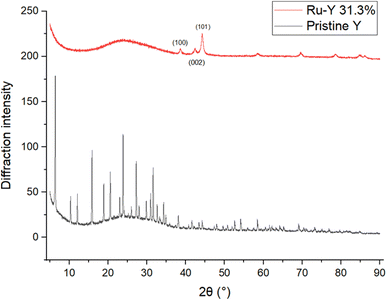
Interestingly, no Ru(101) peak was observed with Ru-Y (N) 6.4%, despite identical Ru loadings and calcination treatment to its non-N doped counterpart. Corroborated by data from EXAFS and TEM, this suggests severe line broadening is occurring due to N-substitution of the Y framework resulting in the formation of significantly smaller Ru cluster species within the zeolite framework, instead of larger NPs on the exterior surface. Fig. 8 shows complete loss of crystallinity occurs at high metal loadings; at a Ru wt loading of 31.3%, all zeolitic long-range order has been lost to structural collapse compared with pristine Y, due to the formation of large Ru particles within the zeolite framework. Peaks characteristic of crystallised Ru NPs gain intensity instead at 2θ = 38.4°, 42.3°, and 44.0°, corresponding to (100), (002), and (101) planes of hexagonal phase Ru respectively.55 The prominence of Ru NP peaks indicates unsatisfied catalytic performance, and amorphicity of the sample precludes refinement analysis – both issues that should be resolved by substantially lower metal loading. EXAFS analysis was performed to determine the averaged local coordination environment of Ru species in the Y catalyst series (Table 3). First nearest neighbour Ru–Ru peaks occur at 2.67/2.68 Å across all samples except Ru-Y (N) 3.3%, whose peak occurs slightly lower at 2.60 Å, in agreement with the literature value of 2.67 Å for conventional hcp Ru NPs.56
| Sample | Scattering paths | CN | R-factor | Atoms |
|---|---|---|---|---|
| a Notice that the experimental coordination number (CN) with errors is obtained from the EXAFS for the calculation of the average number of atoms in the cluster. The decimal point of the atom was obtained within the estimated error in the experimental CN hence it is statistically acceptable. Fitting curves of Ru-Y (N) 6.4% and Ru-Y (N) 3.3% in R-space and k-space are shown in Fig. S.1 (in the ESI), and complete fitting parameters in Table S.1 in the ESI. | ||||
| Ru-Y 6.4% | Ru–Ru | 9.68 ± 1.19 | 1.72 | 51.1 |
| Ru-Y (N) 6.4% | Ru–O | 4.18 ± 1.70 | 1.62 | 6.8 |
| Ru–Ru | 3.90 ± 1.08 | |||
| Ru-Y 3.3% | Ru–O | 3.10 ± 4.30 | 1.48 | 17.9 |
| Ru–Ru | 7.01 ± 1.53 | |||
| Ru-Y (N) 3.3% | Ru–O | 4.65 ± 1.58 | 2.59 | 5.6 |
| Ru–Ru | 3.35 ± 1.20 | |||
For unsubstituted Ru-Y 6.4% and Ru-Y 3.3%, an expected drop in Ru–Ru coordination number (CN) follows a decrease in metal loading. The unusually large Ru–Ru CN of Ru-Y 6.4% at 9.68 is notable, especially given its low real metal loading of 2.5% established by ICP. Using a method developed by Marinkovic et al. to estimate sizes of monometallic particles from mean nearest neighbour CN N1,57 we can determine approximate particle sizes of our Ru catalysts:
 | (10) |
Notably, N-substitution of both Ru-Y catalysts resulted in a sizeable decrease in first-shell Ru–Ru CN (3–4) and particle size (5–7 atoms), as well as an increase in Ru–O/N CN (O and N, adjacent on the Periodic Table, have similar scattering patterns), suggesting N-substitution facilitates the formation of stable and coordinated Ru clusters within the zeolite framework. Building on results of preliminary EXAFS fitting of XAS data, we turned to the examination of possible structures modelling the short-range coordination environment of Ru species from their derived CNs.
Li et al. notes that the square is the basic unit of growth with Run clusters, with clusters comprising integer numbers of squares (n = 4, 8, etc.) designated as magic number clusters with particularly high stability.58 In particular, they calculate the ground state structures of Ru5 and Ru6 to be an optimised square pyramid and hexagonal prism respectively. Using these as a basis, two such DFT-optimised models fitting experimental Ru–Ru and Ru–O/N CNs – a Ru5N5 pyramidal cluster and a Ru6N6 prismatic cluster (Fig. 9) – were therefore constructed, and subject to EXAFS analysis to determine their fit with the N-substituted zeolites’ experimental spectra. It is worth noting at 28% N-substitution in Y, it is likely some of the N’s in these clusters will in reality be O.
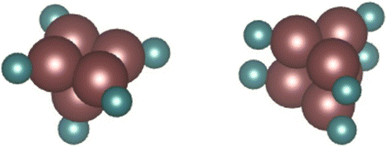 | ||
| Fig. 9 DFT models of a Ru5N5 square pyramid and a Ru6N6 prism. Complete DFT calculation parameters for Ru6N6 fitting to the XAS spectrum of Ru-Y (N) 3.3% including R-value, are given in Table S.2 and shown in Fig. S.2 in the ESI.† | ||
The Ru6N6 prism was found to be a good fit for both Ru-Y (N) 6.4% and Ru-Y (N) 3.3%, with a low R-value, reliable Debye–Waller factors, and only minor variations from structural minima discovered by DFT (full fitting parameters as well as Ru6N6 EXAFS spectra are in Fig. S.2 and Table S.2 in the ESI†). The Ru5N5 cluster, however, gave neither a good R-value nor reliable fitting parameters, and was discarded as a proposed cluster structure.
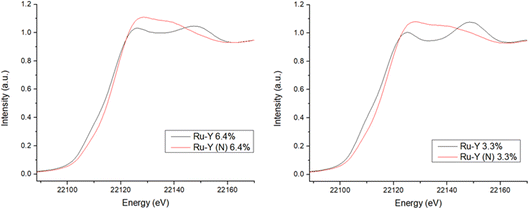
XANES spectra at the Ru-K edge of N-substituted and unsubstituted Ru-Y 6.4% and Ru-Y 3.3% were compared to give further evidence of Ru–N coordination (Fig. 10). Though no bulk Ru was analysed as a reference, XANES of the unsubstituted Ru-Y catalysts was found to be remarkably similar to that of Ru powder analysed in literature,59 suggesting the formation of metallic Ru NPs. N-Substitution, however, resulted in an edge shift to higher energy, increase in white line peak intensity, and reduced post-edge oscillations in both samples. These features can be rationalised by Ru 5d to N 2p backbonding due to strong Ru–N orbital interaction, resulting in oxidation of the coordinated Ru. Similar changes to XANES spectra previously observed with thiol-capped Ru NPs and K4[Fe(CN)6] have been attributed to Ru–S and Fe–CN metal-to-ligand charge transfers (MLCTs) respectively.59,60 The XANES Ru-K edge was also simulated for the prismatic Ru6N6 cluster modelled by DFT, showing a good fit with matching spectrum shape and peak position with those of Ru-Y 6.4% and Ru-Y 3.3% (Fig. 11) – further suggesting these Ru6N6 clusters are present in our N-substituted catalysts.
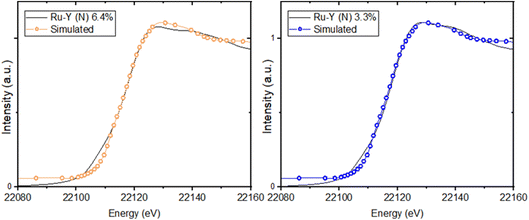 | ||
| Fig. 11 Simulated XANES spectra at the Ru-K edge of Ru6N6 cluster, compared with experimental Ru-Y (N) 6.4% and Ru-Y (N) 3.3% XANES (also see ESI†). | ||
BET analysis was supplementary performed to determine the effect of N-substitution as well as increased metal loading on zeolitic pore surface area and volume. Table 4 summarises results obtained; upon increase in Ru loading from 3.3% to 6.4%, an expected and significant decrease in BET surface area (SBET) of approximately 200 m2 g−1 (∼24%) was observed for both nitridated and non-nitridated samples, due to reduction of zeolite crystallinity.
| Sample | S BET (m2 g−1) | S micro (m2 g−1) | S meso (m2 g−1) | V micro (cm3 g−1) | V meso (cm3 g−1) |
|---|---|---|---|---|---|
| Ru-Y 6.4% | 636 | 513 | 41 | 0.184 | 0.045 |
| Ru-Y (N) 6.4% | 656 | 500 | 132 | 0.178 | 0.150 |
| Ru-Y 3.3% | 829 | 684 | 92.3 | 0.246 | 0.051 |
| Ru-Y (N) 3.3% | 853 | 661 | 157 | 0.236 | 0.174 |
More interestingly, while microporous volume (Vmicro) and surface area (Smicro) of both 3.3% and 6.4% samples remained comparable before and after nitridation, indicating micropore structure is well preserved, the treatment resulted in a marked increase in both mesoporous volume (Vmeso) and surface area (Smeso). This can also be demonstrated in dV/dlog(W) graphs in Fig. 12: following nitridation, the formation of mesopores up to 10 nm in width is observed in both samples. Steam treatment of zeolites at high temperatures is a common dealumination method also known to disrupt crystal morphology and introduce the formation of mesopores.16,61 Agostini et al. demonstrated that heating Y zeolite to 600 °C in steam only caused Al defects to form; structural collapse and mesopore formation caused by migration of Al3+ to extra-framework positions occurred only upon cooling, by dislodgement of framework Al by water molecules repopulating zeolitic pores.62
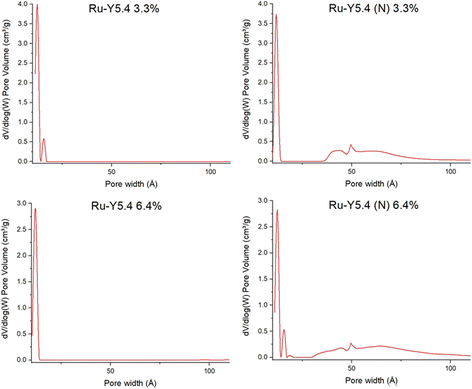 | ||
| Fig. 12 BET graphs of pore volume vs. pore width of Ru-Y 6.4%, Ru-Y (N) 6.4%, Ru-Y 3.3%, and Ru-Y (N) 3.3%. | ||
With analogous treatment conditions of pure ammonia flow and heating to 750 °C during N-substitution, it is possible ammonia fulfilled the role of water in partial dealumination of Y. More corroborating data, for instance from thermogravimetric analysis (TGA) or 27Al MAS NMR before and after N-substitution, could be used to investigate this possibility – which may have an impact on catalysis rate by enhanced molecular diffusion through the larger mesopores.
This work establishes in this section the successful incorporation of N into the zeolite frameworks Y, β, and ZSM-5 upon N-substitution treatment with 29Si NMR and FTIR. It also provides evidence for Ru–N coordination with XANES and FTIR, the increased dispersion of Ru in the zeolite through the formation of smaller Ru clusters as opposed to larger NP aggregates, and increased anchoring of Ru to bridging Si–NH2–Al sites, due to the higher basicity of N vs. O, with FTIR, EXAFS, TEM, and XRD. This work suggests the Ru6N6 clusters modelled by DFT and fit to XAS data form during synthesis because N behaves as a nucleation site to which they can effectively and stably anchor. Fig. 13 shows a possible scheme of a Ru6N6 cluster anchored to such a site, heterolytically activating the N–H bond of NH3. Provided these clusters are indeed active for NH3 decomposition, this could mean a greater realisation of Ru catalytic potential at a given loading – which this work will presently verify through catalytic testing.
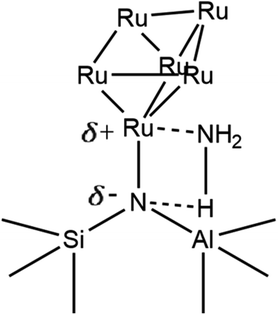 | ||
| Fig. 13 Conceptual scheme of Ru6N6 cluster anchored at a bridging Si–N–Al site heterolytically activating NH3 (only one Ru–N bond pictured, for clarity). | ||
An initial screening of potential candidates for NH3 decomposition catalysis was performed on FAU supports of USY and X; USY was chosen for its high crystallinity and thermal stability, and amenability to SXRD and refinement techniques. X conversely, has a much lower Si![[thin space (1/6-em)]](https://www.rsc.org/images/entities/char_2009.gif) :
:![[thin space (1/6-em)]](https://www.rsc.org/images/entities/char_2009.gif) Al ratio than USY (1
Al ratio than USY (1![[thin space (1/6-em)]](https://www.rsc.org/images/entities/char_2009.gif) :
:![[thin space (1/6-em)]](https://www.rsc.org/images/entities/char_2009.gif) 1 vs. 7.5
1 vs. 7.5![[thin space (1/6-em)]](https://www.rsc.org/images/entities/char_2009.gif) :
:![[thin space (1/6-em)]](https://www.rsc.org/images/entities/char_2009.gif) 1), and its crystallinity was expected to be compromised upon metal loading (therefore precluding refinement), but was also expected to be able to support a higher catalyst loading due to its greater number of acid sites, increasing activity in absolute terms.
1), and its crystallinity was expected to be compromised upon metal loading (therefore precluding refinement), but was also expected to be able to support a higher catalyst loading due to its greater number of acid sites, increasing activity in absolute terms.
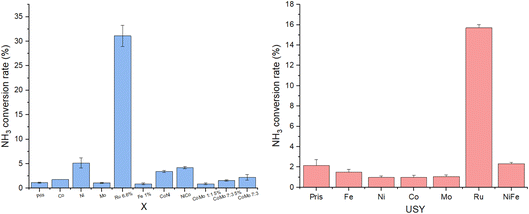
Screening results are shown in Fig. 14. Prior to catalytic testing, blank runs were carried out with pristine X and USY zeolites (designated Pris), demonstrating negligible conversion of 1–2% at 450 °C and 30![[thin space (1/6-em)]](https://www.rsc.org/images/entities/char_2009.gif) 000 WHSV. Almost every catalyst was similarly inactive under these conditions apart from Ru, which outperformed other catalysts on X by an order of magnitude at one-tenth their loading by atom% (Ru
000 WHSV. Almost every catalyst was similarly inactive under these conditions apart from Ru, which outperformed other catalysts on X by an order of magnitude at one-tenth their loading by atom% (Ru![[thin space (1/6-em)]](https://www.rsc.org/images/entities/char_2009.gif) :
:![[thin space (1/6-em)]](https://www.rsc.org/images/entities/char_2009.gif) Al of 0.1
Al of 0.1![[thin space (1/6-em)]](https://www.rsc.org/images/entities/char_2009.gif) :
:![[thin space (1/6-em)]](https://www.rsc.org/images/entities/char_2009.gif) 1), and more modestly on USY at the same loading (Ru
1), and more modestly on USY at the same loading (Ru![[thin space (1/6-em)]](https://www.rsc.org/images/entities/char_2009.gif) :
:![[thin space (1/6-em)]](https://www.rsc.org/images/entities/char_2009.gif) Al of 1
Al of 1![[thin space (1/6-em)]](https://www.rsc.org/images/entities/char_2009.gif) :
:![[thin space (1/6-em)]](https://www.rsc.org/images/entities/char_2009.gif) 1). Barring Ru, only Ni and Ni-containing bimetallic catalysts on X displayed non-negligible activities of 3.5–5%, agreeing with previous work establishing Ru-based catalysts as the most active for NH3 decomposition, and Ni as the best-performing non-noble metal catalyst.9
1). Barring Ru, only Ni and Ni-containing bimetallic catalysts on X displayed non-negligible activities of 3.5–5%, agreeing with previous work establishing Ru-based catalysts as the most active for NH3 decomposition, and Ni as the best-performing non-noble metal catalyst.9
It is worth noting the unusually low activity of Ru-USY relative to Ru-X (15.7% vs. 31.1%), especially given its higher Ru wt% of 16.5 vs. 6.6. Morales et al. noted in their attempted impregnation of USY with γ-Fe2O3 that all NPs, with an average diameter of 11.2 nm, had formed on the external surface of the zeolite, likely due to the small USY supercage size of 1.4 nm.16 Though sharing the FAU structure with similar pore and cage sizes, smaller Ru particles formed with X due to its lower metal loading were more likely to have been confined within the pores or supercages of the zeolite as opposed to being anchored on the zeolite’s external surface, thus benefiting from enhanced reactivity. Instrument limitations unfortunately prevented the screening from being conducted at 500 °C and above, which may have seen appreciable conversion rates attained by the less active earth-abundant catalysts, and allowing for meaningful intercatalyst comparison. Durak-Çetin et al. found >99% NH3 conversion over Fe-HZβ at 700 °C,63 for instance, CoMo catalysts were tested and active at 600 °C–650 °C.31,64 At the low conversion rates obtained at 450 °C, differences in activity between NiCo-X and CoNi-X or CoMo-X 1![[thin space (1/6-em)]](https://www.rsc.org/images/entities/char_2009.gif) :
:![[thin space (1/6-em)]](https://www.rsc.org/images/entities/char_2009.gif) 1 5% and CoMo-X 7
1 5% and CoMo-X 7![[thin space (1/6-em)]](https://www.rsc.org/images/entities/char_2009.gif) :
:![[thin space (1/6-em)]](https://www.rsc.org/images/entities/char_2009.gif) 3 5% lacked statistical significance, and could not be meaningfully interpreted.
3 5% lacked statistical significance, and could not be meaningfully interpreted.
Regardless, the vastly superior performance of Ru catalysts, especially considering their potential for more efficient atom utilisation upon dispersion as clusters, overrode cost and scarcity concerns, warranting their further investigation and optimisation. The synthesis of a series of Ru catalysts was subsequently performed on a number of zeolite supports of interest to the author’s research group: X, Y, β, and ZSM-5. In an effort to optimise not just absolute catalytic decomposition activity but activity weighted by Ru loading, effects of N-substitution of zeolitic supports on catalytic performance were investigated, in addition to trends in conversion vs. metal loading.
Effect of N-substitution of zeolite on NH3 conversion with MFI-type frameworks
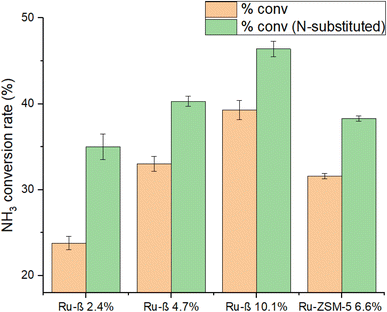
N-Substitution of a β series and ZSM-5 6.6% was performed to investigate the effects on catalytic performance following Ru loading. Decomposition data is shown in Fig. 15; encouragingly, a significant increase in activity was observed with the nitridation of MFI-structured Ru-ZSM-5 and dealuminated Ru-β, even at relatively low proportions of N-substitution (6.6% and 15% respectively, from Fig. 2).EXAFS, TEM, and BET results earlier established that N-substitution of Ru-Y resulted in a substantial decrease in Ru particle size to cluster species, increased Ru anchoring to framework O, and caused the formation of mesopores within the zeolite. Although detailed characterisation of MFI is still lacking, making definitive rationalisation of this increase in activity lie beyond the scope of this work, we may reasonably assume N-substitution in the MFI framework results in similar changes to framework structure and metal dispersion as it does in FAU. It was earlier established that N-substitution increases zeolite basicity. Ru–N coordination is likely stronger than Ru–O coordination due to the higher-lying frontier orbitals of N, increasing Ru uptake into ion-exchange sites and enhancing conversion.
It is also worth considering where nitridation is taking place within the framework in different zeolite structures, which may impact how effective nitridation will be at enhancing catalytic performance. In MFI, for instance, they do so at 10 MR straight and sinusoidal channels, and channel intersections; all ion-exchange sites are catalytically active in pores of diameter ∼5.5 Å, and N-substitution at these sites can effectively exploit the increased basicity of N to coordinate Ru during ion-exchange and form cluster catalysts.17 With the FAU Ru-Y series, however, FTIR gave evidence for the coordination of Ru to both catalytically active supercage ion-exchange sites as well as inactive sodalite cage sites (small diameter of 0.23 nm), which may hamper the impact of N-substitution on NH3 decomposition activity.
Trends in Ru loading on NH3 conversion
This work proceeded to establish trends in metal loading vs. conversion activity, to improve economy of metal loading. As opposed to standardising Ru loadings to a given wt% for all zeolite supports, Ru loaded catalysts by varying Ru![[thin space (1/6-em)]](https://www.rsc.org/images/entities/char_2009.gif) :
:![[thin space (1/6-em)]](https://www.rsc.org/images/entities/char_2009.gif) framework Al ratio for the unit cell compositions and Si
framework Al ratio for the unit cell compositions and Si![[thin space (1/6-em)]](https://www.rsc.org/images/entities/char_2009.gif) :
:![[thin space (1/6-em)]](https://www.rsc.org/images/entities/char_2009.gif) Al ratios of each zeolite were taken into account. Each framework Al corresponds to the presence of an acid site due to charge balance, with a Ru
Al ratios of each zeolite were taken into account. Each framework Al corresponds to the presence of an acid site due to charge balance, with a Ru![[thin space (1/6-em)]](https://www.rsc.org/images/entities/char_2009.gif) :
:![[thin space (1/6-em)]](https://www.rsc.org/images/entities/char_2009.gif) Al ratio of 1
Al ratio of 1![[thin space (1/6-em)]](https://www.rsc.org/images/entities/char_2009.gif) :
:![[thin space (1/6-em)]](https://www.rsc.org/images/entities/char_2009.gif) 1 theoretically corresponding to complete uptake of Ru perfectly dispersed as SA catalysts at each acid site. In practice, this premise fails to account for the presence of extra-framework Al species, as well as the aggregation of high surface-energy isolated clusters in the pores of the zeolite, and smaller NPs into larger and more stable ones on its external surface – particularly during high-temperature reductive calcination and NH3 decomposition reaction conditions. Metal loadings were therefore generally kept low (2–10 wt%) to avoid unsatisfied catalytic performance.
1 theoretically corresponding to complete uptake of Ru perfectly dispersed as SA catalysts at each acid site. In practice, this premise fails to account for the presence of extra-framework Al species, as well as the aggregation of high surface-energy isolated clusters in the pores of the zeolite, and smaller NPs into larger and more stable ones on its external surface – particularly during high-temperature reductive calcination and NH3 decomposition reaction conditions. Metal loadings were therefore generally kept low (2–10 wt%) to avoid unsatisfied catalytic performance.
Fig. 16 displays absolute and weighted conversion rates of select Ru catalysts. As expected the catalyst with the highest nominal loading Ru-Y 31.3%, with a 1![[thin space (1/6-em)]](https://www.rsc.org/images/entities/char_2009.gif) :
:![[thin space (1/6-em)]](https://www.rsc.org/images/entities/char_2009.gif) 1 Ru
1 Ru![[thin space (1/6-em)]](https://www.rsc.org/images/entities/char_2009.gif) :
:![[thin space (1/6-em)]](https://www.rsc.org/images/entities/char_2009.gif) Al ratio, exhibited the highest absolute conversion rate. It also, however, performed the poorest on the conversion%/wt% index, reflecting again the aggregation of large and catalytically inefficient Ru NPs at high metal loadings (Fig. 8). Of greater interest were Ru-β (N) 2.4% and particularly Ru-Y 3.3%, which had lower absolute conversion rates but much higher conversion%/wt% indexes, implying either (1) greater dispersion of Ru as cluster species in zeolite supercages, (2) smaller NPs formed resulting in a greater number of exposed B5 sites, or (3) both.
Al ratio, exhibited the highest absolute conversion rate. It also, however, performed the poorest on the conversion%/wt% index, reflecting again the aggregation of large and catalytically inefficient Ru NPs at high metal loadings (Fig. 8). Of greater interest were Ru-β (N) 2.4% and particularly Ru-Y 3.3%, which had lower absolute conversion rates but much higher conversion%/wt% indexes, implying either (1) greater dispersion of Ru as cluster species in zeolite supercages, (2) smaller NPs formed resulting in a greater number of exposed B5 sites, or (3) both.
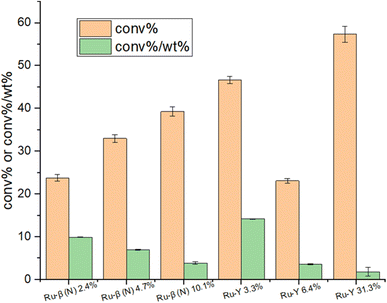 | ||
Fig. 16 Absolute conversion activities and conversion/wt% indexes of select Ru catalysts at 450 °C and 30![[thin space (1/6-em)]](https://www.rsc.org/images/entities/char_2009.gif) 000 WHSV in pure ammonia flow. Percentages reflect Ru wt%. 000 WHSV in pure ammonia flow. Percentages reflect Ru wt%. | ||
A general trend of diminishing increase in activity with increased loading was observed, with similar observations reported on other supported catalysts.65,66 This was more clearly illustrated with the Ru-β (N) series: while NH3 conversion climbed steadily from 23.8% to 33% to 39.3% with increasing Ru loading, its conversion%/wt% index dropped from 9.9 to 7.0 to 3.9, implying Ru was being used less economically. Turning to the Ru-Y series, activity passes through a maximum between 0 wt% and 6.4 wt%, before climbing back up again at higher loadings (Ru-Y 2.5% and Ru-Y 5% conversion rates were omitted due to instrument producing faulty data). A clear rationalisation for this behaviour would be the aggregation of metal species at higher loadings to less active NPs.67 To explain the local maximum at 3.3% metal loading with the Ru-Y series, we may assume a dynamic system of mobile Ru species during catalyst synthesis. At a low loading of 3.3%, Ru is highly dispersed as active cluster species within the Y framework, resulting in high activity; upon increasing the loading to 6.4%, however, due to poor Ru–O bonding and therefore poor anchoring of Ru clusters within the zeolite framework, Ru clusters migrate to the external surface of the zeolite and aggregate into large NPs during ion-exchange, minimising their surface energy – resulting in a drop-in activity.
With nitridated systems, however, we earlier provided evidence that stronger Ru–N coordination more effectively anchors Ru clusters within the zeolite, reducing the extent of their migration and aggregation at higher loadings. In the case of β (N), whose ion-exchange sites come close to saturation at 10 wt% loading with a Ru![[thin space (1/6-em)]](https://www.rsc.org/images/entities/char_2009.gif) :
:![[thin space (1/6-em)]](https://www.rsc.org/images/entities/char_2009.gif) Al ratio of 0.9
Al ratio of 0.9![[thin space (1/6-em)]](https://www.rsc.org/images/entities/char_2009.gif) :
:![[thin space (1/6-em)]](https://www.rsc.org/images/entities/char_2009.gif) 1, the decreased economy of Ru loading observed may be simply rationalised by a statistical factor, wherein occupancy of the majority of ion-exchange sites by Ru clusters decreases the likelihood of additional Ru occupying the few remaining ion-exchange sites relative to aggregation on the zeolite exterior. N-Substitution could therefore potentially be used to avoid sintering even at high metal loadings corresponding close to ion-exchange site saturation, allowing for the development of more active catalysts. Absolute NH3 conversion as well as specific activity of the catalyst with highest conversion%/wt% index synthesised, Ru-β (N) 2.4%, was compared with those of other supported Ru-catalysts from recent literature in Table 5 – these included K-promoted layered double oxides, CNTs, and barium hexaaluminate. Our sample compared well in performance with those reported in the literature at comparable or higher loadings, and under identical reaction conditions.
1, the decreased economy of Ru loading observed may be simply rationalised by a statistical factor, wherein occupancy of the majority of ion-exchange sites by Ru clusters decreases the likelihood of additional Ru occupying the few remaining ion-exchange sites relative to aggregation on the zeolite exterior. N-Substitution could therefore potentially be used to avoid sintering even at high metal loadings corresponding close to ion-exchange site saturation, allowing for the development of more active catalysts. Absolute NH3 conversion as well as specific activity of the catalyst with highest conversion%/wt% index synthesised, Ru-β (N) 2.4%, was compared with those of other supported Ru-catalysts from recent literature in Table 5 – these included K-promoted layered double oxides, CNTs, and barium hexaaluminate. Our sample compared well in performance with those reported in the literature at comparable or higher loadings, and under identical reaction conditions.
![[thin space (1/6-em)]](https://www.rsc.org/images/entities/char_2009.gif) 000 WHSV in pure ammonia flow
000 WHSV in pure ammonia flow
| Catalyst | Ru wt% | NH3 conversion (%) | Conv.%/wt% | Reference |
|---|---|---|---|---|
| K-Ru/Mg2Al-LDO | 4.6 | 42.7 | 9.3 | 68 |
| K-Ru/Mg2Al-MM | 4.6 | 35.3 | 7.7 | 68 |
| K-Ru/MgO | 4.6 | 33.7 | 7.3 | 68 |
| K-Ru/Al2O3 | 4.6 | 34.8 | 7.6 | 68 |
| Ru/CNTs | 2.5 | 17.0 | 6.8 | 69 |
| Ru/BHA | 2.7 | 40.0 | 14.8 | 69 |
| Cs-Ru/Ba-ZrO2 | 3.0 | 37.8 | 12.6 | 70 |
| Ru/La-ZrO2 (LSZ) | 3.0 | 40.0 | 13.3 | 71 |
| Ru-β (N) 2.4% | 2.4 | 35.0 | 14.6 | This work |
Conclusion
Characterisation focused on Ru-Y 6.4% and Ru-Y (N) 6.4%. ICP-MS established a real Ru loading of 2.5% for both samples. 29Si NMR and FTIR gave evidence for the incorporation of N into the Y framework; XANES and FTIR further showed evidence of Ru–N coordination following N-substitution in Ru-Y, with an associated increase in coordination of these clusters to supercage and sodalite cage ion-exchange sites. XRD, TEM, and EXAFS additionally demonstrated N-substitution increases Ru dispersion as stably anchored clusters in the zeolite framework, with DFT modelling providing a proposed prismatic Ru6N6 cluster that fits the XANES and EXAFS spectra of N-substituted Y catalysts, as well as experimentally derived Ru–Ru and Ru–O/N CN values. BET analysis showed N-substitution treatment introduced mesopores into the Y framework. 18 monometallic and bimetallic catalysts were synthesised on X and USY in an initial screening, which demonstrated Ru was the most active for NH3 decomposition by a significant margin, followed by Ni. Ru catalysts were then synthesised and optimised with X, Y, β, and ZSM-5; N-substitution was observed to significantly increase conversion activities of MFI zeolite systems Ru-β and Ru-ZSM-5. Trends also showed diminishing increase in activity with increasing Ru loading on non-N substituted zeolites, likely due to larger and less active NPs forming due to poorer Ru–O coordination leading to ineffective anchoring of Ru clusters within the zeolite, and their migration to the zeolite external surface followed by aggregation. Ru-β (N) 2.4% demonstrates comparable or higher activity by Ru wt% to recently reported catalysts in the literature.In work to optimise catalysts for NH3 decomposition, this work has clearly demonstrated the enhancement of catalytic activity in MFI by incorporation of N into the zeolite framework, and given evidence for the higher dispersion of Ru species as anchored clusters in FAU that is likely the cause for this improvement. All techniques employed in the characterisation of Ru-Y should be applied to MFI structures, to see if the same results hold, so the increase in decomposition activity of Ru-β and Ru-ZSM-5 can be conclusively justified. Synthesis of Ru catalysts of significantly lower loading – starting at 1 wt% and working down – may additionally allow us to prove the confinement of Ru cluster species in supercages, via TEM and SXRD. The mechanism of NH3 activation by anchored Ru clusters should be investigated – in particular the role of N. Compared to O, which is harder with its interactions with Ru more electrostatics-based, N has higher-lying orbitals which may interact with those of Ru. Fig. 17, for instance, shows a back-donation by the extended 5d orbitals of a Ru in an anchored Ru6N6 cluster to N 2p – decreasing the electron density at Ru, resulting in a stronger coordination to NH3 when it binds. Some evidence of this has already been gathered in this work by XANES analysis. Alternatively, the electron-poorer Ru may enhance conversion rate by decreasing the double bond character of Ru–N in the dissociation of molecular N2, the rate-limiting step of NH3 decomposition at low temperatures as earlier noted, due to poorer back-donation (Fig. 17).
As noted, the extent of catalytic activity enhancement with nitridation may vary with specific features of zeolite structures. In MFI, for instance, it may be that N–Al orbital overlap in Si–N–Al of sinusoidal channels is poorer as compared to linear ones due to angle strain, resulting in the lone pairs on N being more available for coordination to Ru upon its loading, resulting in increased metal dispersion and enhancing activity. An investigation of Si–N–Al angles between MFI frameworks with SXRD would be informative in the future – particularly in channels of different sizes, e.g. with β (12 MR, 0.67 nm) having a larger pore size than ZSM-5 (10 MR, 0.55 nm).72,73 While work in this paper has clearly demonstrated promising potential of Ru-loaded zeolites for NH3 decomposition, its significance lies in paving the way for further optimisation of zeolite-based catalyst systems.
Conflicts of interest
There are no conflicts to declare.References
- S. F. Yin, B. Q. Xu, X. P. Zhou and C. T. Au, A mini-review on ammonia decomposition catalysts for on-site generation of hydrogen for fuel cell applications, Appl. Catal., A, 2004, 277, 1–9 CrossRef CAS.
- Y. Li, et al., Photocatalytic water splitting by N-TiO2 on MgO (111) with exceptional quantum efficiencies at elevated temperatures, Nat. Commun., 2019, 10, 4421 CrossRef PubMed.
- I. Dincer and C. Acar, Review and evaluation of hydrogen production methods for better sustainability, Int. J. Hydrogen Energy, 2015, 40, 11094–11111 CrossRef CAS.
- T. E. Bell and L. Torrente-Murciano, H2 production via ammonia decomposition using non-noble metal catalysts: A review, Top. Catal., 2016, 59, 1438–1457 CrossRef CAS.
- L. Green, An ammonia energy vector for the hydrogen economy, Int. J. Hydrogen Energy, 1982, 7, 355–359 CrossRef CAS.
- V. Alagharu, S. Palanki and K. N. West, Analysis of ammonia decomposition reactor to generate hydrogen for fuel cell applications, J. Power Sources, 2010, 195, 829–833 CrossRef CAS.
- F. Schüth, R. Palkovits, R. Schlögl and D. S. Su, Ammonia as a possible element in an energy infrastructure: catalysts for ammonia decomposition, Energy Environ. Sci., 2012, 5, 6278–6289 RSC.
- D. A. Hansgen, D. G. Vlachos and J. G. Chen, Using first principles to predict bimetallic catalysts for the ammonia decomposition reaction, Nat. Chem., 2010, 2, 484–489 CrossRef CAS PubMed.
- T. A. Le, Q. C. Do, Y. Kim, T. W. Kim and H. J. Chae, A review on the recent developments of ruthenium and nickel catalysts for COx-free H2 generation by ammonia decomposition, Korean J. Chem. Eng., 2021, 38, 1087–1103 CrossRef CAS.
- J. C. Ganley, F. S. Thomas, E. G. Seebauer and R. I. Masel, A priori catalytic activity correlations: the difficult case of hydrogen production from ammonia, Catal. Lett., 2004, 96, 117–122 CrossRef CAS.
- W. Tsai and W. H. Weinberg, Steady-state decomposition of ammonia on the Ru(001) surface, J. Phys. Chem., 1987, 91, 5302–5307 CrossRef CAS.
- L. Wang, Y. Zhao, C. Liu, W. Gong and H. Guo, Plasma driven ammonia decomposition on a Fe-catalyst: Eliminating surface nitrogen poisoning, Chem. Commun., 2013, 49, 3787–3789 RSC.
- R. J. Davis, New perspectives on basic zeolites as catalysts and catalyst supports, J. Catal., 2003, 216, 396–405 CrossRef CAS.
- Q. Sun, N. Wang and J. Yu, Advances in catalytic applications of zeolite- supported metal catalysts, Adv. Mater., 2021, 33, 2104442 CrossRef CAS.
- J. R. Ugal, M. Mustafa and A. A. Abdulhadi, Preparation of zeolite type 13X from locally available raw materials, Iraqi J. Chem. Pet. Eng., 2008, 9, 51–56 Search PubMed.
- I. Morales, et al., Induction heating in nanoparticle impregnated zeolite, Materials, 2020, 13, 4013 CrossRef CAS PubMed.
- P. J. Smeets, J. S. Woertink, B. F. Sels, E. I. Solomon and R. A. Schoonheydt, Transition-metal ions in zeolites: Coordination and activation of oxygen, Inorg. Chem., 2010, 49, 3573–3583 CrossRef CAS PubMed.
- T. Melchior, D. E. W. Vaughan and A. J. M. Jacobson, et al., Characterization of the silicon-aluminum distribution in synthetic faujasites by high-resolution solid-state 29Si NMR, J. Am. Chem. Soc., 1982, 104, 4859–4864 CrossRef.
- I. Díaz, E. Kokkoli, O. Terasaki and M. Tsapatsis, Surface structure of zeolite (MFI) crystals, Chem. Mater., 2004, 16, 5226–5232 CrossRef.
- Y. Li, L. Li and J. Yu, Applications of zeolites in sustainable chemistry, Chem, 2017, 3, 928–949 CAS.
- F. Dogan, et al., Searching for microporous, strongly basic catalysts: Experimental and calculated 29Si NMR spectra of heavily nitrogen-doped Y zeolites, J. Am. Chem. Soc., 2009, 131, 11062–11079 CrossRef CAS.
- K. Narasimharao, M. Hartmann, H. H. Thiel and S. Ernst, Novel solid basic catalysts by nitridation of zeolite beta at low temperature, Microporous Mesoporous Mater., 2006, 90, 377–383 CrossRef CAS.
- S. V. Donk, A. H. Janssen, J. H. Bitter and K. P. D. Jong, Generation, characterization, and impact of mesopores in zeolite catalysts, Catal. Rev.: Sci. Eng., 2003, 45, 297–319 CrossRef.
- D. Mcqueen, F. Fajula, R. Dutartre, L. V. C. Rees and P. Schulz, Diffusion of xylene isomers in dealuminated mazzite zeolites by the frequency response technique, Stud. Surf. Sci. Catal., 1997, 84, 1339–1346 CrossRef.
- G. Alonso, et al., Zeolite-encapsulated single-atom catalysts for efficient CO2 conversion, J. CO2 Util., 2021, 54, 101777 CrossRef CAS.
- J. D. Kistler, et al., A single-site platinum CO oxidation catalyst in zeolite KLTL: Microscopic and spectroscopic determination of the locations of the platinum atoms, Angew. Chem., Int. Ed., 2014, 53, 8904–8907 CrossRef CAS.
- J. Shan, M. Li, L. F. Allard, S. Lee and M. Flytzani-Stephanopoulos, Mild oxidation of methane to methanol or acetic acid on supported isolated Rhodium catalysts, Nature, 2017, 551, 605–608 CrossRef CAS PubMed.
- Q. Sun, et al., Zeolite-encaged single-atom Rhodium catalysts: Highly-efficient hydrogen generation and shape-selective tandem hydrogenation of nitroarenes, Angew. Chem., 2019, 131, 18743–18749 CrossRef.
- A. Boisen, S. Dahl, J. K. Nørskov and C. H. Christensen, Why the optimal ammonia synthesis catalyst is not the optimal ammonia decomposition catalyst, J. Catal., 2005, 230, 309–312 CrossRef CAS.
- K. E. Lamb, M. D. Dolan and D. F. Kennedy, Ammonia for hydrogen storage; a review of catalytic ammonia decomposition and hydrogen separation and purification, Int. J. Hydrogen Energy, 2019, 44, 3580–3593 CrossRef CAS.
- X. Duan, G. Qian, X. Zhou, D. Chen and W. Yuan, MCM-41 supported Co–Mo bimetallic catalysts for enhanced hydrogen production by ammonia decomposition, Chem. Eng. J., 2012, 207–208, 103–108 CrossRef CAS.
- J. Zhang, et al., Individual Fe-Co alloy nanoparticles on carbon nanotubes: Structural and catalytic properties, Nano Lett., 2008, 8, 2738–2743 CrossRef CAS PubMed.
- S. Dahl, E. Tornqvist and I. Chorkendorff, Dissociative adsorption of N2 on Ru(0001): a surface reaction totally dominated by steps, J. Catal., 2000, 192, 381–390 CrossRef CAS.
- F. R. García-García, A. Guerrero-Ruiz and I. Rodríguez-Ramos, Role of B5-type sites in Ru catalysts used for the NH3 decomposition reaction, Top. Catal., 2009, 52, 758–764 CrossRef.
- H. Bielawa, O. Hinrichsen, A. Birkner and M. Muhler, The ammonia-synthesis catalyst of the next generation: Barium-promoted oxide-supported Ruthenium, Angew. Chem., Int. Ed., 2001, 40, 1061–1063 CrossRef CAS.
- W. Raróg-Pilecka, E. Miśkiewicz, D. Szmigiel and Z. Kowalczyk, Structure sensitivity of ammonia synthesis over promoted Ruthenium catalysts supported on graphitised carbon, J. Catal., 2005, 231, 11–19 CrossRef.
- Z. Song, T. Cai, J. C. Hanson, J. A. Rodriguez and J. Hrbek, Structure and reactivity of Ru nanoparticles supported on modified graphite surfaces: A study of the model catalysts for ammonia synthesis, J. Am. Chem. Soc., 2004, 126, 8576–8584 CrossRef CAS PubMed.
- G. P. Connor and P. L. Holland, Coordination chemistry insights into the role of alkali metal promoters in dinitrogen reduction, Catal. Today, 2017, 286, 21–40 CrossRef CAS PubMed.
- R. Freund, et al., The current status of MOF and COF applications, Angew. Chem., Int. Ed., 2021, 60, 23975–24001 CrossRef CAS PubMed.
- Y. Chen, et al., Single-atom catalysts: Synthetic strategies and electrochemical applications, Joule, 2018, 2, 1242–1264 CrossRef CAS.
- P. Liu, R. Qin, G. Fu and N. Zheng, Surface coordination chemistry of metal nanomaterials, J. Am. Chem. Soc., 2017, 139, 2122–2131 CrossRef CAS PubMed.
- X. K. Li, W. J. Ji, J. Zhao, S. J. Wang and C. T. Au, Ammonia decomposition over Ru and Ni catalysts supported on fumed SiO2, MCM-41, and SBA-15, J. Catal., 2005, 236, 181–189 CrossRef CAS.
- P. Yin, et al., Single cobalt atoms with precise N-coordination as superior oxygen reduction reaction catalysts, Angew. Chem., 2016, 128, 10958–10963 CrossRef.
- P. M. Arnal, C. Weidenthaler and F. Schüth, Highly monodisperse zirconia-coated silica spheres and zirconia/silica hollow spheres with remarkable textural properties, Chem. Mater., 2006, 18, 2733–2739 CrossRef CAS.
- W. C. Lin, et al., Cooperative catalytically active sites for methanol activation by single metal ion-doped H-ZSM-5, Chem. Sci., 2021, 12, 210–219 RSC.
- S. Abate, K. Barbera, G. Centi, P. Lanzafame and S. Perathoner, Disruptive catalysis by zeolites, Catal. Sci. Technol., 2016, 6, 2485–2501 RSC.
- C. Hammond, S. Conrad and I. Hermans, Simple and scalable preparation of highly active Lewis acidic Sn-β, Angew. Chem., Int. Ed., 2012, 51, 11736–11739 CrossRef CAS PubMed.
- S. Dzwigaj, et al., Incorporation of vanadium species in a dealuminated β zeolite, Chem. Commun., 1998, 87–88 RSC.
- J. Cha, et al., Ammonia as an efficient COx-free hydrogen carrier: Fundamentals and feasibility analyses for fuel cell applications, Appl. Energy, 2018, 224, 194–204 CrossRef CAS.
- S. Kweon, H. An, C. H. Shin, M. B. Park and H. K. Min, Nitrided Ni/N-zeolites as efficient catalysts for the dry reforming of methane, J. CO2 Util., 2021, 46, 101478 CrossRef CAS.
- K. D. Hammond, et al., Spectroscopic signatures of nitrogen-substituted zeolites, J. Am. Chem. Soc., 2008, 130, 14912–14913 CrossRef CAS PubMed.
- P. Fink and J. Datka, Infrared spectroscopic studies of amination of ZSM-5 zeolites, J. Chem. Soc., Faraday Trans. 1, 1989, 85, 3079–3086 RSC.
- L. M. Kustov and W. M. H. Sachtler, FTIR study of the effects of water pretreatment on the acid sites and the dispersion of metal particles in Y zeolites and mordenites, J. Mol. Catal., 1992, 71, 233–244 CrossRef CAS.
- L. Dubau, C. Coutanceau, E. Garnier, J.-M. L. Ger and C. Lamy, Electrooxidation of methanol at platinum-ruthenium catalysts prepared from colloidal precursors: Atomic composition and temperature effects, J. Appl. Electrochem., 2003, 33, 419–429 CrossRef CAS.
- S. Y. Tee, et al., Amorphous ruthenium nanoparticles for enhanced electrochemical water splitting, Nanotechnology, 2015, 26, 415401 CrossRef PubMed.
- L. S. Kumara, et al., Origin of the catalytic activity of face-centered-cubic ruthenium nanoparticles determined from an atomic-scale structure, Phys. Chem. Chem. Phys., 2016, 18, 30622–30629 RSC.
- N. S. Marinkovic, K. Sasaki and R. R. Adzic, Determination of single- and multi-component nanoparticle sizes by X-ray absorption spectroscopy, J. Electrochem. Soc., 2018, 165, J3222–J3230 CrossRef CAS.
- S. Li, et al., Structural and electronic properties of Run clusters (n = 2–14) studied by first-principles calculations, Phys. Rev. B: Condens. Matter Mater. Phys., 2007, 76, 045410 CrossRef.
- N. Chakroune, et al., Acetate- and thiol-capped monodisperse ruthenium nanoparticles: XPS, XAS, and HRTEM studies, Langmuir, 2005, 21, 6788–6796 CrossRef CAS PubMed.
- R. K. Hocking, et al., Fe L-edge XAS studies of K4[Fe(CN)6] and K3[Fe(CN)6]: A direct probe of back-bonding, J. Am. Chem. Soc., 2006, 128, 10442–10451 CrossRef CAS PubMed.
- P. Levecque, D. W. Gammon, P. Jacobs, D. D. Vos and B. Sels, The use of ultrastable Y zeolites in the Ferrier rearrangement of acetylated and benzylated glycals, Green Chem., 2010, 12, 828–835 RSC.
- G. Agostini, et al., In situ XAS and XRPD parametric Rietveld refinement to understand dealumination of Y zeolite catalyst, J. Am. Chem. Soc., 2010, 132, 667–678 CrossRef CAS PubMed.
- Y. Durak-Çetin, Ş. Sarıoğlan, A. Sarıoğlan and H. Okutan, The effect of support type on the activity of zeolite supported iron catalysts for the decomposition of ammonia, React. Kinet., Mech. Catal., 2016, 118, 683–699 CrossRef.
- X. Duan, et al., Understanding Co–Mo catalyzed ammonia decomposition: Influence of calcination atmosphere and identification of active phase, ChemCatChem, 2016, 8, 938–945 CrossRef CAS.
- G. Qi and R. T. Yang, Selective catalytic oxidation (SCO) of ammonia to nitrogen over Fe/ZSM-5 catalysts, Appl. Catal., A, 2005, 287, 25–33 CrossRef CAS.
- X. Duan, et al., Tuning the size and shape of Fe nanoparticles on carbon nanofibers for catalytic ammonia decomposition, Appl. Catal., B, 2011, 101, 189–196 CrossRef CAS.
- Z. P. Hu, L. Chen, C. Chen and Z. Y. Yuan, Fe/ZSM-5 catalysts for ammonia decomposition to COx-free hydrogen: Effect of SiO2/Al2O3 ratio, Mol. Catal., 2018, 455, 14–22 CrossRef CAS.
- Q. Su, et al., Layered double hydroxide derived Mg2Al-LDO supported and K-modified Ru catalyst for hydrogen production via ammonia decomposition, Catal. Lett., 2018, 148, 894–903 CrossRef CAS.
- Z. Wang, Z. Cai and Z. Wei, Highly active ruthenium catalyst supported on barium hexaaluminate for ammonia decomposition to COx-free hydrogen, ACS Sustainable Chem. Eng., 2019, 7, 8226–8235 CrossRef CAS.
- Z. Wang, Y. Qu, X. Shen and Z. Cai, Ruthenium catalyst supported on Ba modified ZrO2 for ammonia decomposition to COx-free hydrogen, Int. J. Hydrogen Energy, 2019, 44, 7300–7307 CrossRef CAS.
- B. Lorenzut, et al., Embedded Ru@ZrO2 catalysts for H2 production by ammonia decomposition, ChemCatChem, 2010, 2, 1096–1106 CrossRef CAS.
- K. Möller, B. Yilmaz, U. Müller and T. Bein, Hierarchical zeolite beta via nanoparticle assembly with a cationic polymer, Chem. Mater., 2011, 23, 4301–4310 CrossRef.
- W. Hao, W. Zhang, Z. Guo, J. Ma and R. Li, Mesoporous beta zeolite catalysts for benzylation of naphthalene: effect of pore structure and acidity, Catalysts, 2018, 8, 504 CrossRef.
Footnotes |
| † Electronic supplementary information (ESI) available. See DOI: https://doi.org/10.1039/d2fd00175f |
| ‡ Co-first authors. |
| This journal is © The Royal Society of Chemistry 2023 |

