Stable deep-blue FAPbBr3 quantum dots facilitated by amorphous metal halide matrices†
Wei
Shen‡
*a,
Yue
Qiu‡
a,
Jiayu
Jiang
a,
Zhihua
Chen
a,
Yanxing
He
a,
Hao
Cui
a,
Lihui
Liu
a,
Gang
Cheng
 b,
Andrey N.
Aleshin
c and
Shufen
Chen
 *a
*a
aState Key Laboratory of Organic Electronics and Information Displays & Institute of Advanced Materials (IAM), Nanjing University of Posts & Telecommunications, Nanjing 210023, People's Republic of China. E-mail: iamwshen@njupt.edu.cn; iamsfchen@njupt.edu.cn
bState Key Laboratory of Synthetic Chemistry, HKU-CAS Joint Laboratory on New Materials, and Department of Chemistry, The University of Hong Kong, Pokfulam Road, Hong Kong, P. R. China
cLoffe Institute, St. Petersburg 194021, Russia
First published on 22nd August 2023
Abstract
This communication describes a strategy to synthesize stable deep blue FAPbBr3 quantum dots (QDs) by constructing a matrix structure. Amorphous Ni2+-based metal halide matrices can stabilize QDs from both chemical and physical factors, and Ni2+ doping can further enhance their structural stability due to lattice shrinking. Such deep blue QD films exhibit stable X-ray diffraction patterns and photoluminescence even after 245 days of storage.
Lead halide perovskite nanocrystals (LHP NCs) with high photoluminescent quantum yield (PLQY), tunable colors, and high color saturation have attracted great interest in the field of lighting and display.1–6 As a primary color for display, deep blue LHP NCs have suffered from serious color drift and intensity degradation, which result from the ionic migration for mixed halide systems or dimensional evolution for quantum confined systems.7,8 It should be noted that the ionic migration of LHP cannot be inhibited due to its ionic nature. As a double-edged sword, the quantum confinement effect leads to the band gap of LHP blueshift to realize blue emission, while quantum-confined materials with a high surface-to-volume ratio result in high surface energy and tend to be unstable.9–11 Therefore, using surface engineering to decrease surface energy is an effective way to prohibit the changes of quantum-confined LHP in structure and dimension for achieving stable deep blue LHP.12
Generally, surface engineering for LHP can be employed via ligand passivation or construction of the core–shell/matrix structure.13,14 As is known, ligand passivation is based on chemical adsorption.15 Although ligands having strong affinity, functional groups can passivate vacancies and reduce ligand shedding, the dynamic adsorption and desorption process of ligands is a key factor to degrade the optoelectronic properties of LHP in the long term.16–20 According to the properties of common quantum dots (QDs), the core–shell structure can stabilize the core from both chemical and physical factors.21 Whereas, such a compact core–shell structure can hardly be achieved for LHP due to the incompatibility of the ionic LHP core and covalent shell (ZnS, PbS, etc.).22–24 Using ionic metal halide matrix can decrease such mismatch and lattice strain to enhance the stability of CsPbI3 QDs.25–27 Therefore, the fabricated metal halide matrix has the potential to construct stable deep blue QDs.28–30
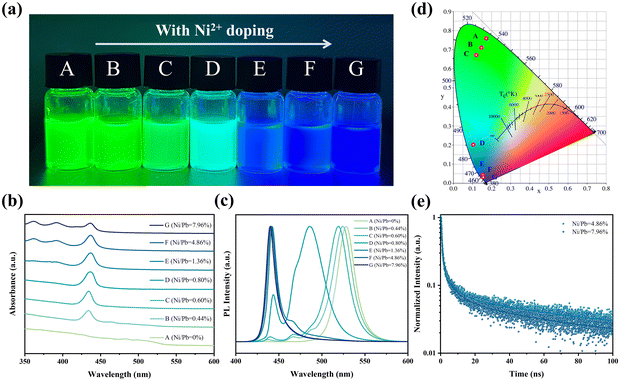
Deep blue QDs were synthesized using a ligand-assisted reprecipitation method (details in the experimental section, ESI†). As shown in Fig. 1a, increasing the feeding ratios of Ni/Pb could directly adjust the QD emission colors from green to deep blue. In order to obtain the precise Ni/Pb ratios, inductively coupled plasma mass spectrometry (ICP-MS) was employed (Table S1, ESI†), and the Ni/Pb ratio was from 0 to 7.96%. According to the UV-vis spectra (Fig. 1b), a distinct first exciton absorption peak (434 nm) was observed when introducing Ni2+. Such sharp exciton absorption peaks suggest a strong quantum-confined system. When the Ni/Pb ratio was greater than 1.36%, distinct second and third exciton peaks appeared, which implied QDs with high quality. Additionally, the bulk absorption peak of FAPbBr3 (535 nm) gradually decreased with increasing Ni/Pb ratio, which suggested the decrease of green emission. We also used photoluminescent (PL) spectra to monitor such evolution (Fig. 1c). In the condition of Ni/Pb = 0.44%, multiple PL peaks at the blue region could be observed, accompanied by a blueshift of green emission. When the Ni/Pb ratio increased to 0.80%, all PL peaks shifted to the blue region. The multiple PL peaks tended to be one peak when Ni/Pb ratio was 1.36%. At last, only one PL peak at 442 nm could be obtained by further increasing the Ni/Pb ratio to 4.86% or 7.96%. Based on these PL spectra, the Commission Internationalede l’Eclairage (CIE) coordinate evolution was calculated (Fig. 1d), and the deep blue QDs (Ni/Pb = 4.8 and 7.96%) were located at (0.058, 0.031). Furthermore, the PLQYs for both deep blue QDs were 40% and 32%, respectively, which might result in non-optically active Ni2+ doping. As shown in Fig. 1e and Table S2 (ESI†), the average PL lifetimes of the deep blue QDs were 62.98 ns (Ni/Pb = 4.86%) and 38.82 ns (Ni/Pb = 7.96%).
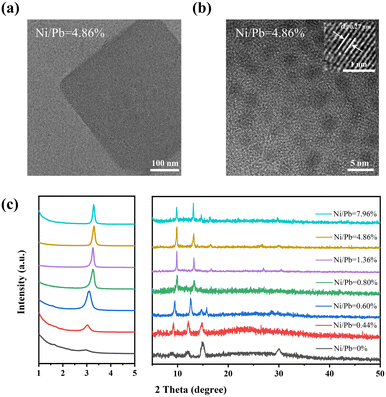
In order to study the formation mechanism of deep blue QDs, transmission electron microscopy (TEM) and high-resolution TEM (HRTEM) were employed to identify their structures. As shown in Fig. S1 (ESI†), the pristine sample (Ni/Pb = 0) was a mixture of FAPbBr3 NCs and nanoplates. With increasing Ni/Pb ratio, FAPbBr3 NCs and nanoplates gradually decreased, and thin nanosheets appeared. Furthermore, the center of the nanosheets was not transparent, while the edge of the nanosheets showed poor crystallization, which implied the compositions of the center and edge were not the same. It should be noted that the samples exhibited a sharp deep blue emission accompanying the appearance of such nanosheets. We employed HRTEM to insight into the internal nanostructures of deep blue nanosheets (Ni/Pb = 4.86%). As shown in Fig. 2a, there were many black dots in the untransparent center region. Then, upon further increasing the magnification times, uniform QDs of 2.70 nm ± 0.05 nm (Fig. S2, ESI†) could be clearly observed (Fig. 2b), which matched well with their deep blue emission. Such QDs also exhibited good crystallization, and a clear lattice distance of 0.27 nm could be observed corresponding to the (210) plane of FAPbBr3 (the inset in Fig. 2b).31 Furthermore, the compositions of nanosheets and QDs were measured by elemental mapping. A typical nanosheet (Fig. S3, ESI†) was selected with a transparent edge and an untransparent center. In a high-angle annular dark-field scanning transmission electron microscopy image (HAADF-STEM, Fig. S4a, ESI†), only the center of the nanosheet exhibited white color, suggesting a dense center and less dense edge. On the basis of elemental mapping images (Fig. S4b–d, ESI†), N, Pb, and Br were uniformly distributed in the center of the nanosheet. As a result, these QDs in the center were FAPbBr3 QDs. Additionally, Ni was uniformly distributed in the whole nanosheet (Fig. S4e and f, ESI†). For one part, such results suggested that Ni2+-based materials were the main compositions of the nanosheet edge, which could act as the metal halide matrix to limit the growth of FAPbBr3 QDs. As a result, small FAPbBr3 QDs could disperse uniformly and compactly in the matrix, which could prevent the dimensional evolution of QDs. In another part, Ni2+ might dope into FAPbBr3 QDs. The small-sized Ni2+ doping could induce the shrinking of the crystal lattice to enhance the stability of QDs. Then, X-ray diffraction (XRD) was employed to perform the structural characterization. As shown in Fig. 2c, two main diffraction peaks at 15.0 and 30.0° corresponded to the (100) and (200) planes, respectively, of bulk FAPbBr3, and weak diffraction peaks at 3.0, 8.8, and 12.0° corresponded to the characteristics of low-dimensional FAPbBr3. According to the Bragg formula, the peak at 3.3° could be assigned to the size of 2.7 nm QDs, which matched well with the TEM results. The peaks at 9.8, 13.1, and 16.5° were the high-order diffraction peaks of the close-packed QDs. With increasing Ni/Pb ratios, the peaks of (100) and (200) planes became weak, indicating the decrease of bulk FAPbBr3, while the enhanced peaks of FAPbBr3 QDs confirmed an increased proportion of QDs. It should be emphasized that all the characteristics of QDs shifted to a high angle with an increasing Ni/Pb ratio. This result demonstrated that small-sized Ni2+ doped into FAPbBr3 QDs to replace a part of Pb2+. Furthermore, we measured the XRD patterns of the Ni2+-based metal halide matrix (Fig. S5, ESI†). No characteristic peaks could be obtained, which suggested that this matrix was amorphous. Therefore, such an amorphous matrix must be poor crystallinity, exhibiting no crystal lattices, and low contrast in TEM images.
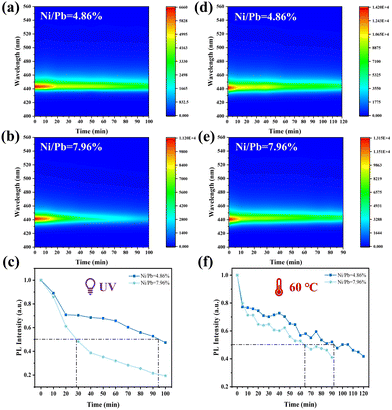
Benefitting from the Ni2+-based matrix and small-sized Ni2+ doping, the stability of deep blue FAPbBr3 QDs must be greatly enhanced. The stability of their optical properties was evaluated by accelerated aging tests, such as UV and heat aging. The UV resistance of deep blue FAPbBr3 QDs (Ni/Pb = 4.86 and 7.96%) was measured under 365 nm (8W) and 254 nm (8 W) UV lamps. PL intensity decay curves were used to identify the half-lifetimes of each sample. As shown in Fig. 3a and b, both samples exhibited stable PL spectra without the PL shift, and the PL intensities of FAPbBr3 QDs (Ni/Pb = 4.86%) degraded much more slowly. According to Fig. 3c, the half-lifetimes of each sample were 95 (Ni/Pb = 4.86%) and 28 min (Ni/Pb = 7.96%). The thermal resistance of deep blue FAPbBr3 QDs also exhibited similar results (Fig. 3d and e), and the half-lifetimes of each sample at 60 °C were 92 (Ni/Pb = 4.86%) and 65 min (Ni/Pb = 7.96%). Therefore, a suitable Ni/Pb ratio could shrink the crystal lattice to enhance stability, while a high Ni/Pb ratio might induce more lattice distortion to decrease stability.
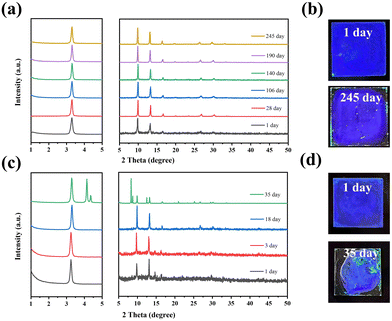
The structural stability of the deep-blue FAPbBr3 QDs (Ni/Pb = 4.86 and 7.96%) was also measured via time-dependent XRD patterns. Two deep blue films were fabricated and stored in ambient conditions. As shown in Fig. 4a, FAPbBr3 the QD film (Ni/Pb = 4.86%) exhibited stable XRD patterns after 245 days of storage, and the film emitted deep blue light under a UV lamp (Fig. 4b). While the FAPbBr3 QDs film (Ni/Pb = 7.96%) exhibited much poor structural stability. Only after 35 days of storage, new XRD patterns appear accompanied by the green emission of the film. It should be noted that Ni2+ can easily absorb moisture. Excess Ni2+ will induce intense hydrolysis, resulting in poor stability. According to the above results, deep blue FAPbBr3 QDs with a 4.86% Ni/Pb ratio had the best optical and structural stabilities.
In summary, we successfully achieved stable deep blue FAPbBr3 QDs facilitated by a Ni2+-based metal halide matrix. Only if the Ni/Pb ratio was greater than 4.86%, FAPbBr3 materials exhibited strong quantum confined properties, and a single PL peak at 442 nm could be obtained. Based on HRTEM and XRD results, FAPbBr3 QDs were dispersed uniformly and compactly in the amorphous matrix, and a part of Ni2+ was doped into FAPbBr3 QDs. Benefitting from matrix protection and lattice shrinkage, FAPbBr3 QDs exhibited good optical and structural stability. Therefore, the strategy of using a metal halide matrix and doping could effectively boost the stability of quantum-confined perovskite materials to realize high color saturation for lighting and display.
W. S. and Y. Q. contributed equally to this work. S. C. conceived the research. W. S. W.S. designed the experiments, analyzed data, and revised the article. Y. Q. performed the experiments and article writing. J. J. and Z. C. assisted in the stability tests. Y. X. and H. C. assisted in the tests of PLQY and PL lifetime. L. L., G. C., and N. A. assisted in article writing and revision. All authors approved the manuscript.
This work was supported by the National Natural Science Foundation of China (Grant No. 62074083, 62005131), the Priority Academic Program Development of Jiangsu Higher Education Institutions (Grant No. YX030003), the Natural Science Fund for Colleges and Universities in Jiangsu Province (Grant No. 20KJA510005).
Conflicts of interest
There are no conflicts to declare.Notes and references
- A. Dutta, R. K. Behera, P. Pal, S. Baitalik and N. Pradhan, Angew. Chem., Int. Ed., 2019, 58, 5552–5556 CrossRef CAS PubMed.
- X. Wang, Z. Bao, Y.-C. Chang and R.-S. Liu, ACS Energy Lett., 2020, 5, 3374–3396 CrossRef CAS.
- X. Zhang, C. Wang, Y. Zhang, X. Zhang, S. Wang, M. Lu, H. Cui, S. V. Kershaw, W. W. Yu and A. L. Rogach, ACS Energy Lett., 2018, 4, 242–248 CrossRef.
- Y. Ji, J. B. Zhang, H. R. Shen, Z. Su, H. Cui, T. Lan, J. Q. Wang, Y. H. Chen, L. Liu, K. Cao, W. Shen and S. Chen, ACS Omega, 2021, 6, 13831–13838 CrossRef CAS PubMed.
- X. Ye, C. Li, J. Jiang, X. Zheng, Q. Han, Q. Lin, Y. Liu and X. Tao, Chem. Commun., 2023, 59, 3403–3406 RSC.
- W. Shen, J. Zhang, R. Dong, Y. Chen, L. Yang, S. Chen, Z. Su, Y. Dai, K. Cao, L. Liu, S. Chen and W. Huang, Research, 2021, 2021, 9829374 CrossRef CAS PubMed.
- Z. Xiao, L. Zhao, N. L. Tran, Y. L. Lin, S. H. Silver, R. A. Kerner, N. Yao, A. Kahn, G. D. Scholes and B. P. Rand, Nano Lett., 2017, 17, 6863–6869 CrossRef CAS PubMed.
- M. Karlsson, Z. Yi, S. Reichert, X. Luo, W. Lin, Z. Zhang, C. Bao, R. Zhang, S. Bai, G. Zheng, P. Teng, L. Duan, Y. Lu, K. Zheng, T. Pullerits, C. Deibel, W. Xu, R. Friend and F. Gao, Nat. Commun., 2021, 12, 361 CrossRef CAS PubMed.
- G. Almeida, L. Goldoni, Q. Akkerman, Z. Dang, A. H. Khan, S. Marras, I. Moreels and L. Manna, ACS Nano, 2018, 12, 1704–1711 CrossRef CAS PubMed.
- S. Wang, C. Bi, J. Yuan, L. Zhang and J. Tian, ACS Energy Lett., 2017, 3, 245–251 CrossRef.
- C. Katan, N. Mercier and J. Even, Chem. Rev., 2019, 119, 3140–3192 CrossRef CAS PubMed.
- Y. Liu, Z. Li, J. Xu, Y. Dong, B. Chen, S. M. Park, D. Ma, S. Lee, J. E. Huang, S. Teale, O. Voznyy and E. H. Sargent, J. Am. Chem. Soc., 2022, 144, 4009–4016 CrossRef CAS PubMed.
- A. Patra, S. Bera, D. Nasipuri, S. K. Dutta and N. Pradhan, ACS Energy Lett., 2021, 6, 2682–2689 CrossRef CAS.
- Y. Zeng, W. Chen, Y. Deng, W. Gu, C. Wu, Y. Guo, P. Huang, F. Liu and H. Li, ACS Appl. Nano Mater., 2022, 5, 9534–9543 CrossRef CAS.
- W. Shen, Y. Yu, W. Zhang, Y. Chen, J. Zhang, L. Yang, J. Feng, G. Cheng, L. Liu and S. Chen, ACS Appl. Mater. Interfaces, 2022, 14, 5682–5691 CrossRef CAS PubMed.
- H. Zhang, M. K. Nazeeruddin and W. C. H. Choy, Adv. Mater., 2019, 31, e1805702 CrossRef PubMed.
- M. Jiang, Z. Hu, Z. Liu, Z. Wu, L. K. Ono and Y. Qi, ACS Energy Lett., 2019, 4, 2731–2738 CrossRef CAS.
- W. Shen, Z. Su, S. Chen, Y. Dai, Y. Qiu, Y. Chen, J. Jiang, J. Zhang, Y. Wang, H. Cui, Y. He, K. Cao, B. Cai, L. Liu and S. Chen, Adv. Opt. Mater., 2023, 2300306 CrossRef CAS.
- W. Shen, Y. Dai, B. Cai, S. Chen, H. Yang, Y. Ma, Y. Chen, Z. Su, J. Zhang, Y. Qiu, Y. Wang, J. Jiang, L. Liu, K. Cao and S. Chen, ACS Energy Lett., 2023, 8, 2561–2569 CrossRef CAS.
- Z. Wei, K. Wang, W. Zhao, Y. Gao, Q. Hu, K. Chen and L. Dou, Chem. Commun., 2021, 57, 11469–11472 RSC.
- Y. Wang, A. Li, Y. Hu, Y. Bao, Y. Zhang, X. Hu and N. Zhuang, Chem. Commun., 2021, 57, 1356–1359 RSC.
- J. Zhu, L. Zhou, Y. Zhu, J. Huang, L. Hou, J. Shen, S. Dai and C. Li, Small, 2022, 18, e2104399 CrossRef PubMed.
- Y. Meng, Z. Lai, F. Li, W. Wang, S. Yip, Q. Quan, X. Bu, F. Wang, Y. Bao, T. Hosomi, T. Takahashi, K. Nagashima, T. Yanagida, J. Lu and J. C. Ho, ACS Nano, 2020, 14, 12749–12760 CrossRef CAS PubMed.
- T. K. O. Vu, I. W. Cho, J. Oh, D. U. Lee, M. Y. Ryu and E. K. Kim, J. Colloid Interface Sci., 2021, 590, 19–27 CrossRef CAS PubMed.
- Y. Liu, Y. Dong, T. Zhu, D. Ma, A. Proppe, B. Chen, C. Zheng, Y. Hou, S. Lee, B. Sun, E. H. Jung, F. Yuan, Y. K. Wang, L. K. Sagar, S. Hoogland, F. P. Garcia de Arquer, M. J. Choi, K. Singh, S. O. Kelley, O. Voznyy, Z. H. Lu and E. H. Sargent, J. Am. Chem. Soc., 2021, 143, 15606–15615 CrossRef CAS PubMed.
- Y. Shi, L. Yuan, Z. Liu, Y. Lu, B. Yuan, W. Shen, B. Xue, Y. Zhang, Y. Qian, F. Li, X. Zhang, Y. Liu, Y. Wang, L. Wang, J. Yuan, L. S. Liao, B. Yang, Y. Yu and W. Ma, ACS Nano, 2022, 16, 10534–10544 CrossRef CAS PubMed.
- X. Ling, J. Yuan, X. Zhang, Y. Qian, S. M. Zakeeruddin, B. W. Larson, Q. Zhao, J. Shi, J. Yang, K. Ji, Y. Zhang, Y. Wang, C. Zhang, S. Duhm, J. M. Luther, M. Gratzel and W. Ma, Adv. Mater., 2020, 32, e2001906 CrossRef PubMed.
- L. Kong, X. Zhang, C. Zhang, L. Wang, S. Wang, F. Cao, D. Zhao, A. L. Rogach and X. Yang, Adv. Mater., 2022, 34, 2205217 CrossRef CAS PubMed.
- C. Zhang, S. Wang, X. Li, M. Yuan, L. Turyanska and X. Yang, Adv. Funct. Mater., 2020, 30, 1910582 CrossRef CAS.
- H. Wang, X. Gong, D. Zhao, Y.-B. Zhao, S. Wang, J. Zhang, L. Kong, B. Wei, R. Quintero-Bermudez, O. Voznyy, Y. Shang, Z. Ning, Y. Yan, E. H. Sargent and X. Yang, Joule, 2020, 4, 1977–1987 CrossRef CAS.
- Q. Xiong, S. Huang, J. Du, X. Tang, F. Zeng, Z. Liu, Z. Zhang, T. Shi, J. Yang, D. Wu, H. Lin, Z. Luo and Y. Leng, Adv. Opt. Mater., 2020, 8, 2000977 CrossRef CAS.
Footnotes |
| † Electronic supplementary information (ESI) available. See DOI: https://doi.org/10.1039/d3cc03415a |
| ‡ W. S. and Y. Q. contributed equally to this work. |
| This journal is © The Royal Society of Chemistry 2023 |


