High-χ, low-N micelles from partially perfluorinated block polymers†
Eric R.
Williams
 ,
Wessel
van den Bergh
 and
Morgan
Stefik
 *
*
Department of Chemistry and Biochemistry, University of South Carolina, Columbia, SC 29208, USA. E-mail: morgan@stefikgroup.com
First published on 16th August 2022
Abstract
Kinetically trapped (“persistent”) micelles enable emerging applications requiring a constant core diameter. Preserving a χN barrier to chain exchange with low-N requires a commensurately higher χcore–solvent for micelle persistence. Low-N, high-χ micelles containing fluorophobic interactions were studied using poly(ethylene oxide-b-perfluorooctyl acrylate)s (O45FX, x = 8, 11) in methanolic solutions. DLS analysis of micelles revealed chain exchange only for O45F8 while SAXS analysis suggested elongated core block conformations commensurate with the contour lengths. Micelle chain exchange from solution perturbations were examined by characterizing their behavior as templates for inorganic materials via SAXS and SEM. In contrast to the F8 analog, the larger χN barrier for the O45F11 enabled persistent micelle behavior in both thin films and bulk samples despite the low Tg micelle core. Careful measures of micelle core diameters and pore sizes revealed that the nanoparticle distribution extended through the corona and 0.52 ± 0.15 nm into the core–corona interface, highlighting thermodynamics favoring both locations simultaneously.
Introduction
The self-assembly of block polymers is the basis for countless modern applications and areas of active research.1–4 The phase separation of polymer blocks is driven by χN, the product of the Flory–Huggins interaction parameter with the degree of polymerization.5 One amongst many unique feature of high-χ polymers is their ability to maintain phase separation with exceedingly low molecular masses (low N).6 This capability has been of broad interest recently for the field of block polymer lithography in the pursuit of ever smaller feature sizes.7–11 While self-consistent mean-field theory is only strictly rigorous in the limit of N → ∞, it has proven surprisingly useful down to N ∼ 10–20 where the corresponding chains could reasonably be considered oligomers.6 Micelles are a distinct context for block polymers where their kinetics in the low-N, high-χ regime remains underexplored.During equilibration, micelles are known to change both size and morphology in response to changing solution conditions.12–17 To date, several mechanisms such as single-chain exchange (SCE)18–20 and micelle fusion/fission21,22 have been identified as supporting equilibration. Interestingly, the predominant mechanism appears to be governed by how far removed the system is from its equilibrium state23–26 with single-chain mechanisms considered to dominate both small-molecule surfactants and block polymer micelles that are near equilibrium.18–20,27,28 Analogous to bulk polymer melts, the product χN also plays a pivotal role in SCE kinetics where the relevant χ is between the core-forming block and the solvent (χcore–solvent) and the relevant N corresponds to the length of the core block. This χN product is thus part of the activation energy for single-chain exchange when the core block is extracted into the solvent phase.18 Modern models for SCE include a “stiff” double-exponential dependence upon χN, where e.g., a 62% increase in N leads to four orders of magnitude decrease in the rate of SCE.18,29 This functional form thus makes the rate of SCE hypersensitive to both N and χ.18
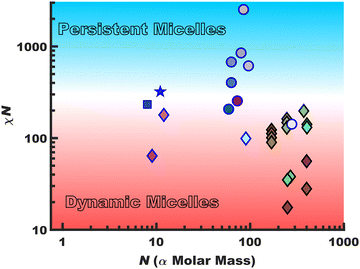
Persistent micelles can be kinetically trapped by a staunch χN barrier. This barrier effectively arrests appreciable amounts of chain exchange, leading to micelles that maintain a constant core diameter and morphology in solution. Such persistent micelles are of broad utility for a variety of fields from drug delivery30–33 to templated materials34–41 where maintenance of a constant micelle core diameter offers distinct advantages. Scheme 1 surveys the landscape of persistent vs. dynamic micelle behaviors with respect to N where there is a notable lack of persistent micelles in the low-N regime. Points featuring a black border had a χcore–solvent determined from SANS data whereas those with a blue border were crudely estimated using solubility parameters. The gradual transition from dynamic behavior (red) to persistent (blue) as a function of χN is represented with a gradient background color. This is analogous to glass transition behavior where the binary labels of persistent (circles) vs. dynamic (diamonds) micelles span a continuum of kinetics. The presented data are tabulated with references in the ESI,† Table S1. The works are broadly separated as those which note kinetic entrapment36–38,42 (circles) versus those that note dynamic exchange18,19,29,43–48 (diamonds). Persistent micelles are generally found for χN > ∼300 for nearly all works shown here with some disagreement for lower values that particularly depends upon the quantification method. It is noted that prior persistent micelle reports tailored the core block molar mass (∝N),34 solvent conditions,36 core crystallinity49 or immobilized glassy cores.40,41,50,51 In principle, χN ∼ 300 barrier could be maintained in the limit N → 1 (using the monomer volume as the lattice site volume) by a commensurate increase in χcore–solvent and it thus remains an open question as to a low-N limit for micelle persistence. It should be noted that most polymers are not ideal candidates for low-N kinetic micelle entrapment. For example, a number of commodity block polymers often feature low to moderate-χ core-forming blocks such as poly(propylene oxide)52 and poly(methyl methacrylate) when compared to alcoholic/aqueous solvents.53 Thus, the molar mass needed for persistence would be well outside what could reasonably be considered the low-N regime.
This challenge of micelle persistence in the low-N regime is herein examined with a perfluorinated motif in the core-forming block. Perfluorinated alkanes stand out as a unique class of molecules where fluorophobic interactions render them remarkably immiscible with dissimilar polymers and solvents alike in a phenomenon known as the fluorophobic effect.54–56 It thus follows that block polymers including a perfluorinated motif often possess especially high-χ values, including χA–B and χcore–solvent.57 Interestingly, this fluorophobic effect is in part a result of the greater relative volume occupied by these molecules in solution through the adoption of a helical configuration caused by the larger size of the fluorine when compared to hydrogen.58,59 As such, the work required to displace favorable intermolecular interactions between polar solvent molecules in accommodating the larger fluorocarbons (e.g., hydrogen bonding, electrostatic interactions, etc.) is not offset by fluorocarbon interactions with the solvent as the former is already highly polarized.59,60
Herein, we examine the low-N limits for micelle persistence with a series of poly(ethylene oxide-b-perfluorooctyl acrylate)s (PEO-b-PFOA, O45FX). Micelle solution behavior is first examined with DLS and SAXS before interrogating micelle persistence via their use as templates. Please note that PFOA is not expected to crystallize since fluorinated acrylates are amorphous.61 It will be shown that the large χcore–solvent afforded by the perfluorinated core-forming segment enabled persistent micelles with as few as 11 mer units whereas prior demonstrations often required values more than 50 or even 100 to realize similar persistent micelle behavior.34,36 The remarkable persistence of low-N perfluorinated micelle templates are shown through an expansive 45 sample series with multiple processing techniques. Simulations and experiments have examined the placement of nanoparticles within block polymers on several occasions where the general predictions and observations either (1) place the nanoparticles at the interface of block polymers to increase translational entropy,62–67 (2) mix the nanoparticles within a block due to selective and attractive interactions,68–72 or (3) phase separate the nanoparticles.73,74 Here a combination of SAXS and SEM data showed that the average micelle core size was larger than the average templated pore size, suggesting that the inorganic nanoparticles were dispersed throughout the corona and into the core–corona interface. This observation highlights that predictions 1 and 2 are not mutually exclusive.
Experimental
Materials
Titanium tetraisopropoxide (TTiP, 99% Acros), N,N′-dicyclohexylcarbodiimide (DCC, 99% Beantown Chemical), Cu(I) Br (99.99%, Aldrich), and the ligand tris[2-(dimethylamino)ethyl]amine (Me6TREN) were all stored in an argon glovebox prior to use. Methanol (MeOH, 99.8%, Fisher), chloroform (>99.5%, Fisher), and toluene (>99.5%, Fisher) were dried at room temperature over 50% w/w of molecular sieves (3 Å, 8–12 mesh, Acros Organics) for a week prior to use.75 Hexanes (99%, Fisher) were used as received. The monomer 1H,1H,2H,2H-perfluorooctyl acrylate (FOA, 97%, Sigma) was stored in the refrigerator and passed over a basic alumina column to remove inhibitor just prior to use. Concentrated 12 M HCl (37%, ACS Grade, VWR), poly(ethylene glycol)monomethyl ether (PEO-OH, Mn = 2000 g mol−1, Alfa Aesar), 2-bromopropionic acid (98%, Beantown Chemical), 4-(dimethylaminopyridine) (DMAP, 99%, Aldrich) were all used as received.Synthesis of PEO-b-PFOA diblocks O45F11 and O45F8
High-χ diblock polymers were synthesized using an ATRP macroinitiator followed by the controlled chain extension using FOA. The macroinitiator was prepared with the following ratios of PEO-OH![[thin space (1/6-em)]](https://www.rsc.org/images/entities/char_2009.gif) :
:![[thin space (1/6-em)]](https://www.rsc.org/images/entities/char_2009.gif) 2-bromopropionic acid
2-bromopropionic acid![[thin space (1/6-em)]](https://www.rsc.org/images/entities/char_2009.gif) :
:![[thin space (1/6-em)]](https://www.rsc.org/images/entities/char_2009.gif) DMAP
DMAP![[thin space (1/6-em)]](https://www.rsc.org/images/entities/char_2009.gif) :
:![[thin space (1/6-em)]](https://www.rsc.org/images/entities/char_2009.gif) DCC of 1.0
DCC of 1.0![[thin space (1/6-em)]](https://www.rsc.org/images/entities/char_2009.gif) :
:![[thin space (1/6-em)]](https://www.rsc.org/images/entities/char_2009.gif) 2.0
2.0![[thin space (1/6-em)]](https://www.rsc.org/images/entities/char_2009.gif) :
:![[thin space (1/6-em)]](https://www.rsc.org/images/entities/char_2009.gif) 0.8
0.8![[thin space (1/6-em)]](https://www.rsc.org/images/entities/char_2009.gif) :
:![[thin space (1/6-em)]](https://www.rsc.org/images/entities/char_2009.gif) 2.0.35 A general synthesis involved the dissolution of 20 g of PEO-OH in 100 mL of anhydrous MeOH-free chloroform. To this solution was added 3.59 mL of 2-bromopropionic acid in a dropwise fashion. The solution was then placed in an ice water bath for 10 minutes. Next, 4.12 g of DCC and 0.97 g of DMAP were added. The reaction was allowed to stir unperturbed for 18 hours. After completion, the contents were gravity filtered through a Whatman V2 filter paper (diameter 270 mm) to remove the urea by-product. The product was collected and concentrated to a highly viscous liquid by rotary evaporation. The crude macroinitiator was then precipitated in 500 mL of ice-cold hexanes by dropwise addition and recovered. Residual urea by-product was removed by dissolution in 50 mL of chloroform followed by gentle shaking with an equivalent volume of deionized water. This process was repeated for a total of three times. The purified macroinitiator (PEO-Br) was dried under vacuum without heat prior to characterization. The O45F11 block polymer was synthesized with the following molar ratios of PEO-Br
2.0.35 A general synthesis involved the dissolution of 20 g of PEO-OH in 100 mL of anhydrous MeOH-free chloroform. To this solution was added 3.59 mL of 2-bromopropionic acid in a dropwise fashion. The solution was then placed in an ice water bath for 10 minutes. Next, 4.12 g of DCC and 0.97 g of DMAP were added. The reaction was allowed to stir unperturbed for 18 hours. After completion, the contents were gravity filtered through a Whatman V2 filter paper (diameter 270 mm) to remove the urea by-product. The product was collected and concentrated to a highly viscous liquid by rotary evaporation. The crude macroinitiator was then precipitated in 500 mL of ice-cold hexanes by dropwise addition and recovered. Residual urea by-product was removed by dissolution in 50 mL of chloroform followed by gentle shaking with an equivalent volume of deionized water. This process was repeated for a total of three times. The purified macroinitiator (PEO-Br) was dried under vacuum without heat prior to characterization. The O45F11 block polymer was synthesized with the following molar ratios of PEO-Br![[thin space (1/6-em)]](https://www.rsc.org/images/entities/char_2009.gif) :
:![[thin space (1/6-em)]](https://www.rsc.org/images/entities/char_2009.gif) Me6TREN
Me6TREN![[thin space (1/6-em)]](https://www.rsc.org/images/entities/char_2009.gif) :
:![[thin space (1/6-em)]](https://www.rsc.org/images/entities/char_2009.gif) Cu(I) Br
Cu(I) Br![[thin space (1/6-em)]](https://www.rsc.org/images/entities/char_2009.gif) :
:![[thin space (1/6-em)]](https://www.rsc.org/images/entities/char_2009.gif) FOA of 1.0
FOA of 1.0![[thin space (1/6-em)]](https://www.rsc.org/images/entities/char_2009.gif) :
:![[thin space (1/6-em)]](https://www.rsc.org/images/entities/char_2009.gif) 0.5
0.5![[thin space (1/6-em)]](https://www.rsc.org/images/entities/char_2009.gif) :
:![[thin space (1/6-em)]](https://www.rsc.org/images/entities/char_2009.gif) 0.5
0.5![[thin space (1/6-em)]](https://www.rsc.org/images/entities/char_2009.gif) :
:![[thin space (1/6-em)]](https://www.rsc.org/images/entities/char_2009.gif) 12. A standard synthesis involved the combination of 2.00 g of PEO-Br with 3.2 mL of inhibitor-free FOA monomer and 9 mL of toluene in a 25 mL Schlenk flask. This mixture was then degassed by 3 freeze–pump–thaw cycles of 20 min each before being moved into an argon glovebox to be opened under an inert atmosphere. While in the glovebox, 71.7 mg of Cu(I) Br and 133.6 μL of Me6TREN were added. The reaction was then removed from the glovebox and placed in a pre-heated oil bath at 90 °C and allowed to polymerize for 42 h. Afterwards, the flask was placed in the freezer for 2 h and then vented to terminate the polymerization. The crude product was then solubilized with THF and passed over a column of basic alumina to remove copper salts. The product was dialyzed against a 50
12. A standard synthesis involved the combination of 2.00 g of PEO-Br with 3.2 mL of inhibitor-free FOA monomer and 9 mL of toluene in a 25 mL Schlenk flask. This mixture was then degassed by 3 freeze–pump–thaw cycles of 20 min each before being moved into an argon glovebox to be opened under an inert atmosphere. While in the glovebox, 71.7 mg of Cu(I) Br and 133.6 μL of Me6TREN were added. The reaction was then removed from the glovebox and placed in a pre-heated oil bath at 90 °C and allowed to polymerize for 42 h. Afterwards, the flask was placed in the freezer for 2 h and then vented to terminate the polymerization. The crude product was then solubilized with THF and passed over a column of basic alumina to remove copper salts. The product was dialyzed against a 50![[thin space (1/6-em)]](https://www.rsc.org/images/entities/char_2009.gif) :
:![[thin space (1/6-em)]](https://www.rsc.org/images/entities/char_2009.gif) 50 mixture of THF and MeOH to remove unreacted initiator. Unreacted FOA monomer was subsequently removed by dissolving the crude diblock in THF and a dropwise precipitation in 500 mL of room temperature hexanes. The purified product was then collected and dried under vacuum for 24 h without heat.
50 mixture of THF and MeOH to remove unreacted initiator. Unreacted FOA monomer was subsequently removed by dissolving the crude diblock in THF and a dropwise precipitation in 500 mL of room temperature hexanes. The purified product was then collected and dried under vacuum for 24 h without heat.
Polymer characterization
The molar mass of PFOA and dispersity (Đ) of all polymers were determined using nuclear magnetic resonance (NMR) spectroscopy and gel permeation chromatography (GPC), respectively. All proton NMR (1H-NMR) spectra were collected using a Bruker Avance III HD 300. The molar mass (Mn) of PFOA diblocks was determined by integration ratios between the FOA ester –COOCH2– signal (δ = 4.35 ppm) and the known (2k)PEO ether –OCH2CH2– signal (δ = 3.66 ppm). All GPC data were collected using a Waters gel permeation chromatography GPC instrument equipped with a 515 HPLC pump, a 2410 refractive index detector and three styragel columns (HR1, HR3, and HR4) in the effective molecular mass range of 0.1–5, 0.5–30, 5–600 kg mol−1, respectively. The eluent used was THF at a temperature of 30 °C and a flow rate of 1 mL min−1. The instrument was calibrated with polystyrene standards (2570, 1090, 579, 246, 130, 67.5, 34.8, 18.1, 10.4, 3.4 and 1.6 kg mol−1) received from Polymer Laboratories. The GPC samples were prepared by dissolution in THF with a concentration of ∼10 mg mL−1 and were filtered through a syringe filter with a pore diameter of 0.2 μm just prior to injection.Preparation of micelle solutions
Micelle solutions were prepared by dissolving the O45Fx polymer in anhydrous MeOH. The polymers directly dispersed with only minor agitation. The micelle solutions for templating were prepared by dissolving 50 mg of dried PEO-b-PFOA polymer in 5.0 g (6.3 mL) of anhydrous MeOH. Next, 70.8 μL of HCl (aq) was added in preparation for nanoparticle addition. The resulting micelle solution was sonicated for 5 min at room temperature with the intent to enable chain exchange under kinetically limited conditions.76DLS measurements
Dynamic light scattering (DLS) measurements were performed on the O45F11 and O45F8 polymers under different solution conditions. The DLS measurements of the hydrodynamic diameter were performed using a Zetasizer Nanoseries ZEN3690 instrument. Solutions for DLS were prepared at a polymer concentration of ∼10 mg mL−1 and were filtered through a 0.2 μm syringe filter prior to measuring. All measurements were performed six times to confirm reproducibility. All DLS measurements were conducted at 25 °C. Viscosities of 0.659 cP and 0.782 cP along with refractive indices of 1.334 and 1.336 were used for the 98% MeOH, 2% H2O and 90% MeOH, 10% H2O solutions, respectively.77,78SAXS of micelles
Micelle solutions for SAXS were prepared in an identical fashion as those used for spin coating. In brief, the polymer of choice was dispersed in anhydrous MeOH followed by 1.4 vol% HCl addition such that the final polymer concentration was 10 mg mL−1. Samples were passed through a 200 μm syringe filter prior to loading in a 0.8 mm diameter glass capillary (Charles supper). Capillaries were first flame-sealed followed by an additional sealing with hot candle wax. A blank sample consisting of a capillary with only MeOH (aq) was measured under the same conditions. All samples were acquired for 150 minutes at room temperature. SAXS data were background subtracted with SAXSGUI software using the same solvent mixtures in Charles supper 0.8 mm diameter capillaries. These capillaries yielded reproducible background signal that signal was several orders of magnitude weaker than the sample signal (Fig. S6, ESI†).Ex situ TtiP hydrolysis and micelle templating
Standard PMT modus operandi calls for titrating in increasing amounts of material precursors to effect increases in wall thicknesses. An ex situ TiO2 nanoparticle solution was prepared by quickly adding 3.00 mL of TtiP to a 20 mL scintillation vial containing 1.2 mL of conc. HCl (aq) and 2.0 mL of anhydrous MeOH stirring rapidly at 600 rpm with a magnetic stir bar.37 Please note that this process is highly exothermic and should be performed cautiously. The resulting material stock solution was allowed to stir for a few minutes after hydrolysis to cool back to room temperature. A predetermined amount of sol stock was added to a 0.5 mL aliquot of the micelle stock to realize the desired material-to-template (M![[thin space (1/6-em)]](https://www.rsc.org/images/entities/char_2009.gif) :
:![[thin space (1/6-em)]](https://www.rsc.org/images/entities/char_2009.gif) T) mass ratio. After combining the two, the mixture was agitated slightly by hand before spin coating. This process was repeated for all samples across the entire M
T) mass ratio. After combining the two, the mixture was agitated slightly by hand before spin coating. This process was repeated for all samples across the entire M![[thin space (1/6-em)]](https://www.rsc.org/images/entities/char_2009.gif) :
:![[thin space (1/6-em)]](https://www.rsc.org/images/entities/char_2009.gif) T range. A 10 μL aliquot of this solution was then spin coated for 30 s at 1500 rpm with a 15% relative humidity, after which time it was immediately transferred to a pre-heated hotplate at 250 °C where it was left to age for 2 h. Samples spun on silicon substrates were prepared in an identical fashion and were subjected to an additional aging treatment at 150 °C for 18 h. Samples were calcined in a furnace at 360 °C for 24 h with a 5 °C min−1 ramp rate.
T range. A 10 μL aliquot of this solution was then spin coated for 30 s at 1500 rpm with a 15% relative humidity, after which time it was immediately transferred to a pre-heated hotplate at 250 °C where it was left to age for 2 h. Samples spun on silicon substrates were prepared in an identical fashion and were subjected to an additional aging treatment at 150 °C for 18 h. Samples were calcined in a furnace at 360 °C for 24 h with a 5 °C min−1 ramp rate.
Bulk evaporative casting
A 5.0 g solution of micelles as described above was used. Next, a predetermined amount of TiO2 material stock solution (as prepared previously) was combined with the micelle stock and was cast in a Teflon dish with a diameter of 4 cm. The material and micelles were allowed to undergo evaporation-induced self-assembly overnight without added heat. Once dry, the samples were aged at 80 °C for 24 h prior to removal of the micelle template. Samples were then calcined at 300 °C for 0.5 h with a ramp rate of 5 °C min−1.X-Ray measurements
X-ray measurements were performed at the South Carolina SAXS Collaborative (SCSC) using a SAXSLab Ganesha instrument. A Xenocs GeniX 3D microfocus source was used with a copper target to produce a monochromatic beam with a wavelength of 0.154 nm. The instrument was calibrated prior to use with a National Institute of Standards and Technology (NIST) reference material 640d silicon powder with a peak position of 28.44° 2θ, where 2θ refers to the total scattering angle. A Pilatus 300k detector (Dectris) was used to collect a two-dimensional (2D) scattering pattern with the nominal pixel dimensions of 172 × 172 mm2. The SAXS data were acquired with an X-ray flux of ∼4.1 M photons per second incident upon the sample and a sample-to-detector distance of 1040 mm. A transmission SAXS geometry was used to measure the purely in-plane features of the thin film samples. A high-tilt measurement with a 45° incident angle was used to simultaneously measure the in-plane and out-of-plane contributions. The 2D images were azimuthally integrated to yield the scattering vector and intensity. The tilted data were integrated over limited azimuthal angle ranges along orthogonal directions. Peak positions were fitted using custom MATLAB software. The SAXS measurements were reported as the average ± the standard-error-of-the-mean. Micelle SAXS measurements were fitted using a model for hard spheres with Gaussian Chains and a Dozier scattering background to account for high-q “blob” scattering.Scanning electron microscopy (SEM)
Top-view images of calcined films on silicon were acquired with a Zeiss Ultraplus thermal field emission SEM using an accelerating voltage of 5 keV and an in-lens secondary electron detector. The working distance was maintained at ∼4 mm as well as well as constant magnifications across the series. Hundreds of SEM measurements were made on each sample to yield statistically significant metrics of pore diameter and wall-thickness. Data are presented as average values with the standard error-of-the-mean. SEM metrics were validated using a NIST gold nanoparticle standard of nominal diameter 10 nm (Reference Material 8011) deposited on Si wafers of ∼3 × 3 cm2. Samples were prepared by placing a drop of 3-aminopropyltriethoxysilane on a substrate treated with oxygen plasma. This was allowed to react for ∼2 h, after which the excess silane was rinsed off with isopropanol followed by deionized water. A drop of the nanoparticle solution was then deposited on the derivatized substrate and allowed to dry for ∼1 h, after which it was briefly washed with isopropanol and gently blown dry.Results and discussion
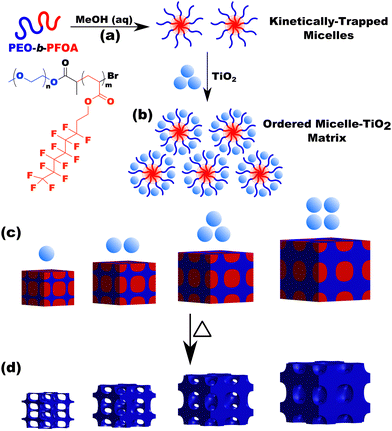
The kinetic control of micelles depends upon the thermodynamic barriers to chain exchange processes. It is well established that the rate of SCE decreases strongly with increasing χN.18–20,47,79–81 However, the kinetic control of block polymer micelles in this low-N, high-χ regime remains underexplored despite the suitable candidates for high-χ polymers.10,48,57 Herein persistent micelle behavior under high-χ, low-N micelle conditions are examined in solution as well as after their use as templates for inorganic nanoparticles. In the latter case, the pore size serves as a proxy for the nominal micelle core size. Two high-χ, low-N PEO-b-PFOAs were prepared using Atom-Transfer Radical Polymerization, resulting in block polymers O45F11 and O45F8 (Table S2, ESI†). It is noted that the low degree of polymerization of the FOA block leads to a comb-like architecture with ∼16–22 bonds along the backbone and 11 bonds along the side group. The aspect ratio of these polymers may play a role in their dynamics. The corresponding molecular attributes were characterized by GPC and NMR (Fig. S1, S2 and Table S3, ESI†). Both polymers readily dispersed in MeOH and formed micelles. All micelle characterizations were performed in a specific composition of aqueous methanol for compatibility with micelle template experiments which need HCl for nanoparticle stability and a quickly evaporating solvent (MeOH) (Fig. 1 and Table S4, ESI†). Micelles from each polymer were first evaluated using a combination of DLS and SAXS. Subsequent analysis after their use as templates for inorganic nanoparticles can reveal micelle size changes as a result of dynamic chain exchange resulting from the perturbations to the solution composition (Scheme 2). Here the use of poly(ethylene oxide) corona blocks enables well-known selective interactions with typical hydrophilic oxide nanoparticles such that the nanoparticles are predominantly located throughout the corona region.82–85 Finally, the templated pore dimensions are compared with respect to the parent micelle core size to infer the nanoparticle spatial distribution in proximity of the core–corona interface.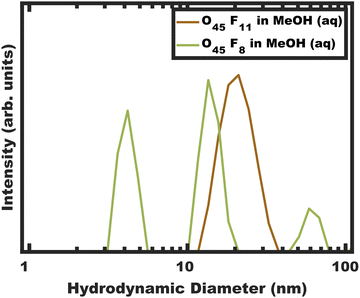 | ||
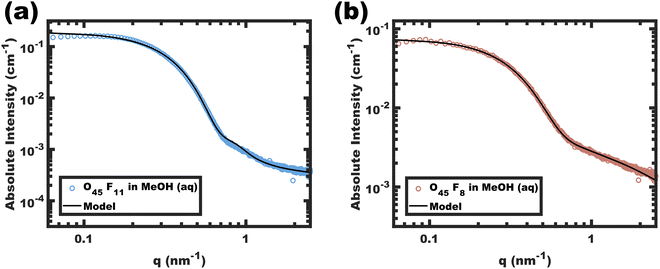
| Fig. 1 DLS intensity data for micelle solutions O45F11 and O45F8 in MeOH (aq) with 1.4 vol% HCl. The data were obtained at a concentration of 10 mg mL−1. | ||
DLS of O45F11 and O45F8 micelles
A signature of persistent micelles is the preservation of a constant aggregation number (Nagg) by inhibiting chain exchange. SCE operates with a stable population of free chains (unimers) in solution to support continuous equilibration. DLS measurements provide a facile and direct method for detecting the presence of such unimers, whose hydrodynamic diameter (<10 nm) is often distinguishable from their micelle counterparts. It should however be noted that the absence of detectable unimers in solution does not guarantee kinetic entrapment as the population of unimers may simply be below the limit of detection for the instrument.36 Furthermore, light scattering carries a natural bias towards larger objects (intensity ∝ size6) which can obscure the observation of trace unimers. Therefore, analysis of micelle solution DLS data allows for a binary assessment of micelle dynamics in solution as (1) certainly dynamic or (2) either persistent or dynamic (ambiguous).DLS measurements were performed on the polymers O45F11 and O45F8 in MeOH (aq) (see Experimental). Please note that the addition rate of HCl (aq) was not found to have a significant impact on the resulting micelle hydrodynamic diameters measured by DLS (Fig. S3 and Table S4, ESI†). DLS of the O45F11 polymer solution revealed a relatively uniform population of micelles with ∼24 nm hydrodynamic diameter without detectable unimers below 10 nm (Fig. 1a and Table S5, ESI†). The addition of HCl (aq) increased the micelle hydrodynamic diameters which is consistent with expanded corona conformations36 or dynamic micelles with increasing the χcore–solvent (Fig. S3, ESI†). This suggests that MeOH (aq) is not only a selective solvent for PEO but also a good candidate for kinetic entrapment. Please note the apparent absence of unimers here does not prove kinetic entrapment but suggests that the O45F11 may have formed persistent micelles. In contrast, O45F8 was similarly dispersed in MeOH and properly acidified with DLS analysis again revealing a mixture of unimers or low number aggregates in addition to micelles and larger micelle-aggregates. To increase χ, up to 10.0 vol% water was added to the methanolic O45F8 solution where DLS again detected unimers consistent with dynamic micelles. Example data showing the variability of these DLS measurements are presented in Fig. S4 (ESI†). It is curious that the 3 fewer FOA repeat units on O45F8 resulted in markedly different solution behavior. Thus, a difference in aggregation behavior was identified by DLS where only O45F8 had detectable chain exchange in MeOH whereas O45F11 did not.
The concentration dependent micelle characteristics of the O45F11 polymer were also examined with DLS. The polymer solution (fixed solvent composition) was examined from 5.0–0.25 mg mL−1 of O45F11 (Fig. S5, ESI†). Throughout this range ∼24 nm micelles were apparent with additional aggregates of micelles appearing at the lowest concentrations. Such aggregates of micelles have been noted before with PEO containing micelles where the hydrodynamic diameter increase with concentration was attributed to the aggregation of multiple micelles rather than a uniform increase in micelle diameter.51 The lack of apparent unimers (<10 nm), however, indicates a very low CMC value as expected for persistent micelles. Please note that the CMC for similar fluoropolymers were found to be around 1.4 mg L−1.86
SAXS of O45F11 and O45F8 micelles
Analysis of SAXS data was used to assess the diameter and conformation of the PFOA blocks. The SAXS scattering intensity arises from the contrast in scattering length density (ρ) where the difference between the perfluorinated PFOA core and MeOH (aq) is expected to dominate. The corresponding data for O45F11 and O45F8 micelles are shown in Fig. 2. The SAXS patterns resemble the form factor of polydisperse spherical scatterers. Please note that aggregates of micelles have been noted before for PEO containing micelles,51,87 where there is a distinct separation between the micelle form factor and aggregate structure factor when present.88 Absolute scattering data were fitted using a model for hard spheres with Gaussian chains and a Dozier scattering background to account for high-q “blob” scattering. The resulting fit parameters included average core diameters of 11.24 and 9.04 nm for the O45F11 and O45F8 micelles, respectively. The 11.24 nm core diameter somewhat exceeds the ∼8.6 nm estimated end-to-end contour length expected for two completely outstretched F11 blocks (Fig. S7, ESI†). An elongated conformation state here is perhaps expected considering the high χcore–solvent. Indeed, others have noted micelle dimensions commensurate with the core block contour length in systems with perfluorinated core-forming segments,89 with the degree of chain stretching increasing with decreasing core block N.90–93 After considering the estimated molar volume for the PFOA core, the aggregation numbers for the O45F11 and O45F8 micelles were estimated at 109 and 78, respectively. Fluorinated surfactants are also known to have an affinity for dissolving gasses such as O2 and CO2,94 which may increase the micelle core size. In evaluating this possibility, micelles of O45F11 were compared after several treatments: degassing by freeze–pump–thaw, degassing by sonication, saturating with O2, and saturating with CO2. Analysis of the corresponding SAXS data revealed that all micelle core diameters were similarly elongated and were in close agreement (∼7% difference) (Fig. S8 and Table S6, ESI†). In other words, extended core block conformations were found regardless of the presence of dissolved gasses. Naturally, the chain extension caused by high-χ conditions mitigates feature size shrinking with low-N polymers, somewhat obfuscating a typical objective of smaller feature sizes. A perhaps underappreciated advantage of chains elongated to the contour length is that this tradeoff has reached a terminus; in other words, lower-N species with yet higher-χ values offer a path to smaller feature sizes.O45F11 micelles: dynamic or persistent?
The micelle core dimensions were next examined after use as templates in diverse conditions to assess micelle persistence or lack thereof. A single sample is first presented in detail before describing subsequent series of experiments. Micelle templates were combined with titania nanoparticles (“material precursors”), followed by evaporation and thermal treatments to remove the polymer and leave behind pores in the former location of the micelle cores (Scheme 2).Sample O45F11-1.00 was prepared using sufficient material precursors to yield a material-to-template (M![[thin space (1/6-em)]](https://www.rsc.org/images/entities/char_2009.gif) :
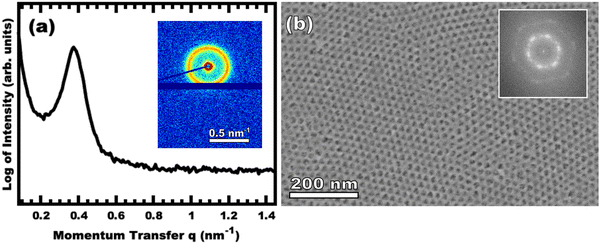
:![[thin space (1/6-em)]](https://www.rsc.org/images/entities/char_2009.gif) T) mass ratio of 1.00. Fig. 3 shows the corresponding SAXS and SEM data. The electron micrograph after polymer removal shows a continuous network of titania walls (light) amongst spherical pores (dark) (Fig. 3b). The evenly spaced and uniform arrangement of spheres is reflected in the inset fast Fourier transform containing two concentric textured rings. Statistical descriptors were derived from hundreds of measurements upon SEM images to yield an average pore diameter of 11.59 ± 0.79 nm and an average wall thickness of 4.58 ± 0.27 nm. The SAXS-derived average micelle core diameter of 11.08 ± 0.03 nm was in close agreement with the SEM average pore diameter of 11.59 ± 0.79 nm after the templating process. The corresponding SAXS pattern (Fig. 3a) features a single isotropic scattering peak with a d-spacing (2π/q*) of 16.43 nm. The isotropic 2D pattern (inset) reflects the random in-plane orientation over the macroscopic few mm2 of the SAXS beam. Furthermore, the lack of apparent higher-order SAXS reflections suggests predominantly short-range ordering which is consistent with the positional scatter apparent in the SEM image. Such uniform and short-range ordered features are typical for PMT samples.35–38,40,41 Please note that the SAXS d-spacing of 16.43 nm is similar to the sum of the SEM pore and wall dimensions. This correspondence of feature size and d-spacing is typical for randomly packed spheres.95–98 Furthermore, this correlation is quantitatively predictable using the PMT model35 which is based upon a simple conservation of volume argument (eqn (S1), ESI†). The model quantitatively predicts sample d-spacings when the micelles are persistent (constant core size) where increasing the amount of titania material precursors (increasing M
T) mass ratio of 1.00. Fig. 3 shows the corresponding SAXS and SEM data. The electron micrograph after polymer removal shows a continuous network of titania walls (light) amongst spherical pores (dark) (Fig. 3b). The evenly spaced and uniform arrangement of spheres is reflected in the inset fast Fourier transform containing two concentric textured rings. Statistical descriptors were derived from hundreds of measurements upon SEM images to yield an average pore diameter of 11.59 ± 0.79 nm and an average wall thickness of 4.58 ± 0.27 nm. The SAXS-derived average micelle core diameter of 11.08 ± 0.03 nm was in close agreement with the SEM average pore diameter of 11.59 ± 0.79 nm after the templating process. The corresponding SAXS pattern (Fig. 3a) features a single isotropic scattering peak with a d-spacing (2π/q*) of 16.43 nm. The isotropic 2D pattern (inset) reflects the random in-plane orientation over the macroscopic few mm2 of the SAXS beam. Furthermore, the lack of apparent higher-order SAXS reflections suggests predominantly short-range ordering which is consistent with the positional scatter apparent in the SEM image. Such uniform and short-range ordered features are typical for PMT samples.35–38,40,41 Please note that the SAXS d-spacing of 16.43 nm is similar to the sum of the SEM pore and wall dimensions. This correspondence of feature size and d-spacing is typical for randomly packed spheres.95–98 Furthermore, this correlation is quantitatively predictable using the PMT model35 which is based upon a simple conservation of volume argument (eqn (S1), ESI†). The model quantitatively predicts sample d-spacings when the micelles are persistent (constant core size) where increasing the amount of titania material precursors (increasing M![[thin space (1/6-em)]](https://www.rsc.org/images/entities/char_2009.gif) :
:![[thin space (1/6-em)]](https://www.rsc.org/images/entities/char_2009.gif) T ratio) leads to lattice expansion as the added inorganic is directed to the micelle coronae and pushes the micelles farther apart. In the next section, this geometric architecture–micelle relationship will be used to track changes to the micelle core diameter and volume.
T ratio) leads to lattice expansion as the added inorganic is directed to the micelle coronae and pushes the micelles farther apart. In the next section, this geometric architecture–micelle relationship will be used to track changes to the micelle core diameter and volume.
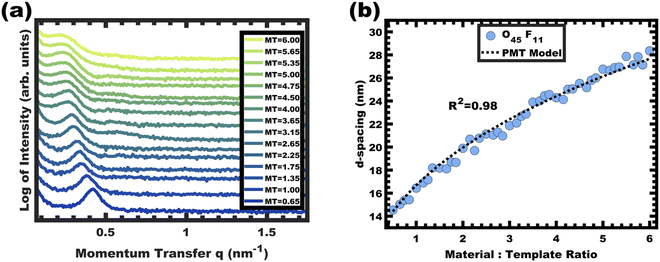
The O45F11 micelle persistence in MeOH (aq) was evaluated by varying the M![[thin space (1/6-em)]](https://www.rsc.org/images/entities/char_2009.gif) :
:![[thin space (1/6-em)]](https://www.rsc.org/images/entities/char_2009.gif) T ratio from 0.50–6.00. Increasing the M
T ratio from 0.50–6.00. Increasing the M![[thin space (1/6-em)]](https://www.rsc.org/images/entities/char_2009.gif) :
:![[thin space (1/6-em)]](https://www.rsc.org/images/entities/char_2009.gif) T ratio both increases the amount of charged nanoparticle interactions with the PEO coronas and increases the trace water content in solution, both of which could alter the equilibrium aggregation number. A correspondingly changed micelle core size would indicate dynamic micelles undergoing chain exchange towards the new equilibrium conditions whereas an invariant core size suggests kinetic control. Indeed, the general case for dynamic micelle templates is a simultaneous variance in both the pore and wall feature sizes as micelles attempt to reach a thermodynamic equilibrium i.e., a balance of interfacial enthalpy and chain stretching. The SAXS data for the O45F11 M
T ratio both increases the amount of charged nanoparticle interactions with the PEO coronas and increases the trace water content in solution, both of which could alter the equilibrium aggregation number. A correspondingly changed micelle core size would indicate dynamic micelles undergoing chain exchange towards the new equilibrium conditions whereas an invariant core size suggests kinetic control. Indeed, the general case for dynamic micelle templates is a simultaneous variance in both the pore and wall feature sizes as micelles attempt to reach a thermodynamic equilibrium i.e., a balance of interfacial enthalpy and chain stretching. The SAXS data for the O45F11 M![[thin space (1/6-em)]](https://www.rsc.org/images/entities/char_2009.gif) :
:![[thin space (1/6-em)]](https://www.rsc.org/images/entities/char_2009.gif) T series are shown in Fig. 4a. The increase of M
T series are shown in Fig. 4a. The increase of M![[thin space (1/6-em)]](https://www.rsc.org/images/entities/char_2009.gif) :
:![[thin space (1/6-em)]](https://www.rsc.org/images/entities/char_2009.gif) T ratio results in a monotonic leftward shift of SAXS curves towards lower q values (higher d-spacings), indicative of the lattice expansion behavior consistent with PMTs.
T ratio results in a monotonic leftward shift of SAXS curves towards lower q values (higher d-spacings), indicative of the lattice expansion behavior consistent with PMTs.
This expansion of d-spacing is quantitatively expected to follow a pseudo-cube root relationship of d-spacing to M![[thin space (1/6-em)]](https://www.rsc.org/images/entities/char_2009.gif) :
:![[thin space (1/6-em)]](https://www.rsc.org/images/entities/char_2009.gif) T ratio, reflecting the underlying conservation of volume and the natural relationship of a linear dimension to a volume ratio. Fitting of the PMT model parameters, however, requires knowledge of the pore size.35 A convenient log re-arrangement eliminates this need for pore size knowledge and a subsequent approximation yields an expected straight line with slope of ∼1/3 for log(d-spacing) vs. log(M
T ratio, reflecting the underlying conservation of volume and the natural relationship of a linear dimension to a volume ratio. Fitting of the PMT model parameters, however, requires knowledge of the pore size.35 A convenient log re-arrangement eliminates this need for pore size knowledge and a subsequent approximation yields an expected straight line with slope of ∼1/3 for log(d-spacing) vs. log(M![[thin space (1/6-em)]](https://www.rsc.org/images/entities/char_2009.gif) :
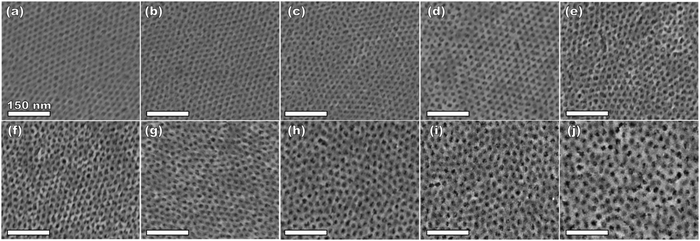
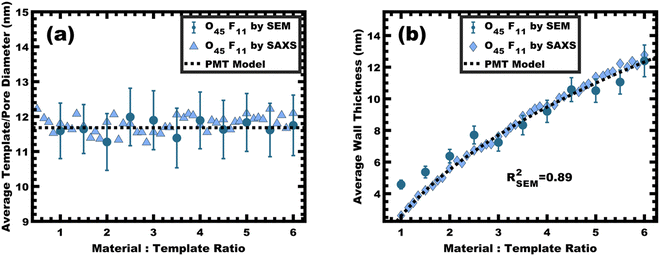
:![[thin space (1/6-em)]](https://www.rsc.org/images/entities/char_2009.gif) T).36 This log–log coordinate space thus expedites the identification of consistency with PMT conditions prior to pore size inputs from electron microscopy. In the case of O45F11, the linear best-fit slope of 0.30 was consistent with PMT behavior (Fig. S9a, ESI†). This suggests that micelle chain exchange was arrested on the timescale of the experiment despite the exceedingly small PFOA block. Following the log–log analysis, measurements of the pore size and SAXS lattice expansion were used to assess consistency with persistent micelles. Measurements upon numerous SEM images of this series yielded a relatively constant average pore diameter of 11.68 ± 0.81 nm that was consistent with kinetically trapped micelles. The SEM images also revealed that the average wall thickness expanded from 4.58 ± 0.27 to 12.40 ± 1.00 nm (∼170% increase) as the M
T).36 This log–log coordinate space thus expedites the identification of consistency with PMT conditions prior to pore size inputs from electron microscopy. In the case of O45F11, the linear best-fit slope of 0.30 was consistent with PMT behavior (Fig. S9a, ESI†). This suggests that micelle chain exchange was arrested on the timescale of the experiment despite the exceedingly small PFOA block. Following the log–log analysis, measurements of the pore size and SAXS lattice expansion were used to assess consistency with persistent micelles. Measurements upon numerous SEM images of this series yielded a relatively constant average pore diameter of 11.68 ± 0.81 nm that was consistent with kinetically trapped micelles. The SEM images also revealed that the average wall thickness expanded from 4.58 ± 0.27 to 12.40 ± 1.00 nm (∼170% increase) as the M![[thin space (1/6-em)]](https://www.rsc.org/images/entities/char_2009.gif) :
:![[thin space (1/6-em)]](https://www.rsc.org/images/entities/char_2009.gif) T ratio monotonically increased (Fig. 5 and 6b). The PMT model was fitted to the observed lattice expansion including SEM metrics where the resulting best-fit closely matched the experimental d-spacing trend with a goodness-of-fit R2 = 0.98 (Fig. 4b and Table S8, ESI†). Furthermore, the observed d-spacing can be deconvolved into the underlying template/pore diameter and wall thickness using these best-fit parameters which closely matched the direct and model-independent measurements from SEM (Fig. 6). Thus, O45F11 micelles in MeOH (aq) were most consistent with kinetic entrapment. This PMT series also demonstrated an unprecedented 2.7× change in average wall thickness across a 45-sample series which is 90% larger than any prior PMT demonstration,36 suggesting particularly persistent micelles are feasible in the high-χ, low-N regime (Scheme 1).
T ratio monotonically increased (Fig. 5 and 6b). The PMT model was fitted to the observed lattice expansion including SEM metrics where the resulting best-fit closely matched the experimental d-spacing trend with a goodness-of-fit R2 = 0.98 (Fig. 4b and Table S8, ESI†). Furthermore, the observed d-spacing can be deconvolved into the underlying template/pore diameter and wall thickness using these best-fit parameters which closely matched the direct and model-independent measurements from SEM (Fig. 6). Thus, O45F11 micelles in MeOH (aq) were most consistent with kinetic entrapment. This PMT series also demonstrated an unprecedented 2.7× change in average wall thickness across a 45-sample series which is 90% larger than any prior PMT demonstration,36 suggesting particularly persistent micelles are feasible in the high-χ, low-N regime (Scheme 1).
O45F8 micelles: dynamic or persistent?
The analogous O45F8 was next investigated in the same fashion with an M![[thin space (1/6-em)]](https://www.rsc.org/images/entities/char_2009.gif) :
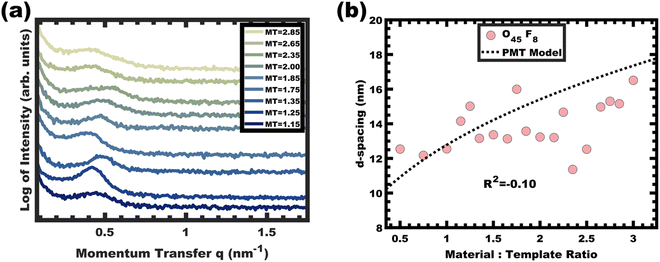
:![[thin space (1/6-em)]](https://www.rsc.org/images/entities/char_2009.gif) T series spanning from 1.0–3.0. With so few repeated FOA units, the change of an average degree of polymerization from 11 to 8 appears minor but nonetheless constitutes a 27% decrease. Fig. 7a shows the resulting SAXS data for this series where the structure factor was significantly broader than the prior example and the peak position varied sporadically with increasing M
T series spanning from 1.0–3.0. With so few repeated FOA units, the change of an average degree of polymerization from 11 to 8 appears minor but nonetheless constitutes a 27% decrease. Fig. 7a shows the resulting SAXS data for this series where the structure factor was significantly broader than the prior example and the peak position varied sporadically with increasing M![[thin space (1/6-em)]](https://www.rsc.org/images/entities/char_2009.gif) :
:![[thin space (1/6-em)]](https://www.rsc.org/images/entities/char_2009.gif) T (Fig. 7b) which is inconsistent with persistent micelle behavior. The corresponding d-spacing trend in log–log coordinate space is similarly unpredictable where the linear best-fit yields a slope of 0.08 with R2 = −0.10 (Fig. S9b, ESI†). Such sporadic d-spacing trends are often observed for dynamic and non-equilibrated micelles36,40 where the resulting micelle size, size distribution, and structure factor are expected to vary the d-spacing in a non-monotonic fashion. Thus, the micelles prepared from O45F8 in MeOH (aq) were most consistent with dynamic chain exchange.
T (Fig. 7b) which is inconsistent with persistent micelle behavior. The corresponding d-spacing trend in log–log coordinate space is similarly unpredictable where the linear best-fit yields a slope of 0.08 with R2 = −0.10 (Fig. S9b, ESI†). Such sporadic d-spacing trends are often observed for dynamic and non-equilibrated micelles36,40 where the resulting micelle size, size distribution, and structure factor are expected to vary the d-spacing in a non-monotonic fashion. Thus, the micelles prepared from O45F8 in MeOH (aq) were most consistent with dynamic chain exchange.
Evaluation of the χN value from solubility parameters
The χN values were compared for the two considered polymer solutions. The estimation of χ values from Hildebrand solubility parameters (δ) are semi-quantitative at best but are distinctively convenient and often monotonic with reality (at least for minor changes).99 The relationship100 is:where v is the repeat unit volume (FOA volume in PFOA), kb is the Boltzmann constant, T is the absolute temperature in kelvin, and the δ terms correspond to Hildebrand solubility parameters associated with the two-component interface under consideration. Hildebrand solubility parameters are determined by a range of methods where the magnitude corresponds to the volume-weighted energy of self-self-intermolecular interactions (cohesive energy density). Here, the molar volume of FOA was calculated to be 0.501 nm3 from group approximations.101 Caution should be taken when comparing χ values calculated using different molar volume (v) values where a common lattice volume of 0.118 nm3 is sometimes assumed for comparisons without mer-volume effects. Regardless of which convention is used, the corresponding χN product is not affected. For the present system, Hildebrand solubility parameters of 14.5 √MPa for PFOA102 and 30.0 √MPa for the MeOH (aq)103 solution yielded an estimation of χcore–solvent = 29.2. It is worth noting that χcore–solvent is often substantially larger than χA–B even when one polymer block has the same repeat unit structure as the solvent.104,105 For example, a polymer-polymer blend χA–B can be as low as 10−2–10−3, however χcore–solvent values even in good solvents tend towards a lower limit of ∼0.34.104,106,107 The two studied conditions were thus estimated to have χN = 321 for O45F11 persistent micelles and χN = 234 for O45F8 dynamic micelles, both well within what would be called the strong segregation regime for bulk block polymers. Again, note the hazardous application of self-consistent mean-field theory to an oligomeric system that is far from the limit of N → ∞. A prior study of 43.5 kg mol−1 PEO-b-PHA, for example, exhibited a transition from persistent micelles to dynamic micelles when similarly estimated χN values transitioned from ∼140 to 122, considerably lower than the present case, albeit still within the strong segregation limit (Scheme 1).34 The significant contrast between F11 and F8-based micelle behavior reveals the previously reported “hypersensitivity to chain length”18 within a curious low-N regime where very minor changes to N have large ramifications to micelle kinetics.
More direct micelle measurements via bulk casting
The persistent O45F11 micelles were next examined with more challenging (slow) bulk casting. From a micelle persistence perspective, there are added challenges in bulk processing relative to fast evaporation during spin coating in the above examples. Such challenges are due in large part to the more gradual decrease in χ during solvent evaporation coupled with the extended evaporation time for bulk casting. To the best of our knowledge, there are no examples of bulk PMTs processed by casting. In brief, the O45F11 micelle template solutions were combined with titania nanoparticles as described above (see Experimental) and were evaporated in Teflon dishes at room temperature. A series of samples were prepared with M![[thin space (1/6-em)]](https://www.rsc.org/images/entities/char_2009.gif) :
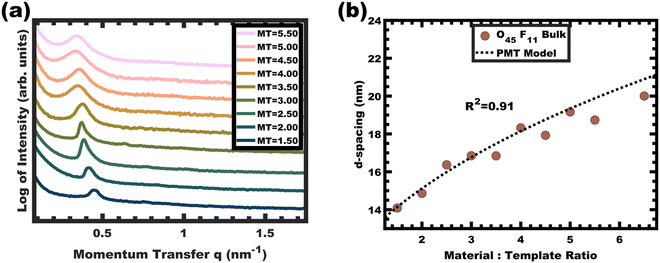
:![[thin space (1/6-em)]](https://www.rsc.org/images/entities/char_2009.gif) T = 1.0–6.5. The SAXS patterns for this sample series exhibited a leftward shift towards lower q-values consistent with the d-spacing lattice expansion expected for persistent micelle templates (Fig. 8a). Again, the log–log coordinate space was used to identify regions of consistency with PMT behavior (Fig. S9c, ESI†). A linear trend was identified from M
T = 1.0–6.5. The SAXS patterns for this sample series exhibited a leftward shift towards lower q-values consistent with the d-spacing lattice expansion expected for persistent micelle templates (Fig. 8a). Again, the log–log coordinate space was used to identify regions of consistency with PMT behavior (Fig. S9c, ESI†). A linear trend was identified from M![[thin space (1/6-em)]](https://www.rsc.org/images/entities/char_2009.gif) :
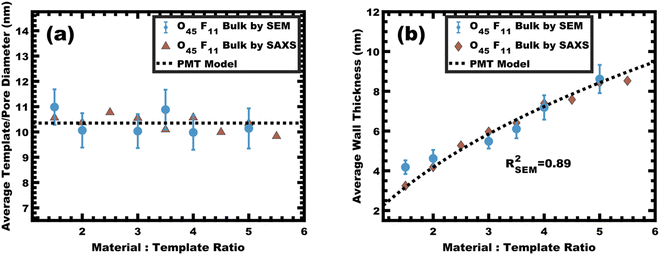
:![[thin space (1/6-em)]](https://www.rsc.org/images/entities/char_2009.gif) T = 1.5–6.5 with a linear best-fit slope of 0.23 that was lower than the expected approximate slope of 1/3 but nevertheless was well-fitted by the PMT model without approximations (Fig. 8b). The corresponding SEM data presented in Fig. 9 are consistent with randomly packed spherical micelles albeit with less order than their spin coated counterparts. The analysis of hundreds of measurements from SEM images revealed a relatively constant average template/pore size of 10.35 ± 0.29 nm (Fig. 10a). Similarly, the average wall thickness measured from SEM images monotonically increased from 4.18 ± 0.34 nm to 8.62 ± 0.71 nm with increasing material addition. The template/pore size and wall thickness metrics calculated using SAXS data and the PMT model best-fit closely correspond to the model-free and direct measurements by SEM with the latter having a goodness-of-fit R2 = 0.89 (Fig. 10b). Thus, both the SAXS and SEM data were consistent with persistent micelles for the bulk processed O45F11 micelles despite the slow processing. This first example of bulk PMT samples highlights the deep extent of kinetic entrapment for these high-χ, low-N micelles.
T = 1.5–6.5 with a linear best-fit slope of 0.23 that was lower than the expected approximate slope of 1/3 but nevertheless was well-fitted by the PMT model without approximations (Fig. 8b). The corresponding SEM data presented in Fig. 9 are consistent with randomly packed spherical micelles albeit with less order than their spin coated counterparts. The analysis of hundreds of measurements from SEM images revealed a relatively constant average template/pore size of 10.35 ± 0.29 nm (Fig. 10a). Similarly, the average wall thickness measured from SEM images monotonically increased from 4.18 ± 0.34 nm to 8.62 ± 0.71 nm with increasing material addition. The template/pore size and wall thickness metrics calculated using SAXS data and the PMT model best-fit closely correspond to the model-free and direct measurements by SEM with the latter having a goodness-of-fit R2 = 0.89 (Fig. 10b). Thus, both the SAXS and SEM data were consistent with persistent micelles for the bulk processed O45F11 micelles despite the slow processing. This first example of bulk PMT samples highlights the deep extent of kinetic entrapment for these high-χ, low-N micelles.
Nanoparticle distribution in micelles
The micelle core dimensions were next compared to the resulting pore dimensions to measure the distribution of nanoparticles with respect to the core–corona interface. Again, PEO based polymers are typically reported to distribute hydrophilic nanoparticles throughout that block.108 As described above, the core diameter of O45F11 micelles was 11.24 nm as determined by SAXS form factor fitting. However, the bulk processed O45F11 micelles templates exhibited an average pore diameter of 10.35 ± 0.29 nm. This difference of 0.89 ± 0.03 nm is statistically significant and warrants further understanding. While the inorganic is expected to contract because of thermal processing, that change cannot explain this difference since contraction of the inorganic would rather enlarge the pore diameter. However, the opposite is the case where the pore size is smaller than the micelle core size, suggesting that the nanoparticle distribution extends through the corona and ∼0.45 nm beyond the core–corona interface (Scheme 3). This is particularly surprising considering the fluorophobic interaction between the nanoparticles and FOA, suggesting that the driving force for this phenomenon is translational entropy as predicted by previous computations.62,63 Prior mixtures of block polymers and nanoparticles have tended towards a nanoparticle preference of one domain or the interface of the two domains, depending on the nature of nanoparticle–polymer interaction and polymer architecture.70,109–111 In contrast, the present data report a case where both distribution types are apparent simultaneously which is consistent with several prior reports of mismatched dimensions or predominant placement at the interface with minor nanoparticle content within another block.40,112–114 It is worth pointing out that the thermodynamic driving forces that favor these two different nanoparticle distributions are not mutually exclusive. This interpretation is further supported by analysis of the spin coated samples. During thin film processing, shrinkage due to solvent evaporation and inorganic condensation is principally accommodated in the out-of-plane direction due to good adhesion with the substrate. This distortion is not apparent by standard top-down SEM or transmission SAXS but is apparent with cross-sectional SEM and tilted/grazing incidence SAXS (Fig. S12, ESI†).115 This distortion was included when analyzing spin coated samples by using data acquired with the samples tilted at 45° relative to the incident X-ray beam. The ellipsoidal structure factor was extrapolated to calculate the purely out-of-plane dimension (Fig. S11, ESI†). The structure factor distortion was assumed to be equal to the micelle template distortion (Fig. S11b, ESI†). Thus, combining the in-plane template diameter from SEM with this SAXS-derived distortion factor yielded the corresponding out-of-plane pore diameter of 8.40 ± 0.17 nm. The volume of this ellipsoidal template was equivalent to an undistorted sphere with a diameter of 10.46 ± 0.21 nm (Table S10, ESI†) which is statistically indistinguishable from the bulk sample template diameter of 10.35 ± 0.29 (∼1% difference). This is the first geometric comparison of identical PMTs applied to bulk and thin film samples. Thus, both undistorted bulk samples and distorted thin film samples exhibited pore dimensions that were consistent with nanoparticles extending both through the micelle corona and into the corona–core interface where such a dual preference may be a common though underappreciated phenomenon.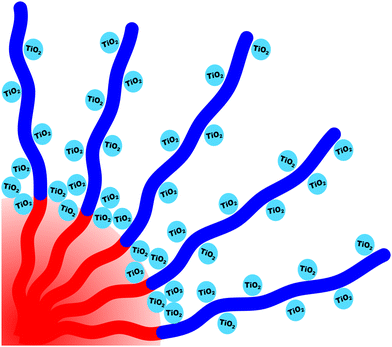 | ||
| Scheme 3 Depiction of nanoparticles preferentially interacting with the corona blocks while simultaneously being localized within the core–corona interface. | ||
Conclusion
Perfluorinated amphiphiles represent a fascinating and unique class of high-χ polymers whose potential for a variety of applications are continuing to be realized. Such polymers constitute a special class of candidates for kinetic entrapment as the high-χ values lower the required N for kinetically trapped, persistent micelles. Herein, it was shown that micellization and subsequent kinetic entrapment of the high-χ, low-N polymer poly(ethylene oxide-b-perfluorooctyl acrylate) (PEO-b-PFOA) can be achieved in methanolic (aq) solutions with N = 11 whereas dynamic micelles were found with N = 8. The resulting O45F11 persistent micelles exhibited remarkable levels of persistence, enabling the most expansive persistent micelle template series to date with a 45-sample series spanning 170% increase in wall thickness tunability. The deeply trapped character of these O45F11 micelles enabled the first demonstration of bulk PMT casting with extended micelle persistence throughout the necessarily slow evaporation process. Careful comparison of the micelle core dimensions to the resulting pore dimensions revealed that the inorganic nanoparticle distribution extended throughout the corona and ∼0.45 nm past the core–corona interface.Conflicts of interest
The authors declare no competing financial interest.Acknowledgements
E. R. W. and M. S. acknowledge support by the ACS Petroleum Research Foundation, Award No. 60855-ND7. W. v. d. B. and M. S. acknowledge support by the NSF CAREER program, NSF Award No. DMR-1752615.References
- Y. Mai and A. Eisenberg, Chem. Soc. Rev., 2012, 41, 5969–5985 RSC
.
- H. Feng, X. Lu, W. Wang, N. Kang and J. W. Mays, Polymers, 2017, 9, 494 CrossRef PubMed
.
- T. H. Epps III and R. K. O'Reilly, Chem. Sci., 2016, 7, 1674–1689 RSC
.
- Y. Liu, J. Goebl and Y. Yin, Chem. Soc. Rev., 2013, 42, 2610–2653 RSC
.
- L. Leibler, Macromolecules, 1980, 13, 1602–1617 CrossRef CAS
.
- C. Sinturel, F. S. Bates and M. A. Hillmyer, ACS Macro Lett., 2015, 4, 1044–1050 CrossRef CAS PubMed
.
- C. M. Bates, T. Seshimo, M. J. Maher, W. J. Durand, J. D. Cushen, L. M. Dean, G. Blachut, C. J. Ellison and C. G. Willson, Science, 2012, 338, 775–779 CrossRef CAS PubMed
.
- C. M. Bates, M. J. Maher, D. W. Janes, C. J. Ellison and C. G. Willson, Macromolecules, 2014, 47, 2–12 CrossRef CAS
.
- Y. Luo, D. Montarnal, S. Kim, W. Shi, K. P. Barteau, C. W. Pester, P. D. Hustad, M. D. Christianson, G. H. Fredrickson, E. J. Kramer and C. J. Hawker, Macromolecules, 2015, 48, 3422–3430 CrossRef CAS
.
- K. Yoshida, L. Tian, K. Miyagi, A. Yamazaki, H. Mamiya, T. Yamamoto, K. Tajima, T. Isono and T. Satoh, Macromolecules, 2018, 51, 8064–8072 CrossRef CAS
.
- X. Chevalier, C. Gomes Correia, G. Pound-Lana, P. Bézard, M. Sérégé, C. Petit-Etienne, G. Gay, G. Cunge, B. Cabannes-Boué, C. Nicolet, C. Navarro, I. Cayrefourcq, M. Müller, G. Hadziioannou, I. Iliopoulos, G. Fleury and M. Zelsmann, ACS Appl. Mater. Interfaces, 2021, 13, 11224–11236 CrossRef CAS PubMed
.
- G. Yu and A. Eisenberg, Macromolecules, 1998, 31, 5546–5549 CrossRef CAS
.
- K. Yu, C. Bartels and A. Eisenberg, Langmuir, 1999, 15, 7157–7167 CrossRef CAS
.
- L. Zhang and A. Eisenberg, Macromolecules, 1999, 32, 2239–2249 CrossRef CAS
.
- L. Luo and A. Eisenberg, Langmuir, 2001, 17, 6804–6811 CrossRef CAS
.
- P. Bhargava, J. X. Zheng, P. Li, R. P. Quirk, F. W. Harris and S. Z. D. Cheng, Macromolecules, 2006, 39, 4880–4888 CrossRef CAS
.
- P. Bhargava, Y. Tu, J. X. Zheng, H. Xiong, R. P. Quirk and S. Z. D. Cheng, J. Am. Chem. Soc., 2007, 129, 1113–1121 CrossRef CAS PubMed
.
- S. Choi, T. P. Lodge and F. S. Bates, Phys. Rev. Lett., 2010, 104, 047802 CrossRef PubMed
.
- S. Choi, F. S. Bates and T. P. Lodge, Macromolecules, 2011, 44, 3594–3604 CrossRef CAS
.
- J. Lu, F. S. Bates and T. P. Lodge, ACS Macro Lett., 2013, 2, 451–455 CrossRef CAS PubMed
.
- L. R. Parent, E. Bakalis, A. Ramírez-Hernández, J. K. Kammeyer, C. Park, J. De Pablo, F. Zerbetto, J. P. Patterson and N. C. Gianneschi, J. Am. Chem. Soc., 2017, 139, 17140–17151 CrossRef CAS PubMed
.
- E. G. Kelley, R. P. Murphy, J. E. Seppala, T. P. Smart, S. D. Hann, M. O. Sullivan and T. H. Epps, Nat. Commun., 2014, 5, 3599–3609 CrossRef PubMed
.
- A. G. Denkova, E. Mendes and M. Coppens, Soft Matter, 2010, 6, 2351–2357 RSC
.
- T. Nicolai, O. Colombani and C. Chassenieux, Soft Matter, 2010, 6, 3111–3118 RSC
.
- E. E. Dormidontova, Macromolecules, 1999, 32, 7630–7644 CrossRef CAS
.
- L. Meli, J. M. Santiago and T. P. Lodge, Macromolecules, 2010, 43, 2018–2027 CrossRef CAS
.
- A. Halperin and S. Alexander, Macromolecules, 1989, 22, 2403–2412 CrossRef CAS
.
- R. Lund, L. Willner, D. Richter and E. E. Dormidontova, Macromolecules, 2006, 39, 4566–4575 CrossRef CAS
.
- E. Wang, J. Zhu, D. Zhao, S. Xie, F. S. Bates and T. P. Lodge, Macromolecules, 2020, 53, 417–426 CrossRef CAS
.
- A. Mahmud, X. Xiong and A. Lavasanifar, Macromolecules, 2006, 39, 9419–9428 CrossRef CAS
.
- F. Li, M. Danquah and R. I. Mahato, Biomacromolecules, 2010, 11, 2610–2620 CrossRef CAS PubMed
.
- Y. Zhang, Q. Li, W. J. Welsh, P. V. Moghe and K. E. Uhrich, Biomaterials, 2015, 84, 230–240 CrossRef PubMed
.
- X. Sun, G. Wang, H. Zhang, S. Hu, X. Liu, J. Tang and Y. Shen, ACS Nano, 2018, 12, 6179–6192 CrossRef CAS PubMed
.
- H. N. Lokupitiya, A. Jones, B. Reid, S. Guldin and M. Stefik, Chem. Mater., 2016, 28, 1653–1667 CrossRef CAS
.
- A. Sarkar and M. Stefik, J. Mater. Chem. A, 2017, 5, 11840–11853 RSC
.
- A. Sarkar, L. Evans and M. Stefik, Langmuir, 2018, 34, 5738–5749 CrossRef CAS PubMed
.
- K. A. Lantz, N. B. Clamp, W. van den Bergh, A. Sarkar and M. Stefik, Small, 2019, 15, 1900393 CrossRef PubMed
.
- A. Sarkar, A. Thyagarajan, A. Cole and M. Stefik, Soft Matter, 2019, 15, 5193–5203 RSC
.
- W. van den Bergh, H. N. Lokupitiya, N. A. Vest, B. Reid, S. Guldin and M. Stefik, Adv. Funct. Mater., 2021, 31, 2007826 CrossRef CAS
.
- E. R. Williams, P. L. McMahon, J. E. Reynolds, J. L. Snider, V. Stavila, M. D. Allendorf and M. Stefik, Mater. Adv., 2021, 2, 5381–5395 RSC
.
- W. van den Bergh, E. R. Williams, N. A. Vest, P. Chiang and M. Stefik, Langmuir, 2021, 37, 12874–12886 CrossRef CAS PubMed
.
- K. A. Lantz, A. Sarkar, K. C. Littrell, T. Li, K. Hong and M. Stefik, Macromolecules, 2018, 51, 6967–6975 CrossRef CAS
.
- Y. Won, H. T. Davis and F. S. Bates, Macromolecules, 2003, 36, 953–955 CrossRef CAS
.
- J. Lu, S. Choi, F. S. Bates and T. P. Lodge, ACS Macro Lett., 2012, 1, 982–985 CrossRef CAS PubMed
.
- T. Zinn, L. Willner, R. Lund, V. Pipich and D. Richter, Soft Matter, 2012, 8, 623–626 RSC
.
- R. P. Murphy, E. G. Kelley, S. A. Rogers, M. O. Sullivan and T. H. Epps, ACS Macro Lett., 2014, 3, 1106–1111 CrossRef CAS PubMed
.
- Y. Ma and T. P. Lodge, Macromolecules, 2016, 49, 9542–9552 CrossRef CAS
.
- S. Kim, S. Lee, S. Choi and K. Char, Macromolecules, 2021, 54, 4739–4746 CrossRef CAS
.
- N. König, L. Willner, V. Pipich, T. Zinn and R. Lund, Phys. Rev. Lett., 2019, 122, 78001–78007 CrossRef PubMed
.
- T. Larison and M. Stefik, Langmuir, 2021, 37, 9817–9825 CrossRef CAS PubMed
.
- R. Xu, M. A. Winnik, F. R. Hallett, G. Riess and M. D. Croucher, Macromolecules, 1991, 24, 87–93 CrossRef CAS
.
- I. W. Hamley, V. Castelletto, Z. Yang, C. Price and C. Booth, Macromolecules, 2001, 34, 4079–4081 CrossRef CAS
.
- D. Mu, X. Huang, Z. Lu and C. Sun, Chem. Phys., 2008, 348, 122–129 CrossRef CAS
.
- V. Percec, G. Johansson, G. Ungar and J. Zhou, J. Am. Chem. Soc., 1996, 118, 9855–9866 CrossRef CAS
.
- J. Shen and T. Hogen-Esch, J. Am. Chem. Soc., 2008, 130, 10866–10867 CrossRef CAS PubMed
.
- G. Johansson, V. Percec, G. Ungar and K. Smith, Chem. Mater., 1997, 9, 164–175 CrossRef CAS
.
- M. A. Hillmyer and T. P. Lodge, J. Polym. Sci. Part A: Polym. Chem., 2002, 40, 1–8 CrossRef CAS
.
- C. W. Bunn and E. R. Howells, Nature, 1954, 174, 549–551 CrossRef CAS
.
- V. H. Dalvi and P. J. Rossky, Proc. Natl. Acad. Sci. U. S. A., 2010, 107, 13603–13607 CrossRef CAS PubMed
.
-
W. M. Haynes, CRC Handbook of Chemistry and Physics, Taylor & Francis Group, Boca Raton, FL, 2011 Search PubMed
.
- Q. Wang, Q. Zhang, X. Zhan and F. Chen, J. Polym. Sci. Part A: Polym. Chem., 2010, 48, 2584–2593 CrossRef CAS
.
- J. Lee, R. B. Thompson, D. Jasnow and A. C. Balazs, Phys. Rev. Lett., 2002, 89, 155503 CrossRef PubMed
.
- A. J. Schultz, C. K. Hall and J. Genzer, Macromolecules, 2005, 38, 3007–3016 CrossRef CAS
.
- B. Sanchez-Gaytan, W. Cui, Y. Kim, M. Mendez-Polanco, T. Duncan, M. Fryd, B. Wayland and S. Park, Angew. Chem., Int. Ed., 2007, 46, 9235–9238 CrossRef CAS PubMed
.
- Q. Li, J. He, E. Glogowski, X. Li, J. Wang, T. Emrick and T. P. Russell, Adv. Mater., 2008, 20, 1462–1466 CrossRef CAS
.
- B. L. Sanchez-Gaytan, S. Li, A. C. Kamps, R. J. Hickey, N. Clarke, M. Fryd, B. B. Wayland and S. Park, J. Phys. Chem., 2011, 115, 7836–7842 CAS
.
- S. S. Lamarre, C. Lemay, C. Labrecque and A. M. Ritcey, Langmuir, 2013, 29, 10891–10898 CrossRef CAS PubMed
.
- M. R. Bockstaller, Y. Lapetnikov, S. Margel and E. L. Thomas, J. Am. Chem. Soc., 2003, 125, 5276–5277 CrossRef CAS PubMed
.
- J. J. Chiu, B. J. Kim, E. J. Kramer and D. J. Pine, J. Am. Chem. Soc., 2005, 127, 5036–5037 CrossRef CAS PubMed
.
- Y. Mai and A. Eisenberg, Acc. Chem. Res., 2012, 45, 1657–1666 CrossRef CAS PubMed
.
- J. Bae, J. Lawrence, C. Miesch, A. Ribbe, W. Li, T. Emrick, J. Zhu and R. C. Hayward, Adv. Mater., 2012, 24, 2735–2741 CrossRef CAS PubMed
.
- Q. Luo, R. J. Hickey and S. Park, ACS Macro Lett., 2013, 2, 107–111 CrossRef CAS PubMed
.
- A. C. Balazs, T. Emrick and T. P. Russell, Science, 2006, 314, 1107–1110 CrossRef CAS PubMed
.
- S. Mei, J. Cao and Y. Lu, J. Mater. Chem. A, 2015, 3, 3382–3389 RSC
.
- D. B. G. Williams and M. Lawton, J. Org. Chem., 2010, 75, 8351–8354 CrossRef CAS PubMed
.
- H. N. Lokupitiya and M. Stefik, Nanoscale, 2017, 9, 1393–1397 RSC
.
- S. Z. Mikhail and W. R. Kimel, J. Chem. Eng. Data, 1961, 6, 533–537 CrossRef CAS
.
- M. Iglesias, B. Orge and J. Tojo, Fluid Phase Equilibria, 1996, 126, 203–223 CrossRef CAS
.
- E. Wang, J. Lu, F. S. Bates and T. P. Lodge, Macromolecules, 2018, 51, 3563–3571 CrossRef CAS
.
- D. Zhao, Y. Ma and T. P. Lodge, Macromolecules, 2018, 51, 2312–2320 CrossRef CAS
.
- Y. Ma and T. P. Lodge, Macromolecules, 2016, 49, 3639–3646 CrossRef CAS
.
- E. Bagshaw, T. J. Proust and T. J. Pinnavaia, Science, 1995, 269, 1242–1244 CrossRef PubMed
.
- M. Templin, A. Franck, A. Du Chesne, H. Leist, Y. Zhang, R. Ulrich, V. Schädler and U. Wiesner, Science, 1997, 278, 1795–1798 CrossRef CAS PubMed
.
- Y. Ren, Z. Ma and P. G. Bruce, Chem. Soc. Rev., 2012, 41, 4909–4927 RSC
.
- J. Liu, S. Zou, X. Liao, Y. Hong, L. Xiao and J. Fan, J. Mater. Chem. A, 2013, 1, 4038–4047 RSC
.
- B. Wei, X. Guo, Y. Cui, S. Ma, W. Li and Y. Bai, Eur. Polym. J., 2022, 162, 110872 CrossRef CAS
.
- G. Wanka, H. Hoffmann and W. Ulbricht, Macromolecules, 1994, 27, 4145–4159 CrossRef CAS
.
- D. Lombardo, G. Munaò, P. Calandra, L. Pasqua and M. T. Caccamo, Phys. Chem. Chem. Phys., 2019, 21, 11983–11991 RSC
.
- K. Matsumoto, H. Mazaki and H. Matsuoka, Macromolecules, 2004, 37, 2256–2267 CrossRef CAS
.
- A. Jada, G. Hurtrez, B. Siffert and G. Riess, Macromol. Chem. Phys., 1996, 197, 3697–3710 CrossRef CAS
.
- K. Mortensen, W. Brown, K. Almdal, E. Alami and A. Jada, Langmuir, 1997, 13, 3635–3645 CrossRef CAS
.
- M. Nakano, M. Deguchi, K. Matsumoto, H. Matsuoka and H. Yamaoka, Macromolecules, 1999, 32, 7437–7443 CrossRef CAS
.
- O. Clatter, G. Scherf, K. Schillén and W. Brown, Macromolecules, 1994, 27, 6046–6054 CrossRef
.
- M. K. Norris, B. P. Fuhrman and C. L. Leach, AACN Clin. Issues Crit. Care Nurs., 1994, 3, 246–254 CrossRef PubMed
.
- J. S. Pedersen, Adv. Colloid Interface Sci., 1997, 70, 171–210 CrossRef CAS
.
- M. Schwab and B. Stühn, Phys. Rev. Lett., 1996, 76, 924–927 CrossRef CAS PubMed
.
- M. Schwab and B. Stühn, Colloid Polym. Sci., 1997, 275, 341–351 CrossRef CAS
.
- X. Wang, E. E. Dormidontova and T. P. Lodge, Macromolecules, 2002, 35, 9687–9697 CrossRef CAS
.
- M. Stefik, J. Mater. Res., 2022, 37, 25–42 CrossRef CAS
.
-
J. Brandup, E. H. Immergut and E. A. Grulke, Polymer Handbook, New York, 1999 Search PubMed
.
-
E. A. Grulke, Solubility Parameter Values, John Wiley & Sons, Hoboken, NJ, 2005 Search PubMed
.
- S. Kim, Y. Cho, J. H. Kim, S. Song, J. Lim, S. Choi and K. Char, ACS Macro Lett., 2020, 9, 1261–1266 CrossRef CAS PubMed
.
- A. F. M. Barton, Chem. Rev., 1974, 75, 731–751 CrossRef
.
-
P. C. Hiemenz and T. P. Lodge, Polymer Chemistry, CRC Press, 2007 Search PubMed
.
-
J. Brandrup, E. H. Immergut and E. A. Grulke, Polymer Handbook, Wiley-Interscience, Boca Raton, FL, 1999 Search PubMed
.
-
J. Brandrup, E. H. Immergut, E. A. Grulke, A. Abe and D. R. Bloch, Polymer Handbook, Wiley, New York, 1999 Search PubMed
.
-
J. E. Mark, Physical Properties of Polymers Handbook, Springer, New York, 2007 Search PubMed
.
- M. Stefik, S. Wang, R. Hovden, H. Sai, M. W. Tate, D. A. Muller, U. Steiner, S. M. Gruner and U. Wiesner, J. Mater. Chem., 2012, 22, 1078–1087 RSC
.
- J. Wang, W. Li and J. Zhu, Polymer, 2014, 55, 1079–1096 CrossRef CAS
.
- R. Liang, J. Xu, W. Li, Y. Liao, K. Wang, J. You, J. Zhu and W. Jiang, Macromolecules, 2015, 48, 256–263 CrossRef CAS
.
- A. Haryono and W. H. Binder, Small, 2006, 2, 600–611 CrossRef CAS PubMed
.
- H. Chung, J. Kim, K. Ohno and R. J. Composto, ACS Macro Lett., 2012, 1, 252–256 CrossRef CAS PubMed
.
- Y. Guo, S. Harirchian-Saei, C. M. S. Izumi and M. G. Moffitt, ACS Nano, 2011, 5, 3309–3318 CrossRef CAS PubMed
.
- M. Wang, S. Kumar, A. Lee, N. Felorzabihi, L. Shen, F. Zhao, P. Froimowicz, G. D. Scholes and M. A. Winnik, J. Am. Chem. Soc., 2008, 130, 9481–9491 CrossRef CAS PubMed
.
- W. Ruland and B. M. Smarsly, J. Appl. Crystallogr., 2007, 40, 409–417 CrossRef CAS
.
Footnote |
| † Electronic supplementary information (ESI) available. See DOI: https://doi.org/10.1039/d2sm00513a |
| This journal is © The Royal Society of Chemistry 2022 |

