
 Open Access Article
 This Open Access Article is licensed under a
 Creative Commons Attribution 3.0 Unported Licence
Biodistribution, degradability and clearance of 2D materials for their biomedical applications
Taojian
Fan†
 ab,
Li
Yan†
a,
Shiliang
He†
a,
Qiancun
Hong
a,
Fujin
Ai
a,
Shuqing
He
a,
Tao
Ji
a,
Xin
Hu
a,
Enna
Ha
a,
Bin
Zhang
b,
Zigang
Li
cd,
Han
Zhang
*b,
Xianfeng
Chen
*e and
Junqing
Hu
*ac
ab,
Li
Yan†
a,
Shiliang
He†
a,
Qiancun
Hong
a,
Fujin
Ai
a,
Shuqing
He
a,
Tao
Ji
a,
Xin
Hu
a,
Enna
Ha
a,
Bin
Zhang
b,
Zigang
Li
cd,
Han
Zhang
*b,
Xianfeng
Chen
*e and
Junqing
Hu
*ac
aCollege of Health Science and Environmental Engineering, Shenzhen Technology University, 518118, Shenzhen, China. E-mail: hujunqing@sztu.edu.cn
bInstitute of Microscale Optoelectronics, and Otolaryngology Department of the First Affiliated Hospital, Shenzhen Second People's Hospital, Health Science Center, Shenzhen University, Shenzhen 518060, China. E-mail: hzhang@szu.edu.cn
cPingshan Translational Medicine Center, Shenzhen Bay Laboratory, Shenzhen 518132, China
dLaboratory of Chemical Oncogenomics, School of Chemical Biology and Biotechnology, Peking University Shenzhen Graduate School, Shenzhen, 518055, China
eSchool of Engineering, Institute for Bioengineering, The University of Edinburgh, King's Buildings, Mayfield Road, Edinburgh EH9 3JL, UK. E-mail: michael.chen@ed.ac.uk
First published on 1st September 2022
Abstract
Two-dimensional (2D) materials have evolved to be a class of rapidly advancing chemical entities in the biomedical field. Nevertheless, potential side effects and safety concerns severely limit their clinical translation. After administration, 2D materials cross multiple biological barriers and are distributed throughout the body. Only the portion that accumulates at the diseased sites exerts a therapeutic effect, whereas those distributed elsewhere may cause damage to healthy tissues and interference to normal physiological function of various organs. To achieve maximum therapeutic efficacy and minimum adverse effects simultaneously, the delivery of 2D materials must be targeted at diseased sites to reach therapeutic concentrations, and the materials must possess sufficient degradation and clearance rates to avoid long-term toxicity. Therefore, it is essential to understand the biodistribution and destiny of 2D materials in vivo. In this review, first, we provide a comprehensive picture of the strategies that are currently adopted for regulating the in vivo fate of 2D materials, including modulations of their size, surface properties, composition, and external stimuli. Second, we systematically review the biodistribution, degradation, and metabolism of several newly emerged 2D materials. Finally, we also discuss the development opportunities of 2D materials in the biomedical field and the challenges to be addressed.
Taojian Fan was born in Hubei, China, in 1995, and is pursuing his Ph D degree under the guidance of Prof. Junqing Hu in the College of Health Science and Environmental Engineering, Shenzhen Technology University. His current research interests focus on two-dimensional material based theranostic nanoplatforms for biomedical applications. |
Han Zhang received his PhD from the Nanyang Technological University in 2010. Currently, he is a full professor at the College of Optoelectronic Engineering at Shenzhen University in China. His main research interests are the application of two-dimensional nanomaterials in phototherapy and drug delivery. His publications have received >57 |
Xianfeng Chen received his PhD from the University of Oxford. He is currently working in the Institute for Bioengineering in the School of Engineering at The University of Edinburgh as a Senior Lecturer (Associate Professor). Dr Chen's research is focused on biomaterials, biomedical engineering, and the application of nanomaterials in biology and medicine. |
Junqing Hu received his PhD from University of Science & Technology of China (2000). He is a Full Professor at the College of Health Science and Environmental Engineering, Shenzhen Technology University. He has authored and co-authored more than 300 refereed journal publications and held over 60 patents. His current research interests focus on: (1) the design and functionalization of the NIR-responsive photothermal/photodynamic nanomaterials for biomedical applications and (2) the manipulation and measurements of individual nanostructures inside a TEM. |
Key learning points(1) Unique properties and applications of 2D materials in the biomedicine field.(2) Biological barriers that 2D materials face in vivo. (3) Tracking methods for the biodistribution of 2D materials in vivo. (4) Degradation, metabolism and regulation strategies of 2D materials in vivo. (5) Challenges and prospects of the clinical transformation of 2D materials. This review focuses on recent advances in the biodistribution, biodegradation, and metabolic studies of 2D materials for their biomedical applications. |
1. Introduction
With the rapid development of nanotechnology, increasing numbers of nanomaterials have shown unique advantages in the field of biomedicine and disease therapy. Among these candidate materials, 2D materials are attracting increasing attention as effective therapeutic and diagnostic agents, owing to their advanced properties and ultra-thin planar structure.1 For example, 2D materials exhibit a large specific surface area and chemical active sites, which are highly beneficial for both drug loading and surface modification. Compared to traditional materials, some 2D materials exhibit ultra-sensitive responses to external stimuli, including lasers, X-rays, magnetic fields, and ultrasound.2 2D materials possess numerous excellent properties, such as strong optical absorption, ultra-high photothermal conversion efficiency, and excellent quantum yield of active oxygen.3 Owing to all of these advantages, they are widely used in numerous fields, such as photothermal therapy (PTT), photodynamic therapy (PDT), multimodal imaging, radiotherapy sensitization, drug delivery, cancer immunotherapy, and wound healing.4Although significant advances have been made, the biological safety of 2D materials remains a crucial concern to be addressed before their clinical application. To avoid potential long-term toxicity, an ideal 2D material must be completely metabolized and excreted after treatment. Compared to organic materials, most inorganic materials face disadvantages in terms of biodegradation and metabolism.5 Numerous researchers conducted in-depth studies on the degradation and metabolism of 2D materials. Newman et al. tracked the degradation process of graphene oxide (GO) in vivo for 270 days,6 and observed that the Raman signal of GO in the spleen caused the largest loss within 1 month and became completely undetectable after 9 months. Jasim et al. performed a bladder puncture to obtain the most accurate and timely metabolic data,7 showing that approximately 50–60% GO was found in urine within 2 h post-injection (PI). Besides metabolism, the biodistribution of 2D materials is another essential factor to consider, as the distribution across different organs reflects the metabolic approach of 2D materials. The blood circulation time is related to metabolism. In the design of the diagnosis and treatment platform based on 2D materials, it is crucial to maximize delivery to the diseased areas. A good targeting of the materials not only reduces the side effects induced by off-targeting but also significantly improves the therapeutic effect and reduces the cost. Owing to the flexible plane structure, 2D materials may undergo morphological reconfiguration when trespassing some barrier components.7 Consequently, the biodistribution and metabolism of 2D materials differ from those of other biomaterials and can be rather complex.
This review focuses on recent advances in the biodistribution, biodegradation, and metabolic studies of 2D materials for their biomedical applications. First, the main regulation strategies of the in vivo fate of 2D materials are introduced. Second, the progress of understanding the in vivo behavior of a range of 2D materials is systematically summarized. Finally, the progress, challenges, and future prospects of this field are discussed.
2. The regulation strategies of in vivo 2D materials
The ultimate goal of drug delivery systems is to employ vectors to facilitate the accumulation of therapeutic agents at disease sites, with rapid degradation and metabolization of the vectors without side-effects. However, due to many barriers, most vector materials used in drug delivery systems accumulate in off-target tissues and organs.8 For example, the first barrier is the protein corona, which is formed by proteins in bodily fluids that adsorb to the surface of the vector materials. Previous studies revealed that protein corona might reduce the blood circulation time of nanomaterials, resulting in poor biodistribution and masking of targeting ligands.5 The properties of protein corona depend on the properties of 2D materials themselves and the body fluid environment at first contact. Therefore, tuning the size, shape, surface charge, and administration of 2D materials affects the protein corona. The second barrier that 2D materials must cross is the mononuclear phagocytic system (MPS), which includes monocytes in the blood and macrophages residing in tissues and sequesters most of the administered nanomaterials. For example, Kupffer cells line up inside the liver sinusoids to capture the passing nanoparticles. Consequently, the liver was found to be the main organ accumulating 2D materials.9 In addition to biodistribution, the clearance of 2D materials is another issue that must be considered, as excretion of 2D materials after treatment can reduce potential long-term toxicity. However, only nanomaterials smaller than 6 nm are effectively metabolized by the kidneys,10 which is the most common metabolic pathway. To balance the therapeutic effect and metabolism of 2D materials, researchers have designed various strategies to control the in vivo behavior of 2D materials, including the size, surface modification, element composition, and external stimulus, as shown in Fig. 1. In this section, the strategies of tuning the size, composition, surface modification, and external stimulus to regulate the in vivo fate of 2D materials are described in detail.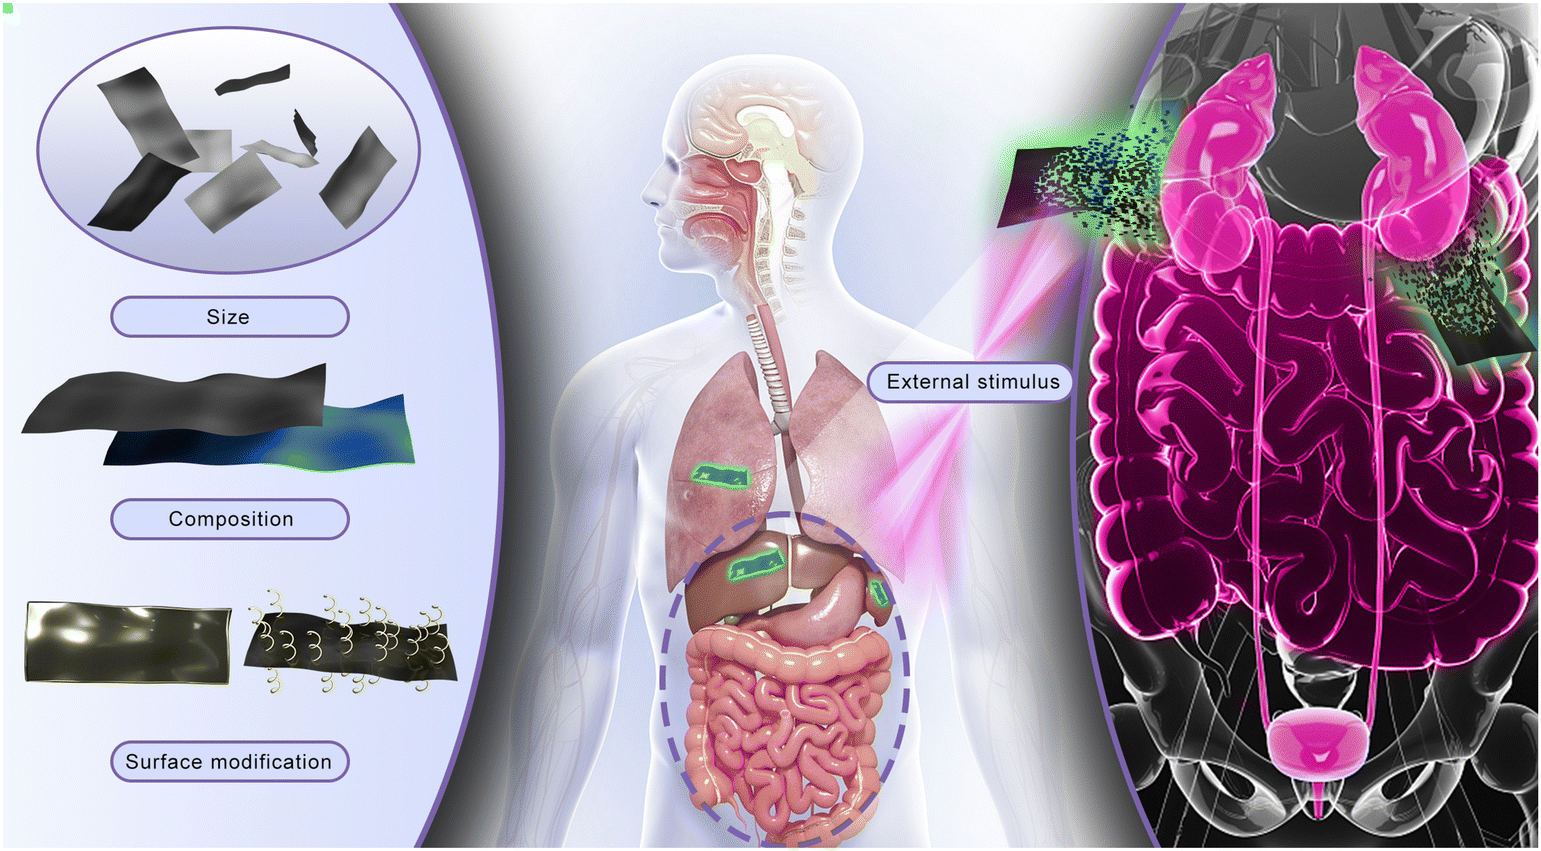 | ||
| Fig. 1 Schematic diagram of the in vivo fate of 2D materials. 2D materials of suitable size, composition, and surface modification are fabricated for biomedical applications. After administration, 2D materials are distributed throughout the body, especially in the MPS-enriched organs. At this stage, external stimuli are applied to modulate the in vivo behavior of 2D materials. Eventually, 2D materials are degraded and excreted with feces and urine. | ||
2.1 Size
The radial size of 2D materials significantly affects their interactions with the biological environment. As one of the most important properties, size dictates cellular uptake, biodistribution, circulation time, clearance routes, and blood–brain barrier (BBB) penetration of 2D materials. Generally, for the treatment and diagnosis of solid tumors, the most common size of 2D materials is <200 nm, which is beneficial to the passive targeting efficiency. Extensive research has been performed to determine the optimal delivery size of each type of 2D material. Cao et al.11 compared the in vivo behavior of PEGylated GO nanosheets with sizes of 91 ± 34 nm and 28 ± 10 nm, as shown in Fig. 2. The in vivo data showed that small GO nanosheets led to 2–5 times higher accumulation at the tumor site than the large ones. The absorption of the small GO nanosheets in tumor and muscle tissues also showed better tumor specificity. Furthermore, the liver related-clearance of small GO nanosheets was significantly faster. Pharmacokinetic studies indicate that the blood circulation time of both small and large GO nanosheets was comparable (first phase half-lives: 0.8 ± 0.1 h for small GO nanosheets and 0.2 ± 0.1 h for large ones; second phase half-lives: 22.5 ± 4.9 h for small GO nanosheets and 26.7 ± 5.8 h for large ones).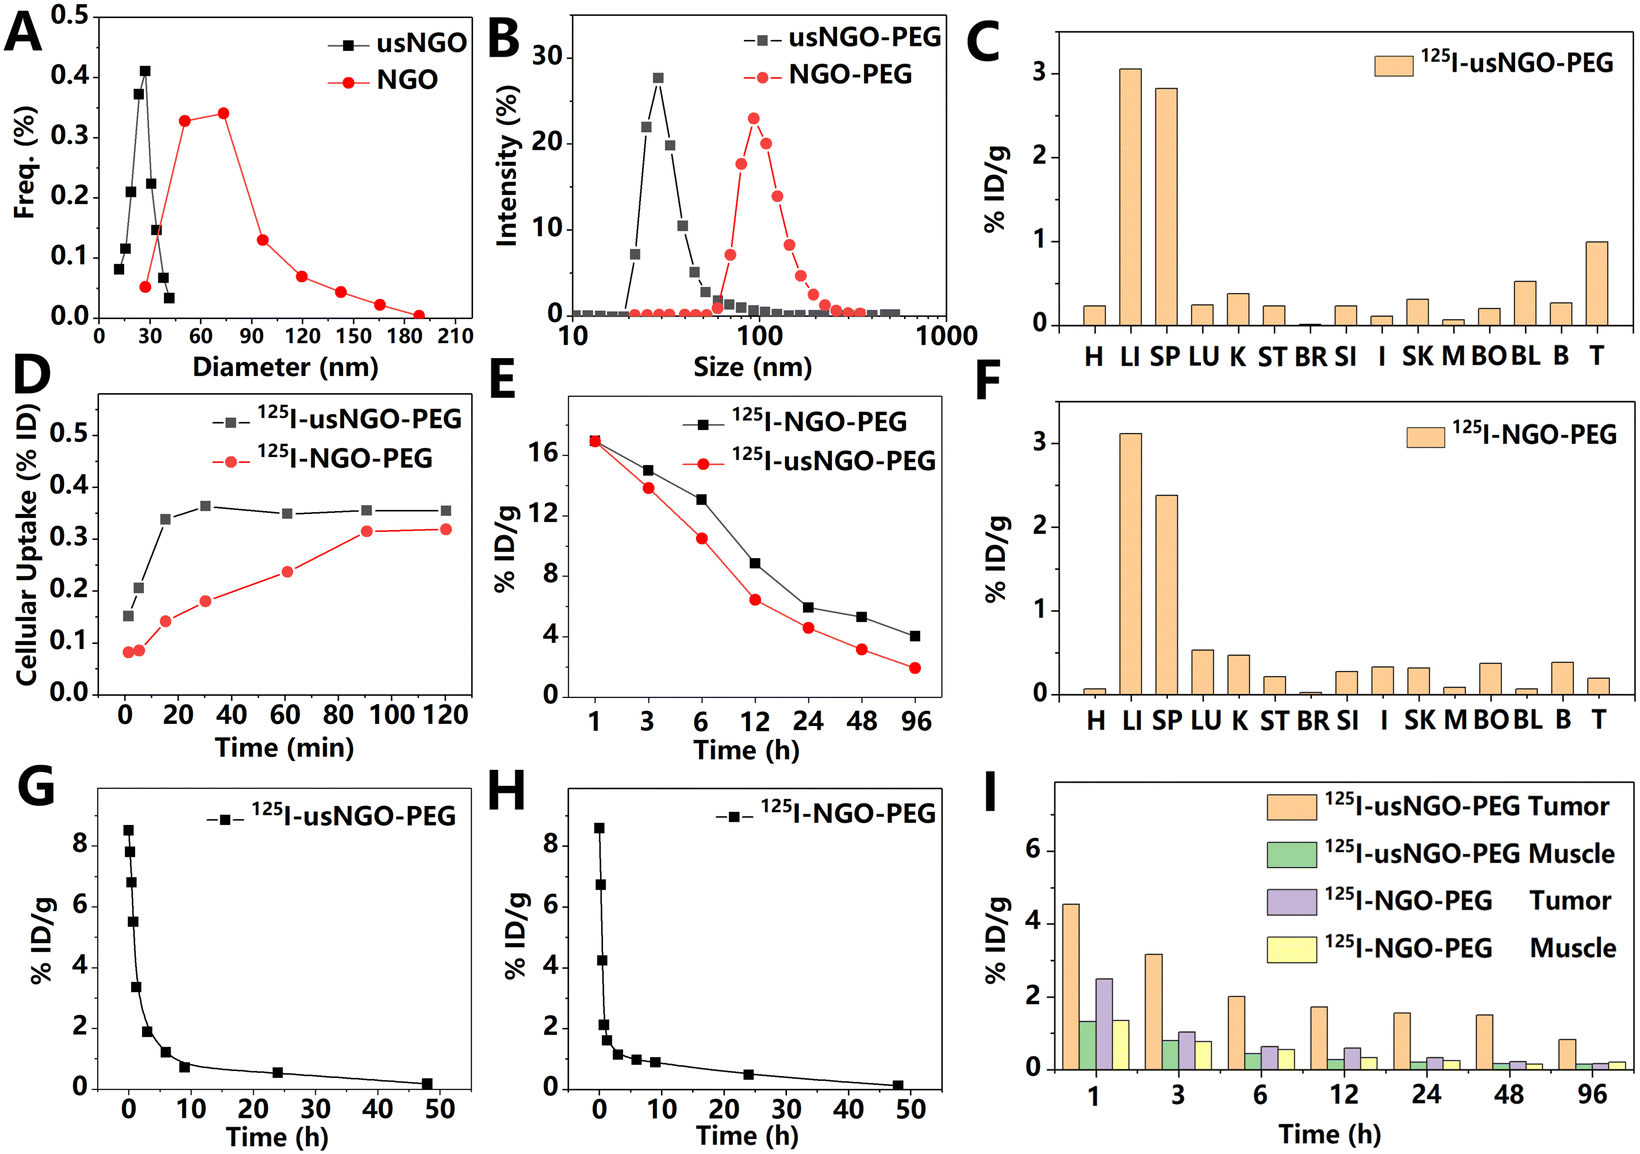 | ||
| Fig. 2 (A) Size distribution of nano GO with normal (NGO) or ultra-small size (usNGO), based on atomic force microscopy results. (B) Hydrodynamic diameters of NGO and usNGO, measured by dynamic light scattering. (C and F) Biodistribution of usNGO (C) and NGO (F) 48 h PI. H: heart; LI: liver; SP: spleen; LU: lungs; K: kidneys; ST: stomach; BR: brain; SI: small intestine; I: large intestine; SK: skin; M: muscle; BO: bone; BL: blood; BLA: bladder; and T: thyroid. (D) Cellular uptake of NGO and usNGO. (E) Whole-body time-activity curves of NGO and usNGO after intravenous (i.v.) injection. (G and H) The blood circulation curve of usNGO (G) and NGO (H). (I) 4T1 tumor and muscle uptake for NGO and usNGO. Quantitative data in cells and in vivo mouse model were determined by the radioactive signal of 125I-labeled materials. Adapted and modified with permission from ref. 11. Copyright (2016) Royal Society of Chemistry. | ||
Because size plays a key role in determining the absorption, uptake, and clearance of nanomaterials, the strategy of tunable size nanomaterial in the biological environment has been developed to enhance the therapeutic efficacy and safety profile. Accumulation at the target site and clearance after the treatment are two major factors that must be considered for highly efficient drug delivery. Unfortunately, these two aspects are sometimes contradictory. Because of excellent kidney metabolism, the residence time of ultra-small nanoparticles in vivo is too short for effective enrichment at the target site. One possible solution is to fabricate materials with a tunable size. Shao et al. exfoliated black phosphorus (BP) QDs with a size below 5 nm and modified it with PLGA.12 PLGA nanospheres loaded with BPQDs showed a suitable size of about 102.8 ± 35.7 nm and significantly prolonged the blood circulation time compared to bare BPQDs. Gradually, the PLGA coating degrades in vivo, and ultra-small BPQDs are exposed and eliminated from the body. Similarly, BPQDs encapsulated by exosomes also exhibit enhanced passive tumor targeting due to their increased size.13 Beyond natural biodegradation, nanomaterials can also be designed to respond to microenvironments in the human body, such that the size tunability is more flexible and rapid. To prolong retention in the tumor, Wang et al.14 designed self-assembled BP nanosheets that activate in an acidic microenvironment. In their study, polyoxometalates modified BP nanosheets exhibited a small size (∼205.4 nm) in the blood (pH = 7.4), while the size increased to 288 nm, which was triggered by an acidic microenvironment (pH ≈ 6.5) at the tumor site. After being endocytosed by tumor cells, the modified BP nanosheets self-assembled into micron-scale aggregates (835.3 nm) under the influence of the sharply decreased pH (pH = 5.5–3.0) of the intracellular compartment. The cellular uptake experiments confirmed that the modified BP nanosheets exhibit strong aggregation in cancer cells. The in vivo experiments demonstrated that the modification of polyoxometalate was helpful for the retention of BP nanosheets at tumor sites, indicating the great potential of microenvironment-activated self-assembly in tumor treatment.
2.2 Surface modification
Due to the large surface area of 2D materials, ions and proteins in the physiological environment are easily adsorbed on the material surface, causing agglomeration and coverage of the conjugated targeting ligands, which are designed to specifically target diseased areas.15 In most research, surface modification is necessary to alleviate this problem. After modification, 2D materials exhibited extended blood circulation time, enhanced macrophage escape, improved targeting ability, and controllable stability.16 Most modifications enhanced the biocompatibility and dispersibility of 2D materials under physiological conditions. PEG, polydopamine, cell membrane, and peptides are the most commonly used modification strategies for 2D materials. For example, after incubation in phosphate buffered saline (PBS), serum, or cell culture medium for 24 h, bare Sb nanosheets completely precipitated, while PEG-coated Sb nanosheets remained stable.17 For easily degradable 2D materials, modification can also help control the degradation rate. Zeng et al.18 coated polydopamine on the surface of BP nanosheets to improve their stability by the polymerization effect of dopamine under weak alkaline conditions. After being stored in water for 3 days, the photothermal performance (the temperature increase induced by the photothermal effect of BP) of the modified BP and bare BP attenuated by 2.8 °C and 5.4 °C, respectively. The polydopamine coating reduced the contact of BP nanosheets with oxygen, thereby slowing down the degradation rate. In another study, Sun et al.19 used the electrophilic titanium ligand (TiL4) to deprive BP of its lone pair of electrons to reduce the reaction between BP and oxygen, as shown in Fig. 3A. This was demonstrated by measuring the UV-vis absorption of the materials. After exposure to air for 10 days, the absorption of pure BPQDs was dramatically reduced by 43%, while that of the TiL4 modified BPQDs was only reduced by 10%. In addition, the modified BPQDs showed significantly improved dispersion in the cell culture medium. Furthermore, TiL4 also changed the surface potential of BPQDs. The potentials of BPQDs before and after modification were −36.5 ± 1.1 and +21.1 ± 2.56 mV, respectively. The positive potential of BPQDs may be beneficial to the cellular uptake of tumor cells due to the negative surface potential of cell membrane. The maximum photoacoustic (PA) signal in the tumor site was detected at 4 h after tail vein injection of TiL4-coated BPQDs, and the PA signal returned to a low level at 48 h after the injection, indicating the rapid clearance.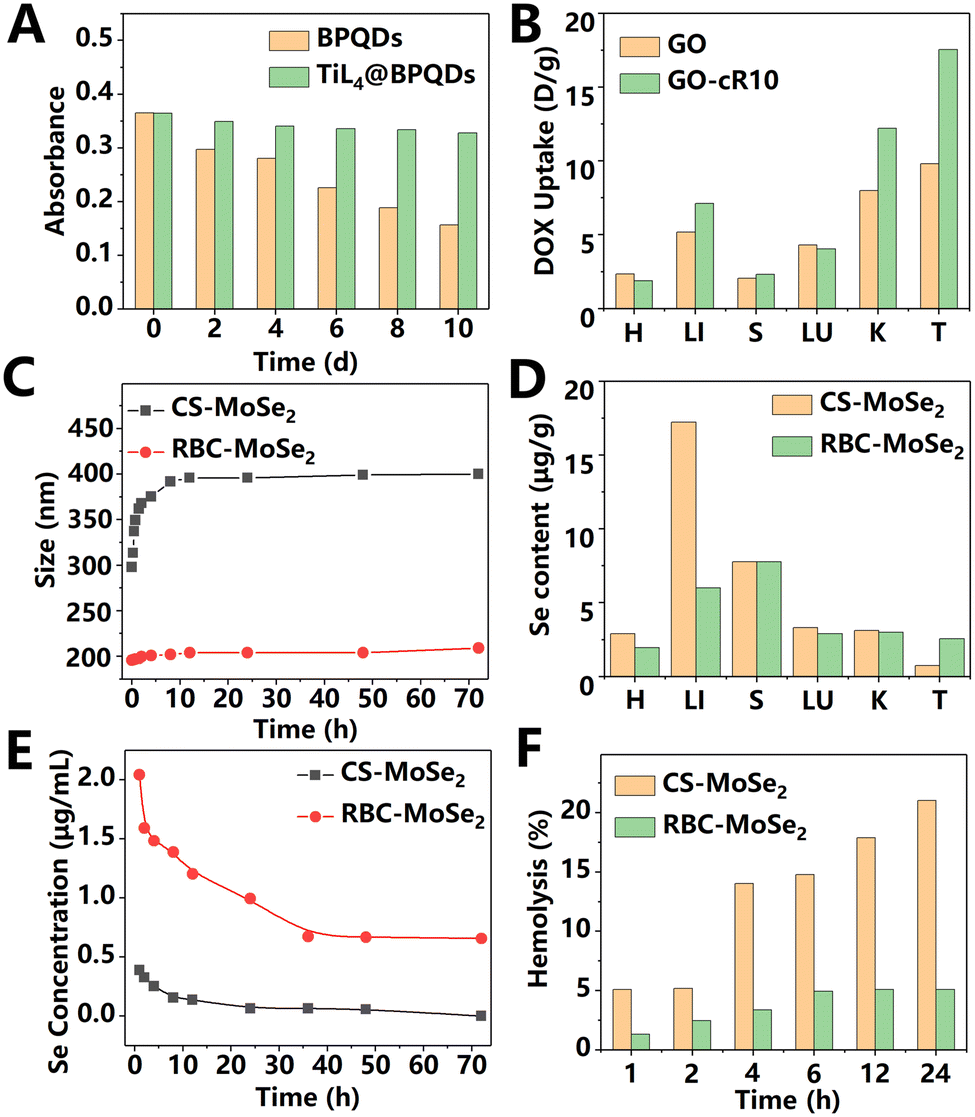 | ||
| Fig. 3 (A) Change in the absorption intensity of BPQDs and TiL4 @ BPQDs in water. Test wavelength is 450 nm. Adapted and modified with permission from ref. 19. Copyright (2017) Wiley-VCH Verlag GmbH & Co. KGaA, Weinheim. (B) Quantitative biodistribution of DOX in mice at 24 h post i.v. administration of GO or Cyclic R10 Peptide-modified GO (GO-cR10). Due to the nuclear targeting of Cyclic R10 Peptide, GO could release drugs in the nucleus under irradiation and avoid the “efflux pump” on the plasma membrane. H: heart; LI: liver; S: spleen; LU: lung; K: kidneys; and T: tumor. Adapted and modified with permission from ref.22 Copyright (2020) Wiley-VCH Verlag GmbH & Co. KGaA, Weinheim. (C) Time-dependent size of CS-MoSe2 or RBC-MoSe2 nanosheets (20 μg mL−1) dispersed in serum. (D) Biodistribution of MoSe2 modified with red blood cell (RBC) membrane or chitosan (CS). (E): Time-dependent selenium content in mouse plasma after i.v. injection of CS-MoSe2 or RBC-MoSe2. (F) Hemolysis caused by CS-MoSe2 or RBC-MoSe2 at a concentration of 20 μg mL−1. Adapted and modified with permission from ref. 20 Copyright (2019) Wiley-VCH Verlag GmbH & Co. KGaA, Weinheim. | ||
Phagocytes may trap nanosheets and cause negative effects, such as decreased therapeutic efficiency and inflammation. In recent years, researchers found that cell membrane coating can effectively protect nanomaterials from being cleared by phagocytes. A variety of biofilms have been used to coat nanosheets and significantly improve the blood circulation time of materials. In 2019, He et al.20 designed MoSe2 nanosheets encapsulated with red blood cell membranes for photothermal-triggered cancer immunotherapy, as shown in Fig. 3C–F. After modification, the uptake of MoSe2 nanosheets by macrophages was significantly reduced, which was related to the interaction between the self-marker and protein-alpha receptor on the surface of the red blood cell membrane. Compared with the control group, modified MoSe2 nanosheets showed a very low hemolysis rate (less than 5%) and negligible protein corona, indicating a significantly improved blood compatibility. According to the results of biodistribution analysis, membrane modification helped nanosheets to escape the capture of macrophages in the liver and therefore improved accumulation of the MoSe2 nanosheets at the tumor site. Due to the presence of red blood cell membranes, MoSe2 nanosheets exhibited a drastically reduced blood clearance rate (the modified group: 0.1 μg ((μg mL−1) h)−1vs. the unmodified group: 3.1 μg ((μg mL−1) h)−1 and significantly improved blood circulation half-life period (the modified group: 7.2 h vs. the unmodified group: 2.4 h). In addition to red blood cells, exosomes can also effectively improve the blood circulation time and tumor enrichment efficiency of 2D materials. Liu et al.13 prepared exosome-encapsulated BPQDs. The renal clearance rate of exosome-encapsulated BPQDs with a size of about 100 nm was significantly slower than that of bare BPQDs with a size of less than 5 nm. The fluorescence images at 24 and 48 h PI demonstrated that the biodistribution of the encapsulated BPQDs was similar to that of pure exosomes. After 48 h of administration, the strongest fluorescence signal intensity of encapsulated BPQDs was observed in the spleen. The lungs, liver, and tumor sites also showed evident signals of BPQDs, while the signal in the heart and kidneys was very weak. In the fluorescence image of frozen sections, the co-localization of exosomes and tumor cell nuclei demonstrated the effective penetration of exosome-encapsulated BPQDs in tumor tissues. Afterwards, the photothermal performance of this material was investigated on the first and seventh days PI. The temperature increase of bare BPQD treated group was similar to that of exosome-encapsulated BPQDs on the first day. However, on the seventh day, the encapsulated BPQDs could still exhibit effective photothermal effects at the tumor site; while the bare BPQD group showed significant photothermal degradation. This phenomenon indicates that exosomes could extend the accumulation life time of BPQDs at the tumor site.
Compared with normal tissues, the tumor microenvironment differs in numerous aspects, such as the pH value, glucose concentration, hydrogen peroxide (H2O2) content, and expression of glutathione. Therefore, modification strategies triggered by the tumor microenvironment have been proven to effectively regulate the in vivo behavior of 2D materials. Mei et al.21 anchored glucose oxidase on MoS2 nanosheets for glucose-based tumor catalytic therapy. The modification changed the surface potential of MoS2 nanosheets from −35 to +36 mV, which was conducive to the combination of nanosheets and negatively charged plasma membranes. The high content of glucose at the tumor site was catalyzed by glucose oxidase to H2O2, which was further converted to ˙OH by MoS2 nanosheets. The ˙OH could not only kill cancer cells but also accelerate the degradation of nanosheets. Hence, almost no Mo element was detected in the main organs of animals that received the intra-tumor injection, indicating the accelerated in vivo clearance of the modified MoS2 nanosheets. Although multiple targeting strategies have been developed to enhance the drug delivery capabilities of 2D materials, the “efflux pump” on the plasma membrane of cancer cells protected them from drugs. To solve this problem, Tu et al.22 modified the Cyclic R10 peptide on the surface of graphene and observed significantly enhanced cell internalization, as shown in Fig. 3B. Cyclic R10 peptide is a cell-penetrating peptide containing 10 arginine residues. Its cyclic structure effectively improves nuclear targeting ability. After modification, the efficiency of graphene entering HeLa-R cells was increased 10-fold. The in vivo fluorescence data of the labeled material showed that the modification significantly enhanced the enrichment of graphene in tumors and organs, which may be related to enhanced cell internalization. In addition, the content of the modified graphene accumulated in the tumor site was significantly higher than that in other organs, such as the liver, kidneys, and lungs. Impressively, compared to pure drug, the graphene drug delivery platform showed negligible toxicity on important indicators, including weight loss and cardiotoxicity.
2.3 Composite materials
In vivo behavior of materials is related to the materials’ elemental composition and density.23 A heterojunction is one of the most common approaches to change the composition of materials. Heterojunction material can synergize the advantages of each component and avoid its own shortcomings to a certain extent. For example, carbon dot/WS2 heterojunctions were reported to have significantly enhanced passive targeting efficiency, great photothermal performance in the second near-infrared region, and physiological stability compared to a single component.24 At 24 h after the tail vein injection, the fluorescence signal intensity of the heterojunction material at the tumor site reached its maximum, which was significantly higher than that of normal organs. Using CT imaging, it was found that heterojunctions gathered at the tumor area, and the amount was significantly higher than pure WS2.25 This demonstrated that the heterojunction changed the biodistribution of materials. In addition, constructing heterojunctions is a common method to control the stability of 2D materials. Huang et al.26 fabricated Bi2O3/BP heterojunctions by growing Bi2O3 nanoparticles in situ on the surface of BP nanosheets. After being placed in water for 8 days, the Bi2O3/BP heterojunction dispersion did not change significantly. As a comparison, most pure BP was degraded in water, indicating the significantly enhanced stability of the heterojunction, as shown in Fig. 4. The increased stability prolonged the residence time in vivo. At 28 days after injection, the Bi element could still be detected in the liver and spleen. The enhanced stability raises the risk of potential long-term toxicity, but facilitates long-lasting therapeutic effects of BP nanosheets. Therefore, the Bi2O3/BP heterojunction and pure BP nanosheets can meet the needs of different diseases.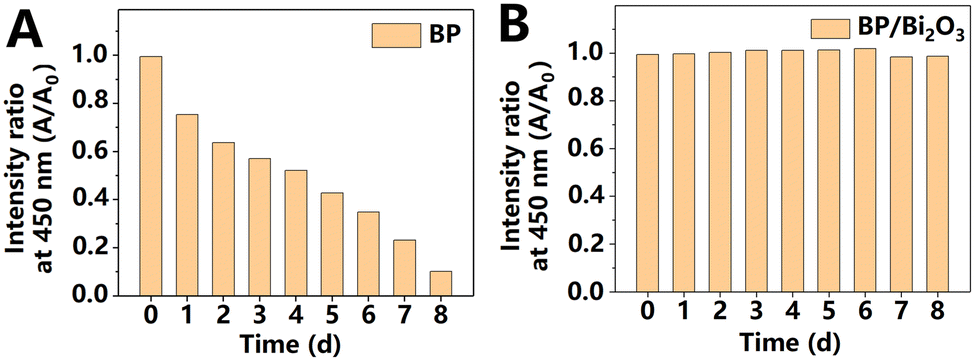 | ||
| Fig. 4 Variations in the absorption intensity ratio at 450 nm of BP (A) and BP/Bi2O3 heterostructures (B) after standing in water for different durations of time. Adapted and modified with permission from ref. 26 Copyright (2018) Elsevier. | ||
Another efficient approach to fabricate 2D composites is to design core–shell structures. For example, Tang et al.27 developed a dense gold shell outside the Ti3C2 nanosheet core (Ti3C2@Au) by a seed growth method. In this work, SH-PEG was modified on the Au shell through gold–thiol bonds, which prevented the coordination of Ti3C2 nanosheets with the polymers in the physiological environment. As a result, this composite exhibited better dispersion in the physiological environment than bare Ti3C2. After i.v. injection, the core–shell Ti3C2–Au composite showed a long blood circulation time and significantly enhanced tumor enrichment compared to bare Ti3C2.
In addition to heterojunction and core–shell structures, other 2D composites also exhibit different degradation and in vivo behaviors from each component. Liang et al.28 prepared rGO/BP hybrids, which possessed significantly enhanced stability in comparison with pure BP. The phosphorus–carbon covalent bond formed between rGO and BP pre-occupied the lone pair of electrons of BP and inhibited the oxidation of BP. The as-prepared hybrids were stable for over 30 days under ambient conditions. After encapsulation with PEG, the rGO/BP hybrids exhibited good dispersion in the physiological environment for four days without significant degradation and precipitation. Overall, these composite materials can not only improve the stability of easily degradable materials but also accelerate the biodegradation of stable materials. In another study, researchers designed composite materials based on the iron oxide nanoring and GO with a hydrodynamic size of ∼166.6 nm.29 Due to its attractive electrical and thermal conductivity, GO can improve the poor dielectric loss of magnetic particles and achieve enhanced magnetothermal performance. Furthermore, the significantly enhanced reactive oxygen species (ROS) production and immunological effects compared to those of pure iron oxide nanorings also indicate the advantages of this composite material in cancer magnetotherapy. Impressively, the analysis of the results of inductively coupled plasma mass spectrometry (ICP-MS) and magnetic resonance imaging (MRI) indicated that the material may degrade 48 h after i.v. injection. Elevated Fe content was found in the bile and urine of the treated mice, indicating that the degraded GO composite material is metabolized through the liver and kidneys. This result indicates that the construction of composites may improve the biodegradability of GO nanosheets, which is one of the main factors limiting the clinical application of GO. The MRI imaging data showed that the optimal time to apply a magnetic field was at 4 h after the administration, when the accumulation of the composite material at the tumor site reaches the maximum. By comparing the MRI signals of the liver, spleen, kidneys, gallbladder, and bladder of the mice treated with iron oxide nanoring and GO composite, researchers found that the liver and spleen accumulated GO composites the most. For the liver, spleen, and kidneys, the strongest material signal appeared at 8 h after administration. Compared with pure GO, the accumulation of the composite material in the heart and brain was significantly higher.1 Therefore, the composite material may have more potential than pure GO for the treatment of heart and brain diseases.
In general, numerous studies proved that heterojunctions and composite materials exhibit significant differences from the original components in terms of their biodistribution, degradation rates, and metabolic pathways in vivo. At present, in most designs of composite 2D materials, researchers are dedicated to improving the physical and chemical properties of materials, whereas the interaction between materials and organisms is often overlooked. To meet the clinical needs, more attention must be paid to the biological effects of materials.
2.4 External stimulus
2D materials show a sensitive response to external stimuli. Therefore, researchers can rationally control the fate of materials in vivo through multiple stimuli such as laser, ultrasound, and magnetism. For example, the local high temperature or the ROS induced by external stimuli can also significantly accelerate the degradation rates of some 2D materials, which has been applied on graphene oxide.30 In a recent study, Lee et al.30 designed a photo-switch strategy to generate oxidants, which induced the degradation and clearance of GO after treatment. In this system, the degradation of GO was accelerated by hypochlorous acid, which was catalyzed by the complex of specific single-stranded DNA (ssDNA) on the surface of GO with hemin. Before illumination, the ssDNA and its complementary strand formed a double-stranded DNA (dsDNA) without catalytic activity, which was corresponding to the OFF state. Under irradiation, the photothermal effect of GO melted the dsDNA into ssDNA, which then formed a complex with hemin with catalytic activity. Ultimately, the ssDNA-based complex produced hypochlorous acid and induced the degradation of the GO nanosheets. In this work, controllable biodegradation was achieved through the synergy of the photothermal effect of GO (key) and DNA double strands (lock). Meanwhile, physical stimulations can also enhance the permeability of blood vessels and increase the enrichment of materials in the lesion. As one example, upon exposure to the near-infrared region (NIR) light, 2D materials could significantly enhance the permeability of the BBB owing to the photothermal effect, which is of great significance in brain-related diseases. Xiong et al.31 found that, under NIR irradiation, the BP nanosheets’ penetration efficiency to an in vitro BBB model increased by a factor of two, as shown in Fig. 5A and B. Compared with the control group, the brains of mice that underwent the BP-based photothermal treatment showed significantly stronger blue staining in the Evans blue staining experiment, which proved that NIR light could evidently promote the brain delivery of the material. The fluorescence image showed that the nanosheets reached the brain 4 h after injection and achieved the peak at 6 h after injection. In addition, NIR irradiation also effectively prolonged the retention time of the material in the brain. Owing to the NIR-enhanced BBB penetration, 2D materials showed great application prospects in various brain diseases, including Parkinson's disease, Alzheimer's disease, and depression.32–34 Moreover, NIR induced permeability enhancement is also useful in tumor therapy. Tao et al.17 compared the penetration ability of DOX-loaded Sb nanosheets with and without irradiation. They found that light induced local heating of the cytomembrane increased membrane permeability and enhanced cell uptake of Sb nanosheets. Consequently, a strong DOX fluorescence signal was detected in the center of the tumor sphere treated with irradiation, while the DOX signal in the non-illuminated group was almost concentrated in the outer ring of the tumor sphere. Fu et al.35 found that the degradation rate of MoS2 was related to numerous factors, such as NIR irradiation, pH value, and H2O2 concentration. The MoS2 dispersions changed from grayish black to colorless after 10 days of NIR irradiation (5 min of irradiation every 2 days, 1.0 W cm−2), indicating the accelerated degradation rate. The researchers also compared the degradation of MoS2 in the simulated body fluid (pH = 7.4), tumor microenvironment (pH = 6.0), and lysosomal fluid conditions (pH = 4.5). Under the condition of pH = 4.5, MoS2 showed the fastest degradation. The presence of H2O2 could further shorten the time required for MoS2 degradation. In the group with the fastest degradation rate (H2O2 + NIR, pH = 4.5), the size of MoS2 decreased from 100–200 nm to 20–60 nm within 5 days, and it completely disintegrated into 5 nm particles within 10 days. This study thus shows that by regulating irradiation, 2D materials can be rapidly biodegraded under lysosomal fluid conditions.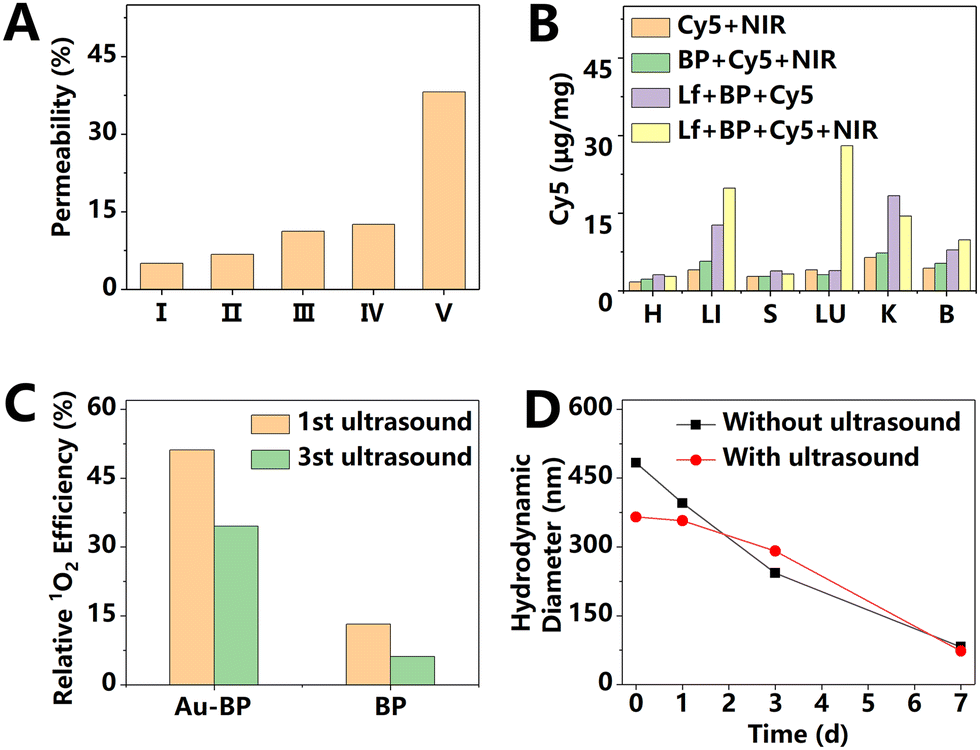 | ||
| Fig. 5 (A) Permeability of in vitro BBB to BP. I: Cy5, the fluorescent label; II: BP + Cy5; III: BP + Cy5 + NIR; IV: Lf + BP + Cy5; and V: Lf + BP + Cy5 + NIR. Lf represents brain-targeting ligand lactoferrin. (B) Biodistribution of BP in vivo with or without irradiation on brain site. H: heart; LI: liver; S: spleen; LU: lungs; K: kidneys; and B: brain. Adapted and modified with permission from ref.31. Copyright (2020) Elsevier. (C) Relative 1O2 efficiency of BP and Au–BP under first and third ultrasonic treatment (1 W cm−2, 3 min). Concentration of BP is 1 μg mL−1. (D) Hydrodynamic diameter of Au–BP with or without ultrasonic treatment (1 W cm−2, 3 min) at different time points. Adapted and modified with permission from ref. 37 Copyright (2021) American Chemical Society. | ||
Although the 2D materials triggered by NIR light exhibited numerous unique advantages, their penetration depth limits clinical application. To solve this problem, researchers made use of ultrasound as an external stimulus, as it reaches deep tissues. Dai et al.36 loaded TiO2 on the surface of reduced graphene oxide (rGO) nanosheets for enhanced sonodynamic therapy. Owing to the great electrical conductivity and 2D planar π-conjugated structure of rGO, the excited electrons of TiO2 can be transferred from the conduction band to rGO through a percolation mechanism. As a result, charge recombination was inhibited, enhancing generation of ultrasound-induced ROS. The biodistribution studies indicated that nearly 10% of the material accumulated at the tumor site. The blood circulation half-life of this GO composite was measured to be 0.8 h, and the elimination rate constant at 2 h after injection was −0.014 μg mL−1 h−1. After treatment, the tumor inhibition rate of the experimental group reached nearly 78%, indicating the excellent anti-cancer effect of sonodynamic therapy based on 2D materials. In another study,37 Chen et al. used Au-modified BP nanosheets as sonodynamic agents for breast cancer therapy. They found that the sonodynamic performance of BP was significantly decreased after three sonications, indicating ultrasound-induced degradation of BP, as shown in Fig. 5C. Although the Au-modified BP showed improved stability, its diameter decreased within 3 days under sonication treatment compared with the control group, as shown in Fig. 5D. During this process, the rapid degradation of BP may be attributed to the defects on the surface oxidized by the sonication-induced ROS. This ultrasound-controlled biodegradation effectively avoids the potential toxicity caused by the long-term retention of 2D materials in vivo, while ensuring the therapeutic effect.
In summary, various strategies have been used to control the fate of 2D materials in vivo, and several developments have been made. Notably, the optimal design differs for different 2D materials. Therefore, to achieve efficient and safe drug delivery, the in vivo behavior of each specific 2D material must be carefully studied, which we review in Section 3.
3. The in vivo fate of various 2D materials
In the past 10 years, 2D materials have expanded past graphene to form a large family. Owing to their planar structures, 2D materials exhibit large specific surface areas and flexible morphological changes. Furthermore, 2D materials with different compositions possess unique properties, such as the surface functional groups of graphene oxide and the lone pair electrons of black phosphorus. Due to different properties, these materials have different in vivo fates when administered to physiological environments. In this section, we introduce several classes of 2D materials with broad biomedical applications. First, graphene derivatives and other monoelemental 2D materials (Xenes) are discussed. Then, MXenes with multi-element components are introduced. Finally, TMDs, a class of multi-element 2D materials with complex crystal phases, are reviewed. Although some properties have not been fully explored, we believe that these 2D materials have exhibited unique advantages in biological applications.3.1 Graphene derivatives
Graphene and its derivatives have attracted widespread attention in the field of biomedicine owing to their attractive drug loading capacity and sensitive external stimulation response. However, their long-term fate in vivo remains a concern when faced with the clinical translation of these materials. Fluorescence imaging is one of the most commonly used methods to track GO's behavior in vivo. However, the intrinsic limitations of fluorescence imaging, including non-quantitative results and background fluorescence, significantly limit the accuracy of this method. To solve this problem, Yang et al.1 used a radiolabeling method to monitor the pharmacokinetics and long-term biodistribution of PEGylated small-size GO (10–30 nm), as shown in Fig. 6B–F. As a prerequisite of effective tracking, 125I-labeled GO exhibited stable radiolabeling in mouse plasma at 37 °C for over 15 days. The pharmacokinetics of GO followed the two-compartment model, which divides the body into two parts: the central compartment with fast material exchange (e.g., blood, heart, and liver) and the peripheral compartment with slow material exchange (e.g., muscle, bone, and fat).38 According to the two-compartment model, the blood circulation of GO was divided into a rapidly distributed component and a significantly slower elimination component: the half-lives of the blood circulation in the first and second phases were 0.39 ± 0.097 and 6.97 ± 0.62 h, respectively. At 1 h PI, GO was distributed across different organs of the mice. Strong signals were observed in the bone at the early time points PI, which may be due to macrophage uptake of GO into the bone marrow. Similar to other nanomaterials, the radiation signal was mainly concentrated in the MPS, such as the liver and spleen. Combining the results of tissue sections and gamma counters, researchers found that GO in the liver significantly decreased over time. This may be attributed to the enzymatic and photo-Fenton degradation of graphene, as reported in previous studies (Fig. 6A).39 However, a small amount of GO can still be detected in the liver after 20 days. This study also found that GO accumulated in the kidneys and intestine, indicating possible excretion, which was confirmed by the high radioactivity in the feces and urine of the experimental animals. This study indicates that GO nanosheets are distributed throughout the body after administration and retained in the spleen for a long time. The concern about the long-term toxicity of GO nanosheets is thus reasonable.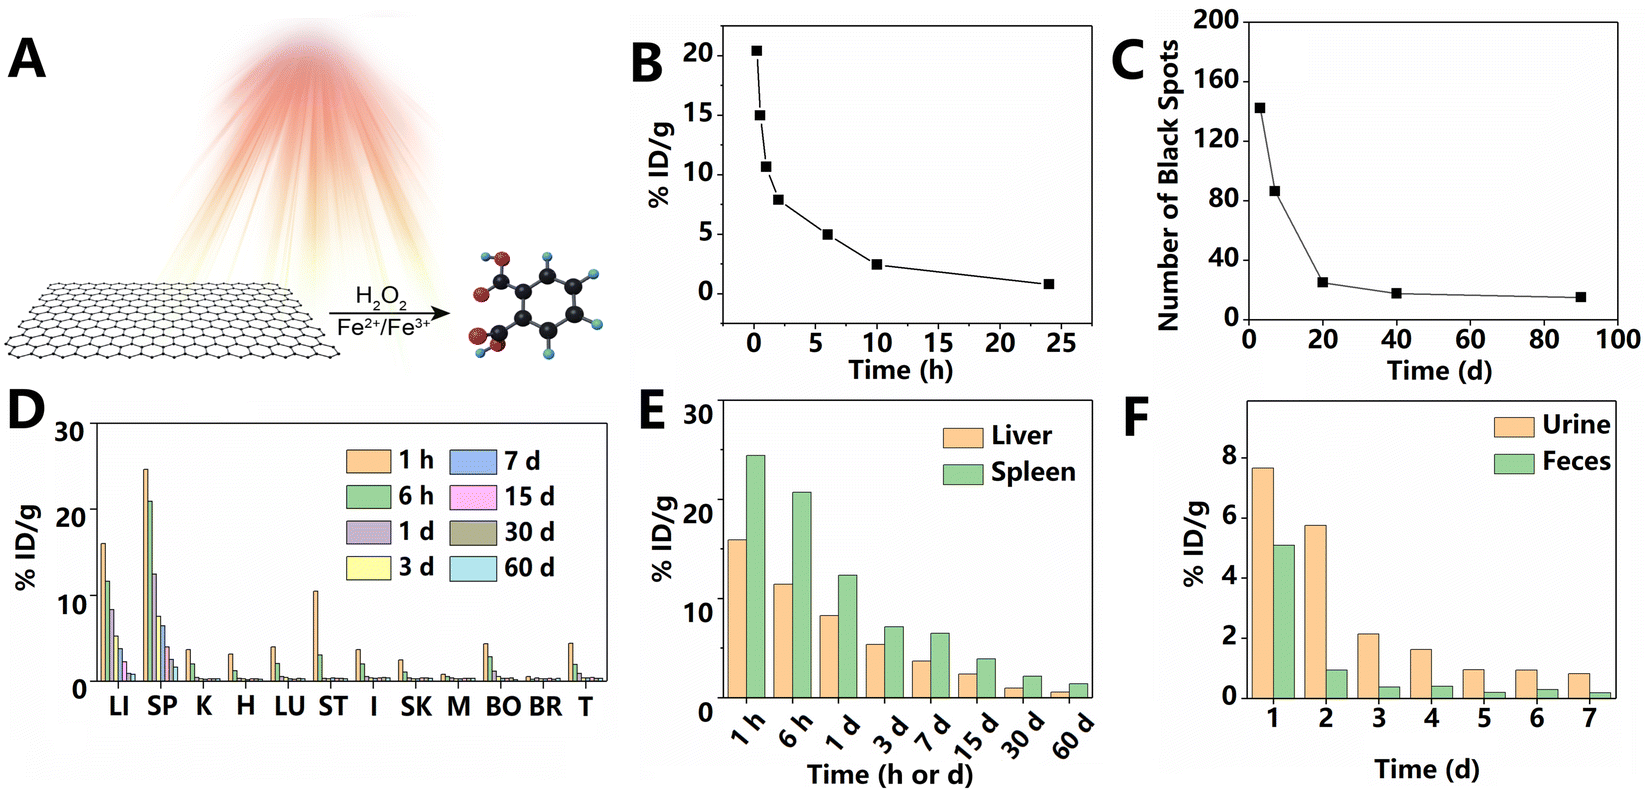 | ||
| Fig. 6 (A) GO degradation mechanism based on the photo-Fenton reaction. Degradation products may be oxidized polycyclic aromatic hydrocarbons. Adapted and modified with permission from ref. 39 Copyright (2014) American Chemical Society. (B) Blood circulation curve of GO. (C) Number of black spots found in liver sections at different time points PI with GO. Black spots represent the accumulated GO. (D) Time-dependent biodistribution of GO. LI: liver; SP: spleen; K: kidney; H: heart; LU: lungs; ST: stomach; I: intestine; SK: skin; M: muscle; BO: bone; BR: brain; and T: thyroid. (E) GO signal in the liver and spleen at different time points PI. (F) GO signal in urine and feces at different time points PI. Adapted and modified with permission from ref. 1 Copyright (2011) American Chemical Society. | ||
A similar animal study was performed using a direct bladder puncture method. Approximately 50–60% of GO were excreted in the urine 2 h after injection.7 Neither significant changes in kidney function nor structural damage to the glomerular and tubular regions was found after injection of well-dispersed GO nanosheets. Even when exposed to a dose that was significantly higher than the therapeutic one, the endothelial and podocyte cell cultures could regain their barrier function. Notably, although the size of most GO nanosheets is larger than the pore size in the kidneys, numerous studies demonstrated that GO could pass through these pores by rolling, crumpling, or folding, as shown in Fig. 7.7 Consequently, thin graphene with high mechanical flexibility is easily discharged from the body. Although most GO nanosheets are excreted in the urine, a small but significant part remains isolated in the spleen (∼1.6% ID g−1 at 60 days after i.v. injection).1 After injection, GO was found to accumulate in the marginal zone macrophages of the spleen of the mouse.6 Although the quantity of GO nanosheets in the spleen decreases rapidly over time, a small amount could only be removed from the body by slow degradation, and this process took over 270 days.6 Compared to the first day PI, the mouse spleen showed an increased Raman peak corresponding to the GO defect on the seventh day, which corresponds to the first stage of the amorphous trajectory of carbon. Throughout the amorphous trajectory, the structure of GO would transform from a sp2-hybridized carbon structure to a mainly tetrahedral sp3 amorphous carbon phase. While in the first stage, the GO components accumulate defects and the size of the internal sp2-hybridized crystal domain decreases, from the 7th to the 14th day, the defect signal increased slowly, which may be attributed to the presence of initially degraded debris’ physisorption on the surface of GO. This debris protected the GO nanosheets and extended the time required for biodegradation. Subsequently, the spleen-residing GO entered the second stage, at which a large number of amorphous carbon structures were produced. At 270 days after injection, the characteristic Raman peak of GO was almost undetectable, indicating that most of GO was degraded. Over time, the GO in the spleen cells also showed a changed morphology under TEM with more defects and weaker electron diffraction intensity. It was speculated that GO within the spleen would slowly accumulate defects, eventually leading to a complete loss of the planar structure. Notably, the GO nanosheets incubated in vitro without light at 37 °C did not show similar structural changes, indicating that the physiological environment of the spleen played a key role in the GO degradation process. The above studies showed that the degradation process of GO in the body lasts over a duration of 270 days. Such a comprehensive study of the biodistribution and clearance of GO in the body is essential to assess its long-term potential toxicity.
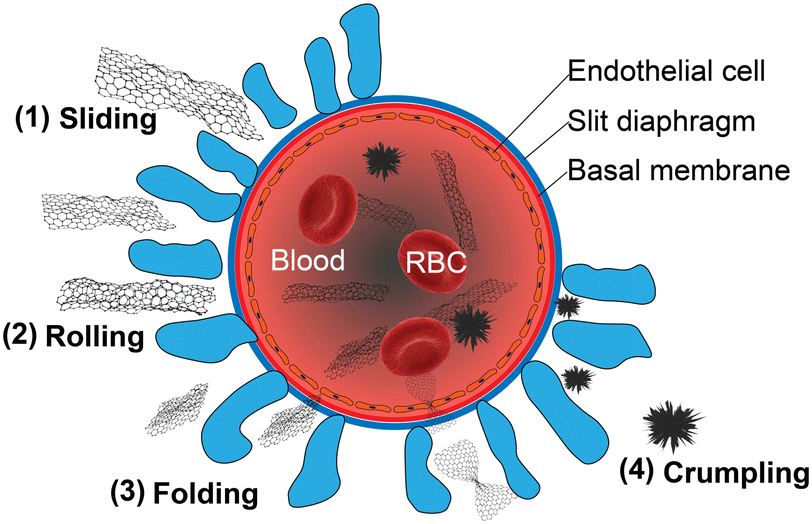 | ||
| Fig. 7 Schematic diagram of GO nanosheets passing through the glomerular filtration barrier. During this process, morphological reconfiguration of nanosheets may happen, including sliding, squeezing, rolling, or folding. Adapted and modified with permission from ref. 7 Copyright (2016) American Chemical Society. | ||
Although numerous studies have been conducted on the in vivo behavior of graphene, a label-free and quantitative method to detect graphene is in great demand. In 2015, Chen et al.40 used mass spectrometry imaging to show the distribution of GO in vivo with a sensitivity of 0.04 μg mL−1 and compared it with carbon nanotubes and carbon nanodots. Carbon nanomaterials including carbon tubes, carbon dots, and GO produced anionic carbon clusters under ultraviolet laser irradiation in the mass spectrometer. These anionic carbon clusters, including C2−, C3−, C4−, C5−, C6−, C7−, C8−, C9−, and C10−, could be used as a fingerprint to distinguish carbon nanomaterials from tissues. Compared with carbon tubes and carbon dots, GO accumulated less in kidney tissues due to high GO concentrations in the lungs. Using this novel detection method, researchers expect to obtain a deeper understanding of the in vivo fate of 2D materials.
In addition to GO, the behavior of rGO in vivo likewise received significant attention from researchers in recent years. Syama et al.41 used Raman spectroscopy to study the distribution and metabolism of rGO administered intraperitoneally and intravenously. rGO was widely distributed in major organs such as brain, liver, kidneys, spleen, and bone marrow following injection. In both injection methods, the signal of rGO in the blood reached the maximum at 3 h PI, and became very weak after 7 days. After i.v. and intraperitoneal injection, rGO was effectively absorbed from the systemic circulation and was phagocytosed by the macrophages present in the MPS. In contrast to the rapid systemic distribution after i.v. injection, the nanoparticles administered intraperitoneally were gradually absorbed from the abdominal cavity, and then slowly transferred to various organs, as shown in Fig. 8. Furthermore, after intraperitoneal injection, long-term retention of rGO was found in the abdominal cavity. Notably, unlike other studies on GO, in this study, the experimental results showed that only a small amount of rGO was excreted through urine. The biliary system may be the main excretion route of rGO. Due to the long-term retention of rGO in vivo, it is necessary to carefully evaluate the side effects of rGO before clinical application.
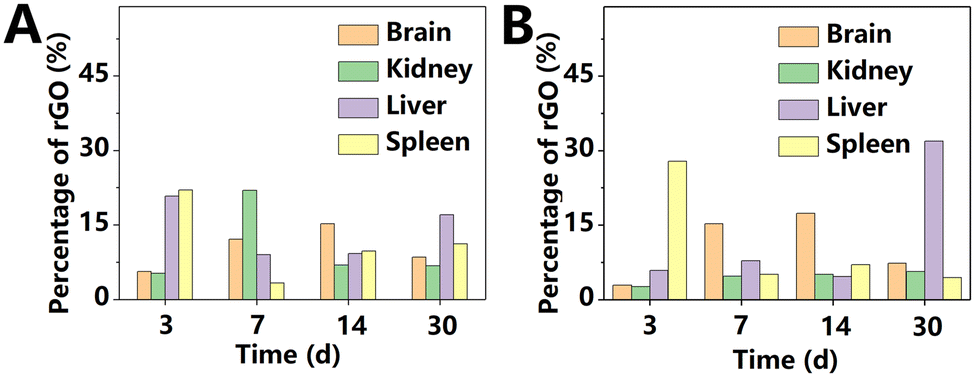 | ||
| Fig. 8 Percentage of rGO in the Raman chemical map of different tissues in mice, injected intravenously (A) or intraperitoneally (B). Adapted and modified with permission from ref. 41 Copyright (2017) Elsevier. | ||
3.2 Monoelemental materials (Xenes)
As a relatively novel category in the 2D materials family, Xenes have been developing rapidly in recent years. The simple element composition is accompanied by a simple metabolism and degradation mechanism, which is highly promising to clinical applications. Different elemental compositions endow Xenes with unique biological advantages. For example, phosphorus is an osteogenic element, and arsenic is suitable for the treatment of acute promyelocytic leukemia.4,42 Most Xenes are believed to be biodegradable; however, the degradation mechanism is not understood to date. Generally, the biodistribution of Xenes is similar to that of other 2D materials. The liver, lungs, kidneys, and tumor sites are the most commonly accumulated sites in vivo. Compared with the well-studied graphene nanosheets, there is limited study on the long-term fate of Xenes in vivo. In this section, the latest research on the in vivo fate of different types of Xenes is introduced.![[thin space (1/6-em)]](https://www.rsc.org/images/entities/char_2009.gif) h PI. In contrast, the BP nanosheets in the liver, spleen, and lungs decreased rapidly at 3 h PI, which may be attributed to the oxidation of the BP nanosheets by the oxygen which is present in a high level in these organs.8 Notably, the signal of BP nanosheets in the blood increased over time from 1 to 42 h, which may be related to the reversible uptake of BP. The authors believed that the large-sized BP nanosheets would oxidize, degrade, reduce their size, and re-enter the blood circulation after being swallowed by the MPS-rich organs. The strong radioactive signals from the kidneys and urine indicated that BP nanosheets were likely to be excreted in urine.
h PI. In contrast, the BP nanosheets in the liver, spleen, and lungs decreased rapidly at 3 h PI, which may be attributed to the oxidation of the BP nanosheets by the oxygen which is present in a high level in these organs.8 Notably, the signal of BP nanosheets in the blood increased over time from 1 to 42 h, which may be related to the reversible uptake of BP. The authors believed that the large-sized BP nanosheets would oxidize, degrade, reduce their size, and re-enter the blood circulation after being swallowed by the MPS-rich organs. The strong radioactive signals from the kidneys and urine indicated that BP nanosheets were likely to be excreted in urine.
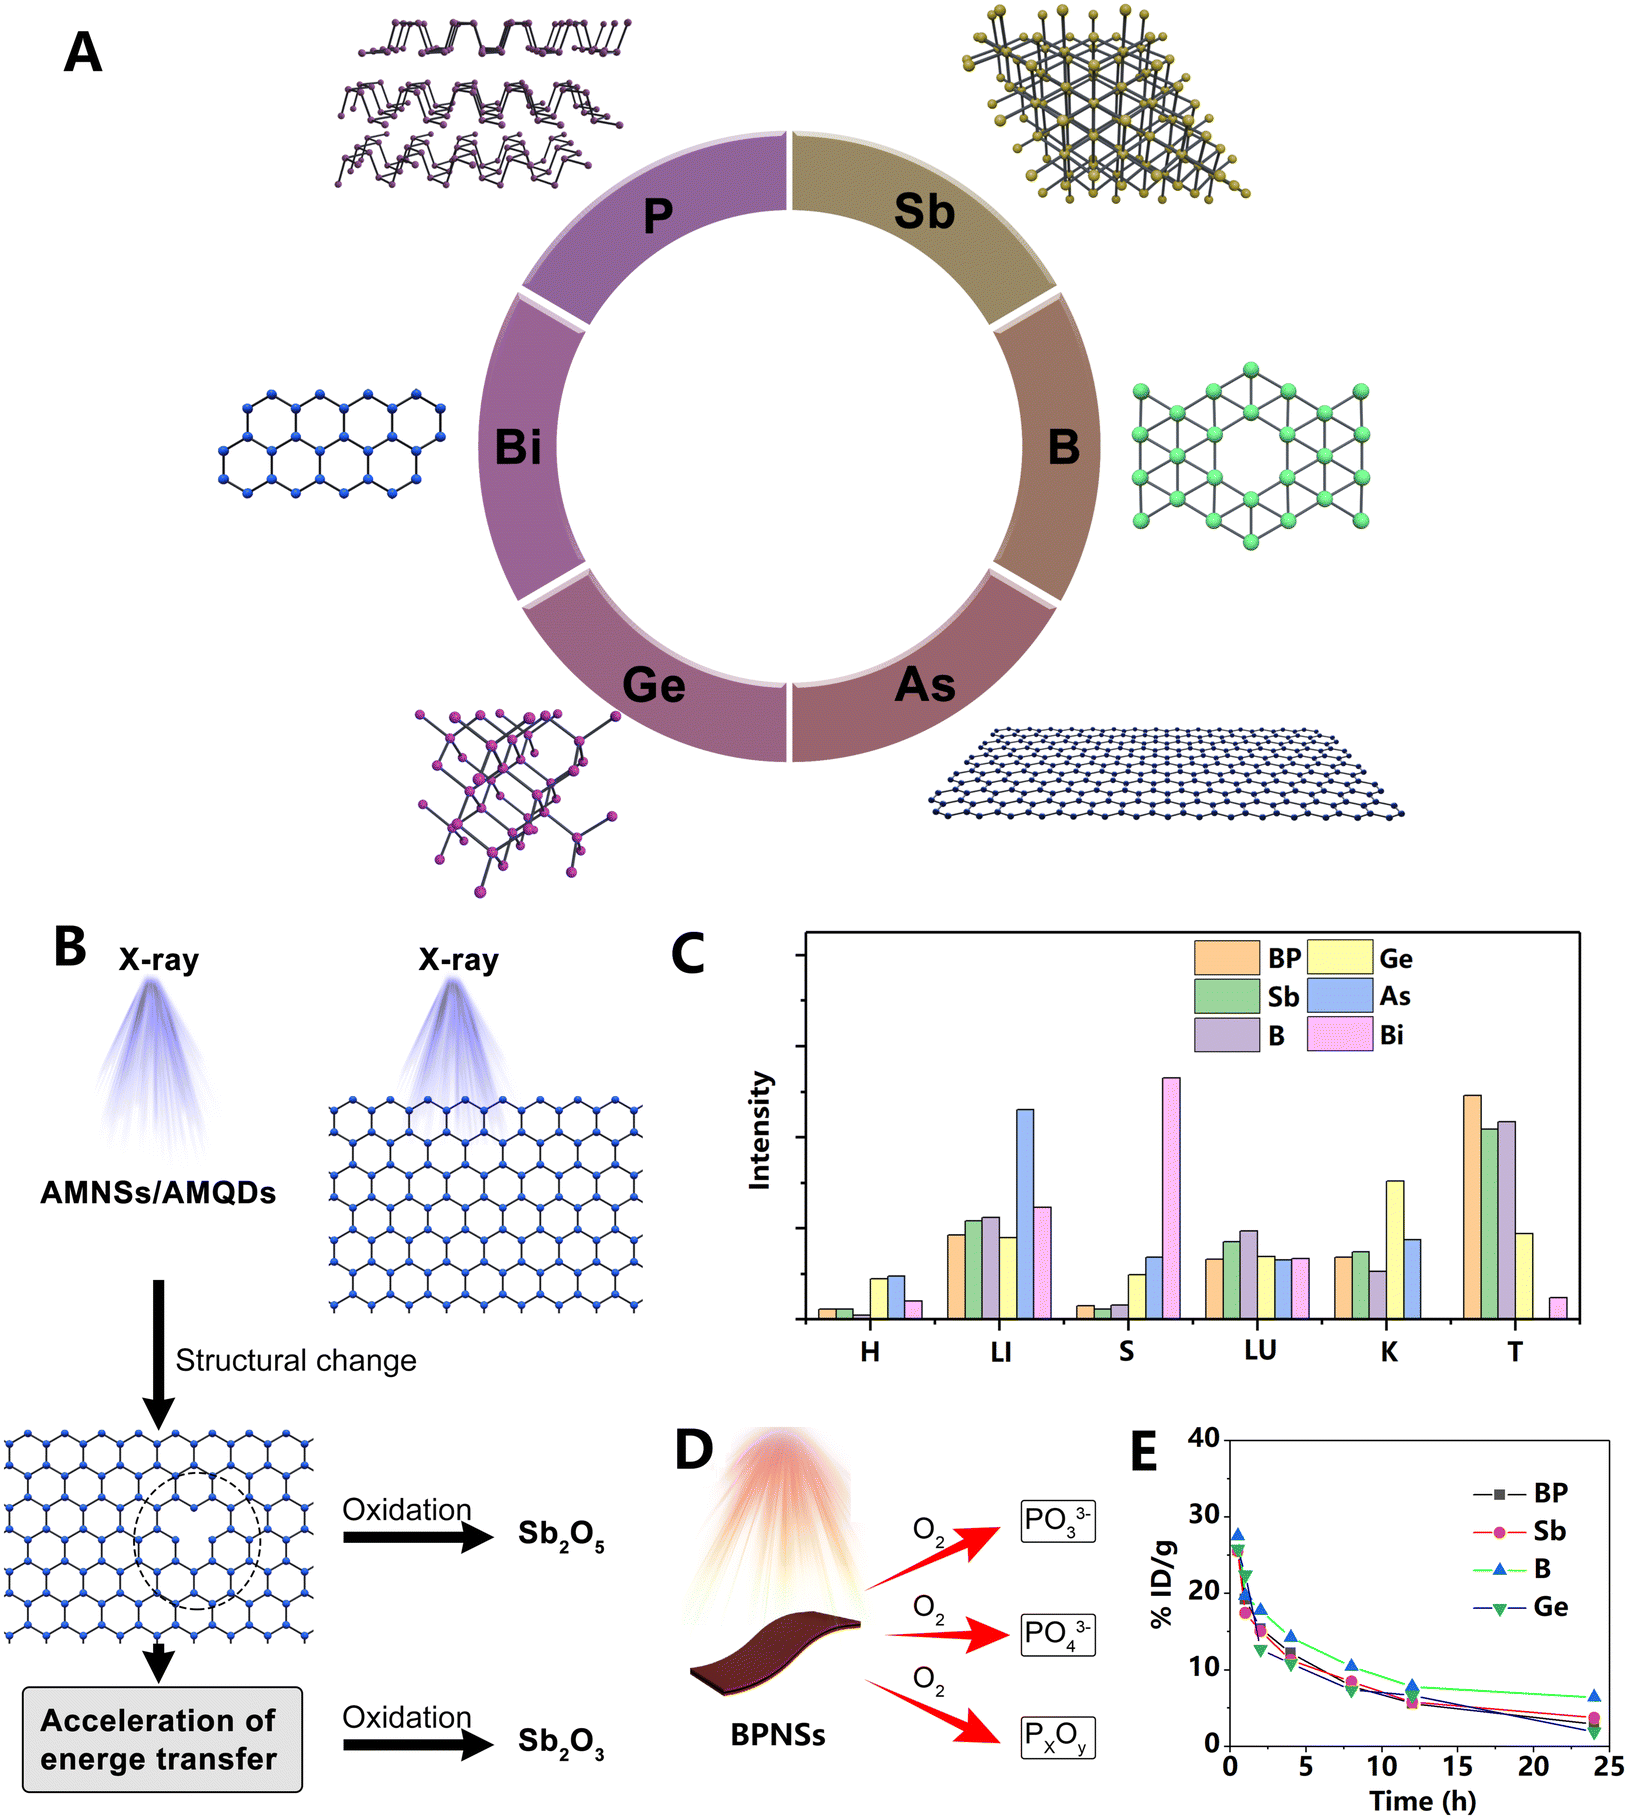 | ||
| Fig. 9 (A) Structure of Xenes discussed in this section. (B) Schematic illustration of oxidation of Sb nanosheets under X-ray irradiation. Adapted and modified with permission from ref. 2 Copyright (2019) Wiley-VCH Verlag GmbH & Co. KGaA, Weinheim. (C) Biodistribution of various Xenes. To facilitate comparison of the relative tissue distribution of each material, the data were normalized. H: heart; LI: liver; S: spleen; LU: lungs; K: kidneys; and T: tumor. (D) Oxidation products of BP nanosheets. Irradiation can accelerate the oxidation process. (E) Blood circulation curve of various Xenes. Adapted and modified with permission from ref. 17, 42, 43, 51, 52 and 54 Copyright Wiley-VCH Verlag GmbH & Co. KGaA, Weinheim and Elsevier. | ||
Phosphate anions, the degradation product of BP, are abundantly present in the human body and are biocompatible. However, the sharp rise of cytosolic phosphate anions may cause some side effects, such as affecting cellular ATP hydrolysis and inducing programmed cell death. Interestingly, Zhou et al.46 found that this toxicity could selectively target cancer cells, which exhibit significantly faster oxidative stress and energy metabolism compared to normal cells. Their results indicate that the sharply elevated phosphate anions induced cancer cell G2/M phase arrest, subsequent apoptosis, and autophagy-mediated cell death. The IC50 values of BP nanosheets on cancer cells were as low as 2 μgmL−1, while normal cells showed over 80% survival rate under treatment with a higher concentration of BP (4 μgmL−1). Very recently, another excellent study also observed the selective killing of cancer cells by BP nanosheets themselves.47 In this study, BP nanosheets were found to fragment mitotic centrosomes by deactivating the centrosome kinase PLK1. Consequently, the mitotic progression of cancer cells was delayed, and eventually apoptosis occurred. Notably, a variety of phosphorus-based nanomaterials exhibited the mitotic block effect, while the degradation products of BP nanosheets did not show this performance. Despite the exciting results of these studies, their data are inconsistent with those of some others.3,48 The biological effects of BP nanosheets are complex and can be affected by numerous factors, which may lead to inconsistencies. Further careful investigation of the interaction between BP and the biological milieu is necessary.
3.3 MXenes
MXenes are a 2D material family that is composed of transition metal carbides, nitrides or carbonitrides, and it contains more than 70 members. Usually, MXenes are prepared by selective etching using their precursor MAX, where M, A, and X are early transition metals, elements of group IIIA or IVA and C or N, as shown in Fig. 10A.60 The MXenes that are prepared in this way often have functional groups on their surface, which is conducive to surface modification and drug loading.As the first prepared MXene, titanium carbide (Ti3C2) has been applied to various fields, including biomedicine. Because of the strong absorption in NIR, Ti3C2 nanosheets are a potential photothermal agent. However, the size of Ti3C2 nanosheets obtained by traditional methods is relatively large, which is not suitable for biological applications. To solve this problem, Lin et al.55 prolonged the HF etching time to prepare Ti3C2 nanosheets with a size of ∼150 nm. After sealing, Ti3C2 nanosheets could be uniformly dispersed in water for several weeks, indicating good dispersibility and stability. Ti3C2 nanosheets exhibited excellent photothermal stability under five laser on/off cycles. The blood circulation half-life of Ti3C2 nanosheets was ∼0.76 h, as shown in Fig. 10C. At 24 h PI, Ti3C2 nanosheets were mainly distributed in the liver, spleen, and lungs, as shown in Fig. 10B. The accumulation of Ti3C2 nanosheets in the kidneys was much less than other 2D materials, such as BP, As, and Ge nanosheets.
Compared with Ti3C2 nanosheets, MXene-niobium carbide (Nb2C) nanosheets have better performance in biodegradation and metabolism.56 After being dispersed in water for several months, researchers obtained evidence of surface oxidation of Nb2C nanosheets through TEM observation. When H2O2 was present, the nanosheets lost their planar structure within 24 h. In a simulated human environment with human myeloperoxidase and H2O2, Nb2C nanosheets almost completely degraded within 24 h. In vivo experiments showed that within 2 days after i.v. injection, 20% of Nb would be excreted from mice through urine and feces. Among the main organs, the liver, spleen, and lungs accumulated the most Nb. Notably, the decline in Nb content in the lungs was significantly slower than that in other major organs. The passive accumulation efficiency of Nb element in the tumor site reached a peak of 2.24% ID g−1 at 24 h after injection, and the blood half-life was about 1.31 h. Subsequently, the same research group found that Nb2C nanosheets could protect the body from the damaging effects of ionizing radiation by scavenging free radicals.57 Nb2C nanosheets with an average size of 150 nm, a thickness of ∼0.5–1 nm, and a specific surface area of 2.997 m2 g−1 were prepared by selective etching assisted liquid phase exfoliation. In both in vitro and in vivo experiments, Nb2C nanosheets showed evident protective effects on irradiated cells and animals. After injection, the nanosheets distributed in almost all tissues including liver, lungs, spleen, heart, kidneys, testis, and small intestine, which was conducive to comprehensive protection. Compared with the previous study, the Nb2C nanosheets in this article exhibited a significantly prolonged plasma half-life (3.8 h). Notably, at 4–48 h PI, the liver showed the most evident uptake and clearance of Nb2C nanosheets, indicating possible liver metabolism pathways, including liver metabolism and bile excretion. At 24 h PI, the accumulation of modified Nb2C nanosheets in the organs reached the maximum, while in the previous study, the Nb element concentration in the organs had been decreasing at this time point. The different results of the two pieces of work may be due to the different animal models used: the previous study used immunodeficient nude mice, while this work used normal mice. Similar to the previous study, 20% Nb was excreted in urine and feces within 48 h after injection, as shown in Fig. 10D. Nearly 80% Nb was excreted in feces (57%) and urine (23%) within 7 days after injection, which avoids potential long-term toxicity.
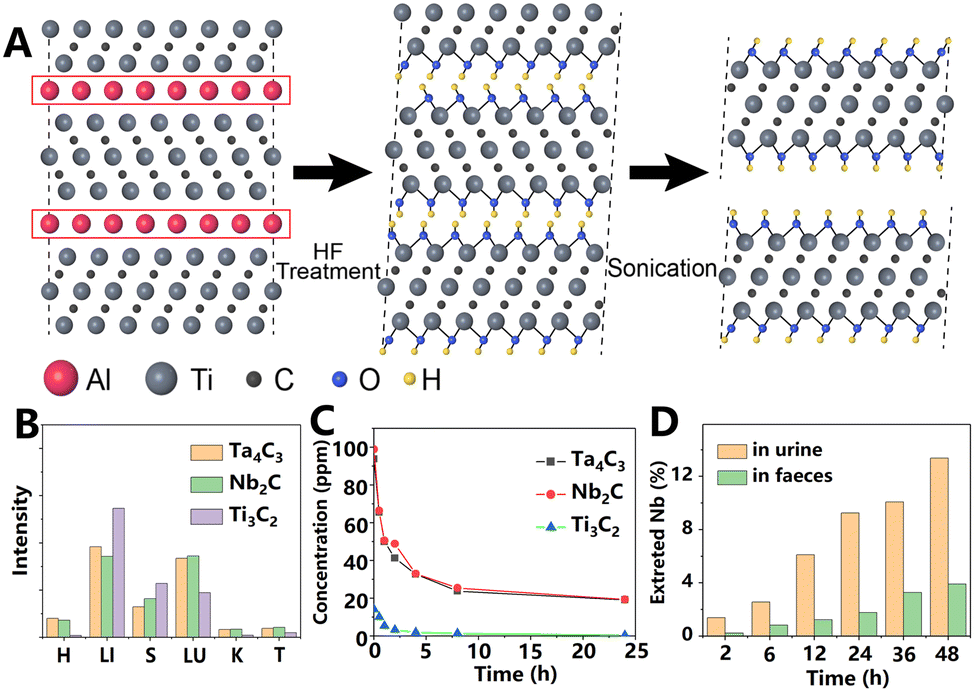 | ||
| Fig. 10 (A) Schematic of MXene exfoliation (Ti3C2) by selective etching and sonication. During this process, Al atoms in the precursor are replaced by OH in HF. Subsequently, dispersed nanosheets were obtained by sonication. Adapted and modified with permission from ref. 60 Copyright (2011) Wiley-VCH Verlag GmbH & Co. KGaA, Weinheim. (B) Biodistribution of various MXenes. To facilitate comparison of the relative tissue distribution of each material, the data were normalized. H: heart; LI: liver; S: spleen; LU: lungs; K: kidneys; and T: tumor. (C) Blood circulation curve of various MXenes. (D) Nb signal in urine and feces at different time points PI of Nb2C. Adapted and modified with permission from ref. 55 and 56 Copyright (2017) American Chemical Society and ref. 59 (2018) Wiley-VCH Verlag GmbH & Co. KGaA, Weinheim. | ||
In addition to Ti3C2 and Nb2C, tantalum carbide (Ta4C3) nanosheets showed unique advantages.58 The biocompatible Ta element with a high atomic number (Z = 73) makes Ta4C3 nanosheets a promising CT contrast agent. Similar to Ti3C2, Ta4C3 nanosheets remained stable in water for several weeks.59 The PA and CT signals of Ta4C3 nanosheets at the tumor site increased continuously within 24 h after injection. The maximum passive accumulation efficiency of the nanosheets was 1.41%, and the half-life was ∼1.59 h. The enrichment of Ta4C3 nanosheets in the main organs of mice occurred in liver, lungs, spleen, heart, and kidneys, in that order. Compared with Nb2C, there is still work to be done before clinical application to understand the degradation and metabolism of Ta4C3 nanosheets.
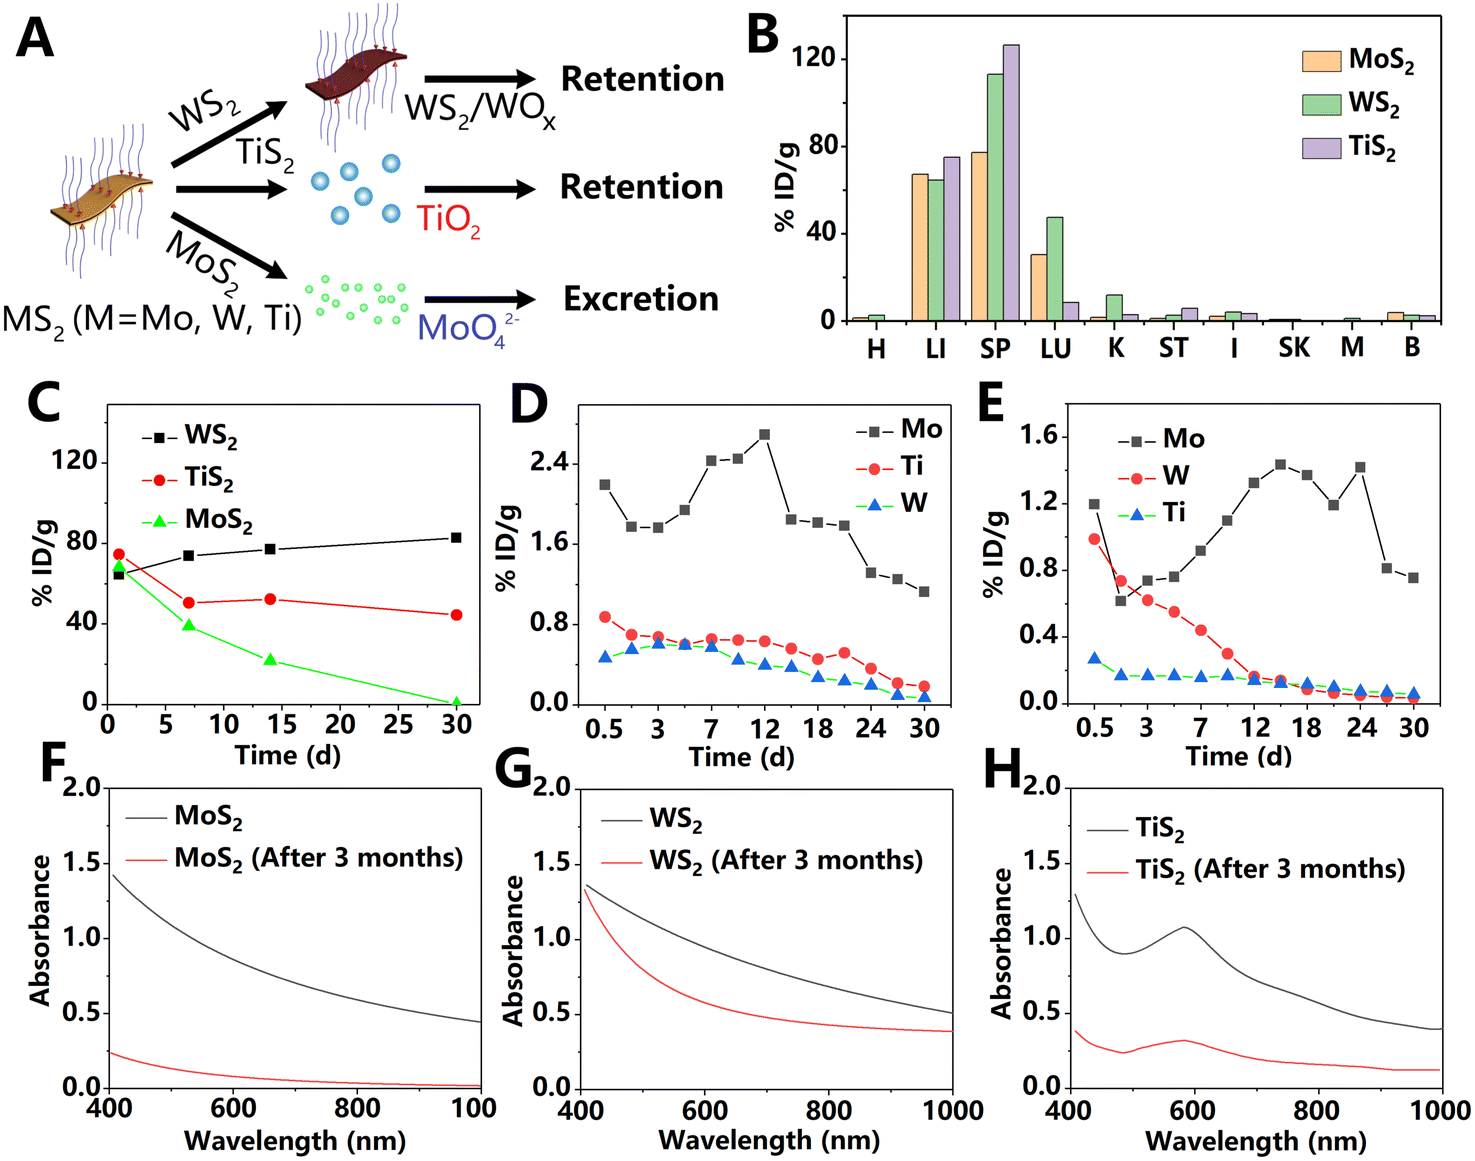
3.4 Transition metal dichalcogenides
Transition metal dichalcogenides (TMDs) can be expressed as MX2, where M is a transition metal, and X is a chalcogen (S, Se, or Te). Compared with other 2D materials, the properties of TMDs are more diverse. TMDs show different phases with the change of the link mode of the two elements, or the stacking way between layers. In addition, the band gap of some TMD nanosheets change from indirect to direct with the decrease in layers. The unique properties have attracted extensive attention from researchers, and a variety of applications based on TMDs have been developed, including biomedicine. Recently, Yim et al.61 used TMDs as antioxidants to treat sepsis. Molybdenum disulfide (MoS2), tungsten dichalcogenides (WS2), and tungsten selenide (WSe2) nanosheets with similar size and thickness were fabricated by liquid phase exfoliation. After being stored in an aqueous solution for 14 days, the characteristic absorption peaks of the three PEG-modified TMD nanosheets did not change significantly, indicating great stability. Owing to their optimal ROS and reactive nitrogen species clearance effect, WS2 was used on a septicemia mice model. At 3 h PI, the liver, spleen, lungs, and kidneys indicated evident material signals, as shown in Fig. 11A. At 3 days PI, no fluorescence signal of the nanosheets was observed in the above-mentioned four organs. The rapid clearance of WS2 nanosheets reduced the risk of long-term toxicity. Compared with i.v. injection, the intraperitoneal injection of nanosheets led to faster distribution in major organs within 1 h, as shown in Fig. 11B. However, until the 10th day, a small amount of material signals could still be detected in the liver and lungs, demonstrating that intraperitoneal injection led to a longer retention time of the nanosheets than i.v. injection. | ||
| Fig. 11 Biodistribution of WS2 nanosheets at different time points after i.v. (A) or intraperitoneal (B) administration. Adapted and modified with permission from ref. 61 Copyright (2020) American Chemical Society. (C) Biodistribution of MoS2 nanosheets at 24 h after i.v. injection, measured by radioactivity or ICP-AES. The data indicate the great impact of test methods on the biodistribution results. Adapted and modified with permission from ref. 62 Copyright (2015) American Chemical Society. (D) The pharmacokinetics of TaS2 nanosheets. Adapted and modified with permission from ref.65 Copyright (2017) Wiley-VCH Verlag GmbH & Co. KGaA, Weinheim. | ||
Compared with graphene and BP, metal modification of MoS2 is simpler due to the presence of the sulfur element. To fabricate MRI and PET contrast agents, Liu et al.62 modified the iron oxide particles and 64Cu on MoS2 nanosheets through sulfur chemistry and the affinity of sulfur–Cu2+, respectively. The as-prepared MoS2 nanosheets and iron oxide particles were further modified with lipoic acid PEG and amino-terminated six-arm PEG, which significantly improved the blood circulation time. In T2-weighted MR images, tumors, liver, and kidneys showed significantly reduced MR intensity at after 8 h PI, signaling MoS2 enrichment in these tissues. In contrast, the MR intensity of muscle did not decrease, which was related to less MoS2 nanosheet enrichment. The PET test also provided similar results. At 3 h PI, there was a significant 64Cu-labeled MoS2 nanosheet signal at the tumor site. At 24 h, the accumulation of MoS2 nanosheets in the tumor reached a maximum of over 5% ID g−1, while the material accumulation of muscle tissue was consistently below 1% ID g−1 within 1 day PI, as shown in Fig. 11C. The enrichment at tumor sites facilitates the application of MoS2 nanosheets as a drug delivery platform.
Although PET yields credible results of in vivo distribution, its safety and half-life dependent detection time limit its clinical application. In recent years, Xue et al.63 developed a label-free laser desorption/ionization mass spectrometry imaging (LDI MSI) strategy and used it to quantitatively evaluate the tissue distribution and drug release of MoS2 with sub-organ high resolution. The results showed that pure MoS2 nanosheets were enriched in the lungs within 1 h PI, while the material signals were almost undetectable in the heart, kidneys, and brain, demonstrated by LDI MSI at the same time. At 1 and 2 days PI, the signal intensity in the spleen and liver increased significantly, while that in the kidneys, heart, and brain remained almost undetectable. Considering the large size of the MoS2 nanosheets used in this article (750 ± 230 nm), it was difficult for the material to be cleared through glomerular filtration or penetrate the blood vessel barriers of the heart and brain. At 30 days PI, there was still a small quantity of MoS2 nanosheets in the MPS, which indicated the long-term accumulation of MoS2 nanosheets in the body. Similar to carbon materials, the MoS2 nanosheets in the spleen were mainly concentrated in the red pulp area. After encapsulating with PEG, MoS2 nanosheets showed faster organ metabolism, which is consistent with previous studies. At 2 days after the injection, PEG–MoS2 nanosheets could hardly be detected in the lungs, kidneys, heart, and brain tissues. Subsequently, the authors injected MoS2 nanosheets into a murine H22 orthotopic tumor model. The signal of MoS2 nanosheets in normal liver tissues was about 3.5 times higher than that of tumor foci, indicating that the enrichment of MoS2 nanosheets in normal liver tissues was much higher than that in liver cancer tissues. The fluorescence imaging employed in most studies failed to obtain sub-organ level results. This study suggests that we are far from fully understanding the in vivo behavior of 2D materials.
Tantalum (Ta) has been used as clinical implants, artificial joints, stents, and vascular clips for more than 50 years.64 Therefore, Ta-derived nanomaterials may have potential in biomedical application. Liu et al.65 used the liquid phase exfoliation method to fabricate TaS2 nanosheets with a size of about 110 nm for a light-controlled drug delivery platform. Compared with DOX, the drug delivery platform based on TaS2 exhibited a significantly prolonged blood circulation time, as shown in Fig. 11D. At 2 h PI, the CT signals of TaS2 nanosheets were observed in the mouse heart. At 24 h PI, the tumor site of the mouse showed the strongest DOX fluorescence signal. The TaS2 nanosheets distributed in the main organs of the whole body, with the liver and kidneys accumulating the most. Notably, NIR-treated tumors showed a stronger DOX fluorescence signal than the control group, which may be attributed to the accelerated release of DOX and the increased permeability in the tumor vascular system induced by heating.
Hao et al.66 compared the long-term in vivo behavior of MoS2, WS2, and titanium disulfide (TiS2), and the results are presented in Fig. 12. After PEG modification, MoS2, WS2, and TiS2 exhibited hydrodynamic diameters of approximately 91, 72, and 102 nm, respectively. At 1 day PI, these nanosheets exhibited similar accumulation in MPS-rich organs (liver and spleen) due to the phagocytosis of liver Kupffer cells and spleen macrophages. The difference was that MoS2 exhibited a significantly faster metabolic rate over time compared to WS2 and TiS2. The MoS2 content in vivo was decreased sharply within 1 month after administration. High concentrations of Mo were detected in the urine and feces, suggesting that MoS2 is excreted by the kidneys and gut. Unexpectedly, element W in the liver of WS2-treated mice increased slightly over time, possibly because the transfer of WS2 from the spleen to the liver is faster than liver excretion. The concentrations of W or Ti found in urine and feces of mice treated with WS2 or TS2 were significantly lower than Mo concentrations of the MoS2-treated group, indicating the longer retention of WS2 and TS2in vivo. Further experiments showed that, in PBS at room temperature, MoS2, TiS2, and WS2 undergo degradation that is almost complete, evident degradation, and slight, respectively, within 3 months. Most degradation products of MoS2 were water-soluble high-valence states Mo(VI) oxide. Unlike MoS2, under the same conditions, WS2 samples were incompletely oxidized into W(IV)/W(VI) compounds, while TiS2 formed an insoluble white precipitate TiO2 after oxidation. Furthermore, aggregates were observed in the degradation products of WS2 and TiS2, but not in the MoS2 sample.
 | ||
| Fig. 12 (A) Schematic illustration of different clearance approaches of MS2 nanosheets (M = Mo, W, and Ti). (B) Biodistribution of various TMDs. H: heart; LI: liver; SP: spleen; LU: lungs; K: kidneys; ST: stomach; I: intestine; SK: skin; M: muscle; and B: bone; (C) clearance effect of liver at different time points post i.v. injection of various TMDs. (D and E) Various TMD signals in urine (D) and feces (E) at different time points post i.v. injection. Absorption spectra of MoS2 (F), WS2 (G), and TiS2 (H) before and after standing in PBS solution for 3 months. Adapted and modified with permission from ref. 66 Copyright (2017) Wiley-VCH Verlag GmbH & Co. KGaA, Weinheim. | ||
4. Discussion and future prospects
4.1 Research progress
In the past few decades, thousands of peer-reviewed papers have been published in the field of nanomedicine, and vast funds have been invested in related research. Nevertheless, there are very few clinically transformed nanomedicines, especially inorganic ones. The main reason for this situation involves the concerns about the potential long-term toxicity of inorganic nanomaterials. Considering the massive uptake of nanomaterials by MPS and clinical side effects, this concern is justified. In fact, among the most successful inorganic nanomaterials, some clinically approved iron oxide nanoparticles have been discontinued for safety reasons.67 Today, 2D materials show attractive prospects in the field of nanomedicine. However, it is still too early for the clinical application of 2D materials. In addition to therapeutic efficacy, the biodistribution, degradation, and metabolism of 2D materials are most important factors to be considered and their careful evaluation is necessary before clinical transformation. Fortunately, researchers have become increasingly aware of the interaction between 2D materials and the physiological environment. Meanwhile, a variety of tracking methods have been developed to investigate the in vivo fate of 2D materials. These methods can be divided into in vivo and in vitro tracking methods. In vivo tracking methods include labeling methods and label-free methods. Due to its simplicity and safety, fluorescent labeling is one of the most popular methods for tracking the in vivo distribution of 2D materials. However, accompanied by strong background interference, this method is a semi-quantitative tool. In recent years, this technology has made great progress in the near-infrared second region, and is expected to obtain high quality images with a weak background signal. Compared with fluorescent labeling, although the radionuclide labeling method provides more accurate results, it has limitations in half-life and safety. These labeling methods can provide real-time and high-resolution results, but they require a time-consuming labeling process and suffer from the risk of label peeling, which can be avoided by label-free methods. As clinical imaging techniques, CT imaging and MRI were used to observe the in vivo behavior of nanosheets. To obtain high-contrast results, CT imaging is suitable for nanosheets containing high atomic number elements, while MRI was reported mainly in iron- and manganese-based nanosheets. In the work of photothermal therapy of 2D materials, photoacoustic imaging and photothermal imaging were widely used to demonstrate the biodistribution of materials, because the principle of these methods is the photothermal effect of materials. In addition to in vivo tracking, some methods were also used in tracking 2D materials in vitro, including ICP, transmission electron microscopy (TEM), Raman imaging and mass spectrometry imaging. ICP is one of the most popular elemental detection methods and is widely used in pharmacokinetic analysis. This method is highly accurate and suitable for most materials. TEM can provide images with nanometer-scale resolution, which has an irreplaceable advantage in observing the entry of nanosheets into cells or through biological barriers. In the study of the long-term fate of 2D materials, Raman spectroscopy has unique advantages. It can not only be used to determine the biodistribution but also to give information on the degradation of 2D materials. Mass spectrometry imaging is a novel technique, which has been used to analyze the biodistribution of 2D materials since 2015. Its unique advantage is that it can track nanosheets and loaded drugs simultaneously without labeling, which is of great significance for the study of drug delivery and release based on 2D materials. Overall, each of these methods has its own advantages and disadvantages, and therefore combining multiple tracking techniques is necessary to obtain comprehensive information on the in vivo behavior of 2D materials. With sufficient exploration, a variety of factors have been shown to have an impact on the in vivo behavior of 2D materials. Rational design of 2D materials can reduce the potential risk of off-target effects and long-term retention. 2D materials with actively changing size not only show increased accumulation in lesions but also good clearance and safety. Reasonable modification can change the surface potential, enhance blood compatibility, and promote immune escape of materials. By isolating the 2D materials from oxygen, the degradation rate of the material being coated is controllable. Furthermore, after special modification, 2D materials possess active targeting capabilities and enhanced therapeutic effects. Because of the significant influence of material components on the in vivo behavior, the interaction of composite materials with the physiological environment is often different from that of a single material (Table 1). The change in the band structure and the performance synergy also equip multi-component materials with unique advantages over the single component. Unlike traditional drugs, 2D materials can respond to a variety of external stimuli, including magnetic fields, lasers, and ultrasound, to adjust their in vivo behaviors. These physical means can remotely control the permeability of the blood vessel and the degradation rate of material, realizing intelligent treatment.| Material | Size and thickness | Modification strategy | Main accumulation in organs | Biodegradation | Tracking method |
|---|---|---|---|---|---|
| GO | Size: 10–30 nm | PEG1, cyclic R10 peptide,22 DNA,30 MicroRNA,68 boron doping,69 liposomes70 | Spleen, liver, stomach, lungs, kidneys1 | Slow1 | Radiolabeling,1 TEM, confocal Raman mapping,6 mass spectrometry imaging40 |
| Thickness: ∼1 nm1 | |||||
| rGO41 | Size: ∼1 μm | PEG | Liver, spleen | Slow | Raman spectroscopy |
| Thickness: 4–9 nm | |||||
| Graphdiyne oxide71 | Size: 120 ± 15 nm | iRGD peptide | Liver, spleen | N.A. | FL imaging |
| Thickness: ∼1.7 nm | |||||
| BP | Size: ∼120 nm | PEG,43 polydopamine,18 PLGA,12 exosomes,13 polyoxometalates14 TiL4,19 Cu45 | Liver, kidneys, lung43 | Fast3 | FL imaging,43 radiolabeling45 |
| Thickness: 1–2 nm43 | |||||
| Sb | Size: ∼140 nm | PEG17 | Liver, lung, kidneys, spleen17 | Fast17 | FL imaging, PA imaging,17 ICP2 |
| Thickness: ∼4 nm17 | |||||
| B51 | Size: ∼100 nm | PEG | Liver, lungs, kidneys | Slow | FL imaging, PA imaging |
| Thickness: <5 nm | |||||
| Ge52 | Size: ∼60 nm | PEG | Kidneys, liver, lungs | N.A. | FL imaging, PA imaging |
| Thickness: ∼5 nm | |||||
| As42 | Size: ∼200.8 nm | N.A. | Liver | N.A. | ICP |
| Thickness: >50 nm | |||||
| Bi54 | Size: ∼200 nm | Bovine serum albumin | Liver, spleen, lungs | Fast | ICP, CT, PA imaging |
| Thickness: ∼14 nm | |||||
| Te72 | Size: ∼300 nm | Glutathione | Liver, spleen, kidneys | Fast | ICP, PA imaging |
| Thickness: ∼10 nm | |||||
| Ti3C255 | Size: ∼150 nm | Soybean phospholipid | Liver, spleen, lungs | N.A. | ICP |
| Thickness: ∼0.6 nm | |||||
| Nb2C56 | Size: ∼150 nm | Polyvinylpyrrolidone | Liver, spleen, lungs, heart | Fast | PA imaging, ICP, TEM |
| Thickness: 0.3–0.8 nm | |||||
| Ta4C359 | Size: ∼100 nm | Soybean phospholipid | Liver, lungs, spleen, Heart | N.A. | ICP, CT, PA imaging |
| Thickness: ∼1 nm | |||||
| Mo2C73 | Size: 143.8 nm | Polyvinyl alcohol | Liver, spleen, lungs | Fast | ICP |
| Thickness: 2.2–9.0 nm | |||||
| WS261 | Size: ∼246 nm | PEG | i.v. injection: liver | Slow | FL imaging |
| i.p. injection: liver, lungs, spleen | |||||
| Thickness: ∼4 nm | |||||
| MoS2 | Size: ∼91 nm66 | PEG66 glucose oxidase21 | Liver, spleen66 | Fast66 | Radiolabeling,62 ICP,66 Mass spectrometry imaging63 |
| TaS265 | Size: ∼110 nm | PEG | Liver, kidneys | N.A. | FL imaging, CT |
| TiS266 | Size: ∼102 nm | PEG | Liver, spleen | Slow | ICP |
| MoSe20 | Size: ∼130 nm | Red blood cells | Spleen, liver | N.A. | Atomic fluorescence spectrometer, ICP |
| Thickness: ∼1.5 nm | |||||
| ZrB274 | Size: ∼150 nm | Hyaluronic acid | Liver, spleen | N.A. | FL imaging, PA imaging, ICP |
| Thickness: ∼7.4 nm | |||||
| FePS375 | Size: 78–154 nm | poly(vinylpyrrolidone) | Spleen, lung | N.A. | ICP |
| Thickness: 2.9–8.9 nm | |||||
| WS2/carbon dot24 | Size: 168 nm | N.A. | Liver | N.A. | FL imaging |
| Thickness: 2.5–3.0 nm | |||||
| Ti3C2/Au27 | Size: ∼260 nm | PEG | Liver, spleen, lungs | N.A. | ICP, CT, PA imaging |
| Thickness: ∼60 nm | |||||
| GO/Fe3O429 | Size: ∼166.6 nm | PEG | Spleen, liver, heart, kidneys | N.A. | ICP, MR imaging |
After being administered in vivo, most 2D materials tend to accumulate in MPS-rich organs, such as the liver and spleen. Then, 2D materials would degrade and be removed from the body. Some 2D materials degrade very quickly, including most Xenes, MoS2, and Nb2C nanosheets. The biological effects of their degradation products are worthy of attention. Others, including graphene derivatives, boron, WS2 and TiS2 nanosheets, degrade slowly, which is accompanied by long-term retention and potential toxicity. Notably, nanosheets may undergo morphological reconfiguration in vivo due to the unique 2D planar structure. Consequently, some developments on the in vivo behavior of nanoparticles may not be suitable for 2D materials, such as the optimal size for passively targeting tumors.
4.2 Future prospects
Numerous scientists have devoted themselves to the investigation and improvement of the in vivo behavior of 2D materials. However, the current progress is still far from sufficient to meet the needs of clinical applications. There is still a lack of unified evaluation standards in this field, which are manifested in the following aspects: (1) biological models have been shown to significantly affect the biodistribution of 2D materials, which makes it difficult to compare different studies. (2) There are evident differences in the data obtained by different tracking methods. Even within the same study, different detection methods show qualitative rather than quantitatively consistency in most cases. (3) 2D materials with different preparation processes, sizes, shapes, and modification methods will have completely different performances under physiological conditions, which cannot be simply classified by material types. To realize the clinical application of 2D materials as soon as possible, it is necessary to establish a scientific evaluation standard for the fate of 2D materials through the cooperation of cross-field experts. In addition, as the most commonly used method for preparing 2D materials in the field of biological applications, liquid phase exfoliation cannot obtain materials with uniform size and shape. The prerequisite for stable therapeutic and metabolic results is to develop a large-scale stable exfoliation method. The bottom-up method in the liquid phase, such as the wet chemical method is a promising path, which has been used for the fabrication of a variety of 2D materials. After establishing unified evaluation standards for 2D nanomedicines, proving the long-term safety of 2D materials is the key to accelerating clinical development. To achieve this goal, extensive standardized animal experiments are essential. In addition, compared to abundant experiments based on small rodents, long-term experiments based on large animals, which enable the investigation of the actual therapeutic effects and metabolic pathways of 2D materials, are relatively few. Furthermore, many efforts have been devoted to developing degradable 2D materials for their biomedical applications. However, the in vivo degradation process of 2D materials is often accompanied by drastic changes in the local microenvironment. So, their long-term damage to normal tissue needs to be evaluated carefully and systematically. Also, a safe dosage of 2D materials and their metabolism are an overlooked problem. Although there is still a lot of work to be done, the current progress of 2D materials in the biomedical field is exciting and promising. As ideal candidates for personalized therapy, specific 2D material-based therapeutic strategies have been used for different disease treatments to overcome the limitations of traditional therapies. For example, very recently, there have been clinical trials of graphene in reproductive medicine (trial registration number NCT04881877) and dentistry (trial registration number NCT05341245).5. Conclusions
2D materials have been applied in the field of biomedicine for over 10 years, and great progress has been made. To realize the clinical transformation, the interaction between the 2D materials and biological milieu must be carefully investigated. 2D materials have a large specific surface area, abundant chemical active sites, and adjustable band structure. These characteristics provide researchers with the opportunity to control the fate of 2D materials in vivo through a variety of methods, such as changing size and composition, surface modification, and external stimulation. Various 2D materials, including graphene and its derivatives, Xenes, MXenes, and TMDs, have their unique biological advantages and in vivo behavior. As the first type of 2D materials used in biology, graphene derivatives have long-term retention in the body, which raises concerns about their potential long-term toxicity. In contrast, the biodegradability of BP nanosheets is so fast that some strategies have been developed to delay its degradation. Furthermore, most other Xenes likewise have good biodegradability, and were developed for treatment and diagnosis. MXenes are another type of 2D material prepared by selective etching assisted liquid phase exfoliation. Although there are similar preparation processes, different MXenes exhibit different in vivo behaviors and biological applications due to differences in components. Similar to MXenes, members of the TMD family also exhibit completely different biological characteristics. Research on the long-term fate of 2D materials in vivo is difficult but meaningful. More efforts must be made to understand and control their degradability, clearance, and biodistribution.Conflicts of interest
There are no conflicts to declare.Acknowledgements
This work was supported by the National Natural Science Fund (Grant No. 51972055, 81803480, 81960334, and 22004087), the Shenzhen Bay Laboratory Open Program (SZBL2020090501002), the Common University Innovation Team Project of Guangdong (Grant no. 2021KCXTD041), the Guangdong Basic and Applied Basic Research Foundation (2019A1515110926, 2020A1515010787), the Shenzhen Science and Technology Innovation Commission (JCYJ20190809145601651), and the Natural Science Foundation of Top Talent of SZTU (20200201, 20200202, and GDRC202116).Notes and references
- K. Yang, J. Wan, S. Zhang, Y. Zhang, S.-T. Lee and Z. Liu, ACS Nano, 2011, 5, 516 CrossRef CAS PubMed.
- Y. Duo, Y. Huang, W. Liang, R. Yuan, Y. Li, T. Chen and H. Zhang, Adv. Funct. Mater., 2019, 30, 1906010 CrossRef.
- H. Wang, X. Yang, W. Shao, S. Chen, J. Xie, X. Zhang, J. Wang and Y. Xie, J. Am. Chem. Soc., 2015, 137, 11376 CrossRef CAS PubMed.
- M. Luo, T. Fan, Y. Zhou, H. Zhang and L. Mei, Adv. Funct. Mater., 2019, 29, 1808306 CrossRef.
- W. Poon, B. R. Kingston, B. Ouyang, W. Ngo and W. C. W. Chan, Nat. Nanotechnol., 2020, 15, 819 CrossRef CAS PubMed.
- L. Newman, D. A. Jasim, E. Prestat, N. Lozano, I. de Lazaro, Y. Nam, B. M. Assas, J. Pennock, S. J. Haigh, C. Bussy and K. Kostarelos, ACS Nano, 2020, 14, 10168 CrossRef CAS PubMed.
- D. A. Jasim, S. Murphy, L. Newman, A. Mironov, E. Prestat, J. McCaffrey, C. Menard-Moyon, A. F. Rodrigues, A. Bianco, S. Haigh, R. Lennon and K. Kostarelos, ACS Nano, 2016, 10, 10753 CrossRef CAS PubMed.
- S. Wilhelm, A. J. Tavares, Q. Dai, S. Ohta, J. Audet, H. F. Dvorak and W. C. W. Chan, Nat. Rev. Mater., 2016, 1, 16014 CrossRef CAS.
- K. M. Tsoi, S. A. MacParland, X. Z. Ma, V. N. Spetzler, J. Echeverri, B. Ouyang, S. M. Fadel, E. A. Sykes, N. Goldaracena, J. M. Kaths, J. B. Conneely, B. A. Alman, M. Selzner, M. A. Ostrowski, O. A. Adeyi, A. Zilman, I. D. McGilvray and W. C. Chan, Nat. Mater., 2016, 15, 1212 CrossRef CAS PubMed.
- H. Soo Choi, W. Liu, P. Misra, E. Tanaka, J. P. Zimmer, B. Itty Ipe, M. G. Bawendi and J. V. Frangioni, Nat. Biotechnol., 2007, 25, 1165 CrossRef PubMed.
- T. Cao, P. You, X. Zhou, J. Luo, X. Xu, Z. Zhou, S. Yang, Y. Zhang, H. Yang and M. Wang, J. Mater. Chem. B, 2016, 4, 6446 RSC.
- J. Shao, H. Xie, H. Huang, Z. Li, Z. Sun, Y. Xu, Q. Xiao, X. F. Yu, Y. Zhao, H. Zhang, H. Wang and P. K. Chu, Nat. Commun., 2016, 7, 12967 CrossRef CAS PubMed.
- Q. Liu, T. Fan, Y. Zheng, S. L. Yang, Z. Yu, Y. Duo, Y. Zhang, D. Adah, L. Shi, Z. Sun, D. Wang, J. Xie, H. Wu, Z. Wu, C. Ge, L. Qiao, C. Wei, L. Huang, Q. Yan, Q. Yang, S. Bao, L. P. Liu and H. Zhang, Nanoscale, 2020, 12, 19939 RSC.
- Y. Wang, J. Xie, J. Kang, W. Choi, P. Jangili, B. Zhang, N. Xie, G. Nie, J. He, H. Zhang, L. Liu and J. S. Kim, Adv. Funct. Mater., 2020, 30, 2003338 CrossRef CAS.
- R. Cai and C. Chen, Adv. Mater., 2019, 31, e1805740 CrossRef PubMed.
- H. Kim, J. Kim, M. Lee, H. C. Choi and W. J. Kim, Adv. Healthcare Mater., 2016, 5, 1918–1930 CrossRef CAS PubMed.
- W. Tao, X. Ji, X. Zhu, L. Li, J. Wang, Y. Zhang, P. E. Saw, W. Li, N. Kong, M. A. Islam, T. Gan, X. Zeng, H. Zhang, M. Mahmoudi, G. J. Tearney and O. C. Farokhzad, Adv. Mater., 2018, 30, e1802061 CrossRef PubMed.
- X. Zeng, M. Luo, G. Liu, X. Wang, W. Tao, Y. Lin, X. Ji, L. Nie and L. Mei, Adv. Sci., 2018, 5, 1800510 CrossRef PubMed.
- Z. Sun, Y. Zhao, Z. Li, H. Cui, Y. Zhou, W. Li, W. Tao, H. Zhang, H. Wang, P. K. Chu and X. F. Yu, Small, 2017, 13, 1602896 CrossRef PubMed.
- L. He, T. Nie, X. Xia, T. Liu, Y. Huang, X. Wang and T. Chen, Adv. Funct. Mater., 2019, 29, 1901240 CrossRef.
- L. Mei, D. Ma, Q. Gao, X. Zhang, W. Fu, X. Dong, G. Xing, W. Yin, X. Gu and Y. Zhao, Mater. Horiz., 2020, 7, 1834 RSC.
- Z. Tu, I. S. Donskyi, H. Qiao, Z. Zhu, W. E. S. Unger, C. P. R. Hackenberger, W. Chen, M. Adeli and R. Haag, Adv. Funct. Mater., 2020, 30, 2000933 CrossRef CAS.
- S. Tang, C. Peng, J. Xu, B. Du, Q. Wang, R. D. Vinluan, M. Yu, M. J. Kim and J. Zheng, Angew. Chem., Int. Ed., 2016, 55, 16039–16043 CrossRef CAS PubMed.
- B. Geng, H. Qin, W. Shen, P. Li, F. Fang, X. Li, D. Pan and L. Shen, Chem. Eng. J., 2020, 383, 123102 CrossRef CAS.
- L. Cheng, J. Liu, X. Gu, H. Gong, X. Shi, T. Liu, C. Wang, X. Wang, G. Liu, H. Xing, W. Bu, B. Sun and Z. Liu, Adv. Mater., 2014, 26, 1886 CrossRef CAS PubMed.
- H. Huang, L. He, W. Zhou, G. Qu, J. Wang, N. Yang, J. Gao, T. Chen, P. K. Chu and X. F. Yu, Biomaterials, 2018, 171, 12 CrossRef CAS PubMed.
- W. Tang, Z. Dong, R. Zhang, X. Yi, K. Yang, M. Jin, C. Yuan, Z. Xiao, Z. Liu and L. Cheng, ACS Nano, 2019, 13, 284–294 CrossRef CAS PubMed.
- W. Liang, D. Wang, X. Ren, C. Ge, H. Wang, Z. Li, Q. Liu, M. Qiu, Z. Du, X. Qi, Y. Xu, L. Liu, S. Bao and H. Zhang, Nanophotonics, 2020, 9, 3023–3034 CrossRef CAS.
- X. Liu, B. Yan, Y. Li, X. Ma, W. Jiao, K. Shi, T. Zhang, S. Chen, Y. He, X. J. Liang and H. Fan, ACS Nano, 2020, 14, 1936–1950 CrossRef CAS PubMed.
- H. Lee, J. Kim, J. Lee, H. Park, Y. Park, S. Jung, J. Lim, H. C. Choi and W. J. Kim, Biomaterials, 2020, 263, 120402 CrossRef CAS PubMed.
- S. Xiong, Z. Li, Y. Liu, Q. Wang, J. Luo, X. Chen, Z. Xie, Y. Zhang, H. Zhang and T. Chen, Biomaterials, 2020, 260, 120339 CrossRef CAS PubMed.
- L. Jin, P. Hu, Y. Wang, L. Wu, K. Qin, H. Cheng, S. Wang, B. Pan, H. Xin, W. Zhang and X. Wang, Adv. Mater., 2020, 32, 1906050 CrossRef CAS PubMed.
- D. Kim, J. M. Yoo, H. Hwang, J. Lee, S. H. Lee, S. P. Yun, M. J. Park, M. Lee, S. Choi, S. H. Kwon, S. Lee, S. H. Kwon, S. Kim, Y. J. Park, M. Kinoshita, Y. H. Lee, S. Shin, S. R. Paik, S. J. Lee, S. Lee, B. H. Hong and H. S. Ko, Nat. Nanotechnol., 2018, 13, 812 CrossRef CAS PubMed.
- J. Xie, Z. Shen, Y. Anraku, K. Kataoka and X. Chen, Biomaterials, 2019, 224, 119491 CrossRef CAS PubMed.
- W. Fu, X. Zhang, L. Mei, R. Zhou, W. Yin, Q. Wang, Z. Gu and Y. Zhao, ACS Nano, 2020, 14, 10001 CrossRef CAS PubMed.
- C. Dai, S. Zhang, Z. Liu, R. Wu and Y. Chen, ACS Nano, 2017, 11, 9467 CrossRef CAS PubMed.
- W. Chen, J. Wang, W. Du, J. Wang, L. Cheng, Z. Ge, S. Qiu, W. Pan, L. Song, X. Ma and Y. Hu, ACS Appl. Nano Mater., 2021, 4, 7963 CrossRef CAS.
- S. Sadekar, O. Linares, G. Noh, D. Hubbard, A. Ray, M. Janat-Amsbury, C. M. Peterson, J. Facelli and H. Ghandehari, Drug Delivery Transl. Res., 2013, 3, 260 CrossRef CAS PubMed.
- H. Bai, W. Jiang, G. P. Kotchey, W. A. Saidi, B. J. Bythell, J. M. Jarvis, A. G. Marshall, R. A. Robinson and A. Star, J. Phys. Chem. C, 2014, 118, 10519 CrossRef CAS PubMed.
- S. Chen, C. Xiong, H. Liu, Q. Wan, J. Hou, Q. He, A. Badu-Tawiah and Z. Nie, Nat. Nanotechnol., 2015, 10, 176 CrossRef CAS PubMed.
- S. Syama, W. Paul, A. Sabareeswaran and P. V. Mohanan, Biomaterials, 2017, 131, 121 CrossRef CAS PubMed.
- X. Wang, Y. Hu, J. Mo, J. Zhang, Z. Wang, W. Wei, H. Li, Y. Xu, J. Ma, J. Zhao, Z. Jin and Z. Guo, Angew. Chem., Int. Ed., 2020, 59, 5151 CrossRef CAS PubMed.
- W. Tao, X. Zhu, X. Yu, X. Zeng, Q. Xiao, X. Zhang, X. Ji, X. Wang, J. Shi, H. Zhang and L. Mei, Adv. Mater., 2017, 29, 1603276 CrossRef PubMed.
- J. Hou, H. Wang, Z. Ge, T. Zuo, Q. Chen, X. Liu, S. Mou, C. Fan, Y. Xie and L. Wang. Nano Lett., 2020, 20, 1447 Search PubMed.
- K. Hu, L. Xie, Y. Zhang, M. Hanyu, Z. Yang, K. Nagatsu, H. Suzuki, J. Ouyang, X. Ji, J. Wei, H. Xu, O. C. Farokhzad, S. H. Liang, L. Wang, W. Tao and M. R. Zhang, Nat. Commun., 2020, 11, 2778 CrossRef CAS PubMed.
- W. Zhou, T. Pan, H. Cui, Z. Zhao, P. K. Chu and X.-F. Yu, Angew. Chem., Int. Ed., 2019, 58, 769 CrossRef CAS PubMed.
- X. Shao, Z. Ding, W. Zhou, Y. Li, Z. Li, H. Cui, X. Lin, G. Cao, B. Cheng, H. Sun, M. Li, K. Liu, D. Lu, S. Geng, W. Shi, G. Zhang, Q. Song, L. Chen, G. Wang, W. Su, L. Cai, L. Fang, D. T. Leong, Y. Li, X. F. Yu and H. Li, Nat. Nanotechnol., 2021, 16, 1150–1160 CrossRef CAS PubMed.
- Z. Sun, H. Xie, S. Tang, X. F. Yu, Z. Guo, J. Shao, H. Zhang, H. Huang, H. Wang and P. K. Chu, Angew. Chem., Int. Ed., 2015, 54, 11526 CrossRef CAS PubMed.
- C. Gibaja, D. Rodriguez-San-Miguel, P. Ares, J. Gómez-Herrero, M. Varela, R. Gillen, J. Maultzsch, F. Hauke, A. Hirsch, G. Abellán and F. Zamora, Angew. Chem., Int. Ed., 2016, 55, 14345 CrossRef CAS PubMed.
- Y. Duo, Z. Xie, L. Wang, N. Mahmood Abbasi, T. Yang, Z. Li, G. Hu and H. Zhang, Coord. Chem. Rev., 2021, 427, 213549 CrossRef CAS.
- X. Ji, N. Kong, J. Wang, W. Li, Y. Xiao, S. T. Gan, Y. Zhang, Y. Li, X. Song, Q. Xiong, S. Shi, Z. Li, W. Tao, H. Zhang, L. Mei and J. Shi, Adv. Mater., 2018, 30, e1803031 CrossRef PubMed.
- C. Feng, J. Ouyang, Z. Tang, N. Kong, Y. Liu, L. Fu, X. Ji, T. Xie, O. C. Farokhzad and W. Tao, Matter, 2020, 3, 127 CrossRef.
- J. Ouyang, C. Feng, X. Ji, L. Li, H. K. Gutti, N. Y. Kim, D. Artzi, A. Xie, N. Kong, Y. N. Liu, G. J. Tearney, X. Sui, W. Tao and O. C. Farokhzad, Angew. Chem., Int. Ed., 2019, 58, 13405 CrossRef CAS PubMed.
- Y. Wang, W. Feng, M. Chang, J. Yang, Y. Guo, L. Ding, L. Yu, H. Huang, Y. Chen and J. Shi, Adv. Funct. Mater., 2020, 31, 2005093 CrossRef.
- H. Lin, X. Wang, L. Yu, Y. Chen and J. Shi, Nano Lett., 2017, 17, 384 CrossRef CAS PubMed.
- H. Lin, S. Gao, C. Dai, Y. Chen and J. Shi, J. Am. Chem. Soc., 2017, 139, 16235 CrossRef CAS PubMed.
- X. Ren, M. Huo, M. Wang, H. Lin, X. Zhang, J. Yin, Y. Chen and H. Chen, ACS Nano, 2019, 13, 6438 CrossRef CAS PubMed.
- H. Huang, R. Jiang, Y. Feng, H. Ouyang, N. Zhou, X. Zhang and Y. Wei, Nanoscale, 2020, 12, 1325 RSC.
- H. Lin, Y. Wang, S. Gao, Y. Chen and J. Shi, Adv. Mater., 2018, 30(4), 1703284 CrossRef PubMed.
- M. Naguib, M. Kurtoglu, V. Presser, J. Lu, J. Niu, M. Heon, L. Hultman, Y. Gogotsi and M. W. Barsoum, Adv. Mater., 2011, 23, 4248–4253 CrossRef CAS PubMed.
- D. Yim, D. E. Lee, Y. So, C. Choi, W. Son, K. Jang, C. S. Yang and J. H. Kim, ACS Nano, 2020, 14, 10324 CrossRef CAS PubMed.
- T. Liu, S. Shi, C. Liang, S. Shen, L. Cheng, C. Wang, X. Song, S. Goel, T. E. Barnhart, W. Cai and Z. Liu, ACS Nano, 2015, 9, 950 CrossRef CAS PubMed.
- J. Xue, H. Liu, S. Chen, C. Xiong, L. Zhan, J. Sun and Z. Nie, Sci Adv, 2018, 4, eaat9039 CrossRef CAS PubMed.
- J. Black, Clin. Mater., 1994, 16, 167 CrossRef CAS PubMed.
- Y. Liu, X. Ji, J. Liu, W. W. L. Tong, D. Askhatova and J. Shi, Adv. Funct. Mater., 2017, 27, 1703261 CrossRef PubMed.
- J. Hao, G. Song, T. Liu, X. Yi, K. Yang, L. Cheng and Z. Liu, Adv. Sci., 2017, 4, 1600160 CrossRef PubMed.
- H. Huang, W. Feng, Y. Chen and J. Shi, Nano Today, 2020, 35, 100972 CrossRef CAS.
- C. Dou, N. Ding, F. Luo, T. Hou, Z. Cao, Y. Bai, C. Liu, J. Xu and S. Dong, Adv. Sci., 2018, 5, 1700578 CrossRef PubMed.
- X. Qi, H. Liu, W. Guo, W. Lin, B. Lin, Y. Jin and X. Deng, Adv. Funct. Mater., 2019, 29, 1902235 CrossRef.
- A. C. Ip, B. Liu, P. J. Huang and J. Liu, Small, 2013, 9, 1030 CrossRef CAS PubMed.
- W. Jiang, Z. Zhang, Q. Wang, J. Dou, Y. Zhao, Y. Ma, H. Liu, H. Xu and Y. Wang, Nano Lett., 2019, 19, 4060 CrossRef CAS PubMed.
- Y. Lin, Y. Wu, R. Wang, G. Tao, P.-F. Luo, X. Lin, G. Huang, J. Li and H.-H. Yang, Chem. Commun., 2018, 54, 8579 RSC.
- W. Feng, R. Wang, Y. Zhou, L. Ding, X. Gao, B. Zhou, P. Hu and Y. Chen, Adv. Funct. Mater., 2019, 29, 1901942 CrossRef.
- D. Chen, Z. Jin, B. Zhao, Y. Wang and Q. He, Adv. Mater., 2021, 33, e2008089 CrossRef PubMed.
- Q. Zhang, Q. Guo, Q. Chen, X. Zhao, S. J. Pennycook and H. Chen, Adv. Sci., 2020, 7, 1902576 CrossRef CAS PubMed.
Footnote |
| † These authors contributed equally to this work. |
| This journal is © The Royal Society of Chemistry 2022 |