 Open Access Article
New horizons for carbon dots: quantum nano-photoinitiating catalysts for cationic photopolymerization and three-dimensional (3D) printing under visible light†
Wiktoria
Tomal
 a,
Tomasz
Świergosz
 b,
Maciej
Pilch
 a,
Wiktor
Kasprzyk
 a and
Joanna
Ortyl
 *ac
*ac
aDepartment of Biotechnology and Physical Chemistry, Faculty of Chemical Engineering and Technology, Cracow University of Technology, Warszawska 24, 31-155 Kraków, Poland. E-mail: jortyl@pk.edu.pl
bDepartment of Analytical Chemistry, Faculty of Chemical Engineering and Technology, Cracow University of Technology, Warszawska 24, 31-155 Kraków, Poland
cPhoto HiTech Ltd, Bobrzyńskiego 14, 30-348 Cracow, Poland
First published on 11th June 2021
Abstract
Herein, the application of various citric acid-based carbon dots (CDs) as efficient photosensitizers of iodonium salts in initiating the light-induced cationic polymerization process was investigated. Hence, carbon dots prepared from citric acid only (CA-CDs) and doped with amino (N-doped-CA-CDs) and sulphur (N,S-doped-CA-CDs) precursors have been utilized as universal iodonium salt photosensitizers for the cationic photopolymerization of vinyl and epoxy monomers and the free-radical photopolymerization of acrylates including the formation of hydrogels. Furthermore, carbon dots have been found to be intriguing nano-photoinitiating catalysts that exhibit extraordinary properties and can be successfully applied in 3D printing under visible light.
Introduction
Light-initiated polymerization processes are currently conquering the chemical market and are used in many fields including coating, ink,1 and varnishes, and 3D printing applications.2,3–12 Moreover, safety-related light sources such as UV-LEDs and Vis-LEDs extend the function of these processes to the following fields: medicine,13 dentistry14,15 or tissue engineering.16–18 Polymerization processes based on photochemical phenomena have several advantages: considerable reaction kinetics, no need for high temperature treatment, low energy consumption and lack of solvents. The focus is on photoinitiators and photoinitiation systems, being a pivotal element in photopolymerization processes. At the same time, among the most popular initiators available on the market are iodine salts; However, the relatively small amount of the total radiation spectrum and the insufficient quantum yield are factors that hinder the use of these compounds in multi-component photoinitiating systems. Scientists around the world are currently working on new molecules, the so-called iodine salt photosensitizers, to efficiently transfer electrons to the iodine salt and thus effectively trigger light-initiated polymerization.19 Many types of compounds are available as effective photosensitizers of iodine salts, including biphenyl,20,21 terphenyl,1,22,28 thioxanthone,23 pyridine24–26 or 1,8-naphthalimide27 derivatives. However, it is a constant challenge to develop more “greener” sensitizers derived from natural resources that are non-toxic and highly effective and can be successfully exploited in biomedical applications.Carbon dots are one group among innovative materials that are attracting more and more scientific attention.28,29 These are materials that exhibit unique optical,30 photoluminescence31,32 and chemiluminescence properties.29,33,34 Due to their numerous advantages, including exceptional water solubility,35 biocompatibility,36 excellent chemical passivity and high photobleaching resistance,37 these materials are employed, among others, as chemical or biological sensors38 in bio-imaging39 and in biomedicine.40 The latest reports also show the elaboration of the fluorophore structures formed during the synthesis of carbon dots and their role in the fluorescence phenomena.41–45 Furthermore, as a result of CDs’ intriguing electrochemical properties, they have been applied in photocatalysis and photopolymerization processes.46 Carbon dots doped with heteroatoms have been described for the first time by Matyjaszewski et al. as photocatalysts for reversible addition–fragmentation chain transfer (RAFT) polymerization.47 Meanwhile, Strehmel et al. proposed the utilization of carbon dots in a two-component initiation system together with iodine or sulfonic salt, where CuII was used as a ppm scale catalyst for photo-ATRP (Atom Transfer Radical Polymerization) as well as for free radical photopolymerization (FRP).48 Thus, until now, the employment of nanodots in light-initiated polymerization processes has been limited to RAFT or ATRP,49i.e., general radical photopolymerization processes.
Herein, for the first time, we present the prospect of using citric acid-based carbon dots, doped with heteroatoms in the form of amino and sulphur compounds, as photosensitizers of iodine salts to initiate cationic polymerization processes. For this purpose, three types of carbon dots were fabricated CA-CDs, N-doped-CA-CDs, and N,S-doped-CA-CDs, and their synthesis and detailed purification procedure are reported. The required spectroscopic and electrochemical properties of these materials are presented. Moreover, carbon dots were employed in a binary initiation system for the cationic photopolymerization of vinyl monomers along with the cationic photopolymerization of ring-opening epoxy monomers. Additionally, the utilization of carbon dots as photosensitizers of iodine salt in radical photopolymerization processes involving the fabrication of hydrogel materials was investigated. Furthermore, the visible properties of C-dots were confirmed, and the possibility of their use as green photocatalysts was investigated. Ultimately, 3D printing experiments involving cationic photopolymerization with the utilization of an initiating system containing carbon dots for hydrogel materials were performed. The noted research gap in the form of the usage of carbon dots in cationic photopolymerization processes, along with the utilization of these materials for 3D printing, including printed hydrogels, was the motivation of this study.
Experimental
Materials
The synthesis of carbon dots was conducted using citric acid (CA) (for the fabrication of CA-CDs, CA and urea (for the fabrication of N-doped-CA-CDs), and CA and thiourea (for the fabrication of N,S-doped-CA-CDs). The following reagents were used for the carbon dot purification: 1 M NaOH and 1 M HCl aqueous solutions. All reagents were provided by Sigma Aldrich and were used as received. For photopolymerization processes, the following reagents were utilized: bis-(4-t-butylphenyl)iodonium hexafluorophosphate (Iod, Speedcure 938, Lambson, Wetherby, UK) as a commercial photoinitiator, methyl diethanolamine (MDEA, Sigma Aldrich) as a co-initiator in type-II photoinitiator systems For photopolymerization investigation, model monomers were applied: 3,4-epoxycyclohexylmethyl-3,4-epoxycyclohexane-carboxylate (CADE, Lambson, Wetherby, UK) and tri(ethylene glycol) divinyl ether (TEGDVE, Sigma Aldrich) for cationic polymerization, as well as trimethylolpropane triacrylate (TMPTA, Sigma Aldrich) for free-radical photopolymerization. Furthermore, 2-hydroxyethyl acrylate (HEA, Sigma Aldrich) was used for the preparation of photocurable hydrogels. The following additives were used to stimulate the polymerization reaction: N-vinylcarbazole (NVK, Sigma Aldrich) and tris(trimethylsilyl)silane (TTMSS, Sigma Aldrich). The chemical structures of the utilized reagents are shown in Fig. S2.†Carbon dot synthesis
A one-pot bottom-up fabrication method for the synthesis of carbon dots was developed by the standard procedure for condensation reactions:43,44 CA (0.192 g, 1 mmol) (reaction (1) in Fig. 1 and S1†); CA (0.192 g, 1 mmol) mixed with an amine precursor: urea (0.600 g, 10 mmol) (reaction (2) in Fig. 1 and S1†); and CA (0.192 g, 1 mmol) mixed with a sulphur containing precursor: thiourea (0.760 g, 10 mmol) (reaction (3) in Fig. 1 and S1†) was placed in a glass vial reactor and kept at 230 °C for 2 h (Table S1†). Reactions were carried out on a heating block with a magnetic stirrer at 100 rpm. Afterward, the products of the synthesis were cooled down to room temperature and subjected to the purification process.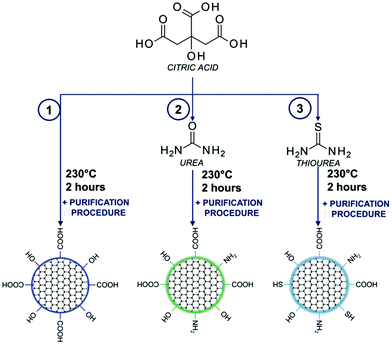 | ||
| Fig. 1 Synthesis scheme of carbon dots based on the utilization of citric acid with amino and sulphuric precursors. | ||
Carbon dot purification procedure
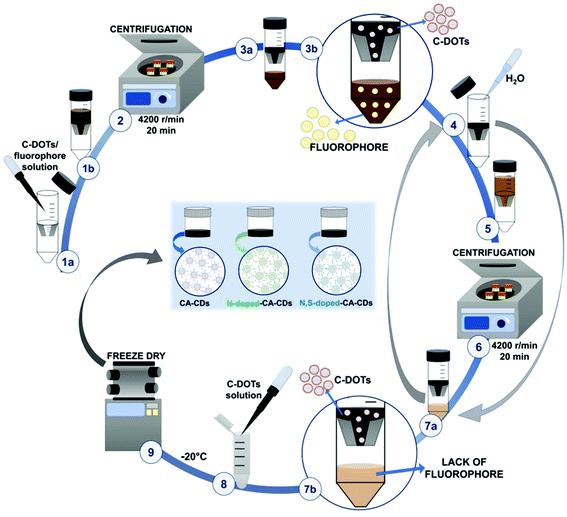
Proper purification of carbon dots was a crucial point at this stage of the investigation. Therefore, the solid particles obtained from the one-pot synthesis were treated with 1 M NaOH solution (10 mL of alkaline solution was used) and then subjected to ultrasonication for 30 minutes for dissolution. The obtained solutions were then neutralized with 1 M HCl, until the pH of the tested solution dropped down to about 7 (Fig. 2).The solution containing carbon dots, fluorophores, and other impurities was then alternately centrifuged and rinsed using ultrafiltration units (Vivaspin 20, MWCO 10 kDa – MWCO 100 kDa) to remove the fluorophores and obtain a solution containing only target CDs (Fig. 3 and S3†). Additional spectroscopic studies on the quality of the carbon dot purification procedure are shown in Fig. S4.† The fine carbon dots were then frozen and freeze-dried to provide a dry product characterized by a wadding consistency.
Determination of the size and morphology of carbon dots
The size distribution and the average size of the prepared carbon dots were directly determined in the aqueous suspension (0.1 mg mL−1) using dynamic light scattering (DLS) (Zetasizer Nano ZS instrument from Malvern). Due to significant aggregation of CDs at neutral pH, all measurements were conducted at pH 10 (NaOH was used for pH adjustment). A transmission electron microscope (TEM) of high resolution (Tecnai TF 20 X-TWIN (200 kV)) equipped with a field emission gun (FEG) was employed for the morphology analysis of the CDs. Time-resolved Tecnai TF 20 X-TWIN microscope provided 0.5 nA intensity capability in an electron beam focused on a spot of 1 nm diameter (spot resolution capability of 1 nm diameter (spot resolution ≤0.22 nm and information limit ≤0.14 nm)).Determination of the chemical bonding and chemical composition of carbon dots
XPS analyses were carried out in a PHI VersaProbeII Scanning XPS system using monochromatic Al Kα (1486.6 eV) X-rays focused to a 100 μm spot and scanned over the area of 400 μm × 400 μm. The photoelectron take-off angle was 45° and the pass energy in the analyzer was set to 117.50 eV for survey scans and 46.95 eV to obtain high energy resolution spectra for the C 1s, N 1s, S 2p, Na 1s and O 1s regions. A dual beam charge compensation with 7 eV Ar+ ions and 1 eV electrons was used to maintain a constant sample surface potential regardless of the sample conductivity. All XPS spectra were charge referenced to the unfunctionalized, saturated carbon (C–C) C 1s peak at 284.8 eV. The operating pressure in the analytical chamber was less than 3 × 10⁻⁹ mbar. Deconvolution of spectra was carried out using PHI MultiPak software (v.9.9.0.8). The spectrum background was subtracted using the Shirley method.Electrochemical properties of carbon dots
Voltammetry measurements were conducted at 25 °C using the Electrochemical Analyser M161 and the Electrode Stand M164, from MTM-ANKO, Poland with a standard three-electrode cell. Voltammograms were recorded at a scan rate of 100 mV s−1, unless stated otherwise. The working electrode was a glassy carbon electrode of 3 mm diameter (Mineral, Poland) and a platinum wire acted as an auxiliary electrode. All potentials were measured against the Ag/AgCl (3 M KCl) electrode, which was placed in a double bridge, filled with 3 M KCl solution in the upper part and a supporting electrolyte solution in a given solvent in the lower part. Two solutions were divided with a cotton wool plug and separated from the test solution with a dense ceramic frit. The potential of this reference electrode at 25 °C is +0.209 V against the standard hydrogen electrode (SHE). 0.1 M KCl in distilled water was used as the supporting electrolyte. All measurements were carried out under a dry argon (5.0 Messer) atmosphere.Standard voltammetry measurements were performed in a multi-cycle mode, with 10 cycles and 2 minutes of electrolyte mixing time between cycles. Additionally, the current background recorded for the electrolyte (0.1 M KCl in water) was mathematically subtracted from the voltammetry profiles before the signal analysis. It has been reported that CDs exhibited slow electron transfer due to structural effects such as a low edge plane content and a low specific surface area. Therefore, in order to determine the value of redox potentials on the basis of standard CD voltammograms, measured in aqueous solutions, it is necessary to analyse the first derivatives of the obtained voltammetric profiles. Due to the low intensity of the recorded signals and high noise, the determined values of the redox potentials may be burdened with a large error. Therefore, a ferro/ferricyanide redox probe for comparative purpose was used to investigate the electrochemical properties of the analysed carbon dots. Potassium ferricyanide was used as a probe (Eox = 250 mV, Ered = 180 mV). It can be noted that as the concentration of carbon dots increases, the intensity of the signals observed for potassium ferricyanide decreases. By analysing the first derivatives of the voltametric profiles recorded for carbon dots and the change in the intensity of signals recorded for potassium ferricyanide while increasing the concentration of carbon dots, it can be estimated that the oxidation potential of the analysed carbon dots is about 300 mV, while the reduction potential is about −200 mV.
Carbon dot spectroscopic characterization
All the absorption properties of carbon dots including substrates were analysed using a SilverNova TEC-X2 spectrophotometer (StellarNet, Inc., Tampa, FL, USA) in the range of 190–1100 nm. A UV/Vis deuterium/halogen light source (StellarNet, Inc., Tampa, FL, USA) in the range of 190–2500 nm was used in all experiments. Fluorescence emission and excitation spectra of CA-CDs, N-doped-CA-CDs and N,S-doped-CA-CDs were analysed using a FluoroMax-4P spectrofluorometer (Horiba, Kyoto, Japan). All spectra were recorded at varied excitation wavelengths in the range of 200–800 nm, using a slit width equal to 4 nm in each measurement, both for excitation and emission.Real-time FT-IR photopolymerization experiments
The photopolymerization process induced by light with the assistance of carbon dots was analysed by the FT-IR method in real time, using an FT-IR i10 NICOLET™ infrared spectrometer with a horizontal adapter (Thermo Scientific, Waltham, MA, USA) (Fig. S15†). Components for these experiments were prepared by dissolving appropriate amounts of the initiating system with different monomers under no-light conditions. Furthermore, the kinetics measurement included monitoring of absorbance changes at specified wavelengths corresponding to the functional group or binding of the utilized monomers. Therefore, the conversion degree was calculated using the following formula:where AreaBefore – the area of the absorbance peak corresponding to a given group or bond in the monomer before photopolymerization and AreaAfter – the area of the same absorbance peak at a given polymerization time. The wavelengths corresponding to the analysed groups or bonds during the polymerization are presented separately for each of the monomers in the further course of the investigation (Fig. S17†).
Cationic photopolymerization of vinyl monomers
For the light-induced cationic polymerization of vinyl monomers, tri(ethylene glycol) divinyl ether (TEGDVE) was mixed together with the photoinitiating system: appropriate carbon dots/iodonium salt (0.2/2 wt%) in a mass ratio to monomer content. The measurement was carried out in laminate form for 400 s. The vinyl content was continuously monitored using an infrared spectrometer FT-IR at about 1625 cm−1. As a reference, the TEGDVE monomer with 2.0 wt% of iodonium salt was used. Additionally, to increase the speed and degree of conversion of the polymerization reaction induced by light of 405 nm, an additive in the form of N-vinylcarbazole (2.0 wt%), under identical measurement conditions as above, was used.Cationic ring opening photopolymerization process of epoxy monomers (ROP)
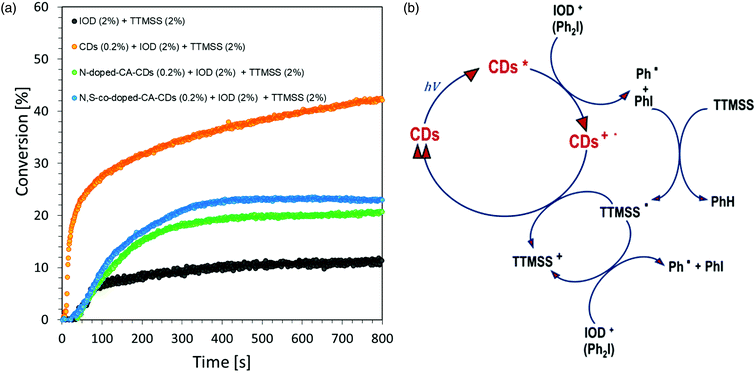
A photocurable composition made of 3,4-epoxycyclohexylmethyl-3,4-epoxycyclohexane-carboxylate (CADE) and an appropriate initiating system, IOD/TTMSS/C-dots (2/2/0.2 wt%) were prepared for monitoring ring-opening cationic photopolymerization. A drop of the mixture was placed on a BaF2 pallet (the thickness of the composition was around 25 μm). The epoxy content was monitored using an infrared spectrometer FT-IR at about 790 cm−1 for 800 s. As a reference, the epoxy monomer with 2.0 wt% of IOD and 2.0 wt% of TTMSS was used.Free-radical photopolymerization of acrylate monomers
A composition made of trimethylolpropane triacrylate TMPTA, together with a two component initiating system IOD (2 wt%) as a photoinitiator and carbon dots (0.2 wt%) as photosensitizers were prepared for the investigation of free-radical photopolymerization. A drop of the mixture was placed between two propylene films to eliminate the oxygen inhibition and then placed on a horizontal holder in an infrared spectrometer FT-IR. The thickness of the composition was around 25 μm. The content of the double bond was continuously monitored at about 1635 cm−1 for 800 s. As a reference, the TMPTA monomer with 2.0 wt% of iodonium salt was utilized.A visible photoinitiator system based on carbon dots for free-radical polymerization of the water-based coating hydrogel under air
Free-radical photopolymerization of 2-hydroxyethyl acrylate (HEA) in an aqueous environment was performed since carbon dots are known to absorb in a wide range of wavelengths;50 therefore, the possibility of using them with different light sources has been investigated. A photocurable composition was prepared using the following materials: carbon dots (0.2 wt%), bis-(4-t-butylphenyl)iodonium hexafluorophosphate, IOD (2%) and a mixture of HEA monomer and water in a 1![[thin space (1/6-em)]](https://www.rsc.org/images/entities/char_2009.gif) :
:![[thin space (1/6-em)]](https://www.rsc.org/images/entities/char_2009.gif) 1 mass ratio. The composition (0.5 mm thick) was applied on a specially prepared barium fluoride adapter (Fig. S16†), allowing the possibility of monitoring the polymerization reaction despite the presence of water. The double bond conversion was followed on an infrared spectrometer FT-IR at about 6125 cm−1. As a reference, a mixture of HEA/H2O (1
1 mass ratio. The composition (0.5 mm thick) was applied on a specially prepared barium fluoride adapter (Fig. S16†), allowing the possibility of monitoring the polymerization reaction despite the presence of water. The double bond conversion was followed on an infrared spectrometer FT-IR at about 6125 cm−1. As a reference, a mixture of HEA/H2O (1![[thin space (1/6-em)]](https://www.rsc.org/images/entities/char_2009.gif) :
:![[thin space (1/6-em)]](https://www.rsc.org/images/entities/char_2009.gif) 1) with 2.0 wt% of iodonium salt was used.
1) with 2.0 wt% of iodonium salt was used.
Photocatalytic properties of carbon dots during the free-radical polymerization of the water-based coating hydrogel
The catalytic properties of carbon dots have been confirmed following the free-radical polymerization reaction of the mixture of the HEA monomer and water (1![[thin space (1/6-em)]](https://www.rsc.org/images/entities/char_2009.gif) :
:![[thin space (1/6-em)]](https://www.rsc.org/images/entities/char_2009.gif) 1) in various systems: I. carbon dots (0.2 wt%) and bis-(4-t-butylphenyl)iodonium hexafluorophosphate, IOD (2%), II. carbon dots (0.2 wt%) and methyl diethanolamine, MDEA (2%), and III. carbon dots/IOD/MDEA (0.2/2/2 wt%). The mass ratios of the components were calculated from the quantity of the monomer–water mixture. As a reference, I, II, and III compositions without carbon dots were investigated. The kinetics of the acrylate monomer polymerization process was monitored using a Real-Time infrared spectrometer FT-IR following peak decay at 6125 cm−1 for 300 s.
1) in various systems: I. carbon dots (0.2 wt%) and bis-(4-t-butylphenyl)iodonium hexafluorophosphate, IOD (2%), II. carbon dots (0.2 wt%) and methyl diethanolamine, MDEA (2%), and III. carbon dots/IOD/MDEA (0.2/2/2 wt%). The mass ratios of the components were calculated from the quantity of the monomer–water mixture. As a reference, I, II, and III compositions without carbon dots were investigated. The kinetics of the acrylate monomer polymerization process was monitored using a Real-Time infrared spectrometer FT-IR following peak decay at 6125 cm−1 for 300 s.
3D-VAT printing of photocurable compositions
3D-VAT printouts were obtained using a laser printer (DK-8-KZ, NEW) under a laser light source @405 nm (spot diameter 50 μm) with an intensity of 90 mW cm−2. VAT photopolymerization is an additive manufacturing process in which the liquid photopolymer in a vat is selectively cured by light-activated polymerization. For experiments with 3D printing, the photocurable cationic resin was used based on the vinyl monomer (TEGDVE) and contains a photoinitiating system composed of carbon dots as photosensitizers and diphenyliodonium salts (IOD) at a concentration of 0.2/2 wt%. All obtained 3D printouts were analysed using the digital microscope DSX1000 with an objective lens DSX10-SXLOB3X with a magnification of 42–420X (Olympus, Japan).Three-dimensional printing of the hydrogel model structure
Three-dimensional hydrogels were prepared by visible LED curing of aqueous solutions containing 50% (w/w) HEA monomer with a photoinitiating system based on CDs and diphenyliodonium salt (IOD) at a concentration of 0.2/2 wt%. A predesigned hydrogel model was 3D printed using a laser printer (DK-8-KZ, NEW) under a laser light source @405 nm (spot diameter 50 μm) with an intensity of 90 mW cm−2. After 3D printing, the structures were observed under the digital microscope DSX1000 with an objective lens DSX10-SXLOB3X with a magnification of 42–420X (Olympus, Japan).Irradiation sources
For real-time FTIR experiment, the following sources of light were used: a 365 nm M365LP1 UV-LED diode (I0 = 24.8 mW cm−2, Thorlabs, Tampa, FL, USA), a 405 nm M405LP1 LED diode (I0 = 22.0 mW cm−2, Thorlabs, Tampa, FL, USA), a 415 nm M415LP1 LED diode (I0 = 24.0 mW cm−2, Thorlabs, Tampa, FL, USA) and a 450 nm M450LP1 LED diode (I0 = 27.1 mW cm−2, Thorlabs, Tampa, FL, USA). All LEDs were powered using a DC2200 controller (Thorlabs, Tampa, FL, USA). The distance between the irradiation sources and sample was 2.1 cm.Results and discussion
High-performance technologies require materials that are required for clean production and normal individual applications.51 Moreover, environmental and socio-economic sustainability based on new nanotechnologies combines the maximum efficiency with a minimum cost of substrates consumed in photopolymerization processes.52 In photocatalytic developments, the employment of carbon dots recently showed their effectiveness and efficiency.47,48 Therefore, carbon dots formed as a result of the “bottom-up” condensation reaction of citric acid with amino and sulfuric promoters41–43 appear to be a suitable alternative to current photoinitiators, guaranteeing appropriate properties for light-induced processes.In this study, we synthesized CDs via “bottom up” condensation from CA alone and using amino and sulphur dopants i.e., urea and thiourea, respectively. The reaction products were then purified to obtain structurally different CDs from citric acid containing various dopants including nitrogen and sulphur atoms (ESI†). The bottom-up approach for the fabrication of these materials needs to be carefully examined in terms of possible interactions of the dopant with citric acid. Therefore, a detailed analysis of the purification process of the synthesized CDs was conducted. Purification of the CDs is essential for removing free low-molecular compounds, ligands, or other substrates potentially triggering side effects. For this reason, we used the ultrafiltration process to purify, concentrate and separate CDs from the substrates and other small organic molecules. This study showed that CDs were treated by ultrafiltration using Vivaspin® 20 centrifugal concentrator twin vertical membranes. Due to the vertical construction of the membrane, high flow and recovery values were achieved. Noteworthy is that purification and concentration steps were performed simultaneously.
Determination of the chemical bonding and chemical composition of carbon dots
Surface concentrations of chemical bonds obtained from fitting XPS data for all analyzed samples are listed in Table 1. The C 1s spectra for all samples can be fitted with five components: the first line at 284.0 eV arising from C![[double bond, length as m-dash]](https://www.rsc.org/images/entities/char_e001.gif) C type bonds (sp2), the second line at 284.8 eV originating from C–C type carbon bonds (sp3), the third line at 286.6 eV from C–O–C and/or C–OH and/or C–NH bonds, the fourth line at 288.3 eV coming from C
C type bonds (sp2), the second line at 284.8 eV originating from C–C type carbon bonds (sp3), the third line at 286.6 eV from C–O–C and/or C–OH and/or C–NH bonds, the fourth line at 288.3 eV coming from C![[double bond, length as m-dash]](https://www.rsc.org/images/entities/char_e001.gif) O and/or O–C–O and/or N–C–O bonds and the last line centered at 289.1 eV from the O–(C–O)–O and/or N–C
O and/or O–C–O and/or N–C–O bonds and the last line centered at 289.1 eV from the O–(C–O)–O and/or N–C![[double bond, length as m-dash]](https://www.rsc.org/images/entities/char_e001.gif) O and/or shake-up satellite from aromatic-type rings.53 Spectra collected for all samples in the N 1s region show a single peak centered at 399.7 eV which originates from the imine C
O and/or shake-up satellite from aromatic-type rings.53 Spectra collected for all samples in the N 1s region show a single peak centered at 399.7 eV which originates from the imine C![[double bond, length as m-dash]](https://www.rsc.org/images/entities/char_e001.gif) N–R and/or CH2–NH2 and/or pyridine form and/or imide (C
N–R and/or CH2–NH2 and/or pyridine form and/or imide (C![[double bond, length as m-dash]](https://www.rsc.org/images/entities/char_e001.gif) O)–N–(C
O)–N–(C![[double bond, length as m-dash]](https://www.rsc.org/images/entities/char_e001.gif) O) and/or –NH–(C
O) and/or –NH–(C![[double bond, length as m-dash]](https://www.rsc.org/images/entities/char_e001.gif) O)–O or –NH– attached to the aromatic ring.53,54 Spectra collected in the O 1s region are similar for all samples and can be fitted with two lines centered at 531.2 eV and 532.8 eV. The first peak can be attributed to O
O)–O or –NH– attached to the aromatic ring.53,54 Spectra collected in the O 1s region are similar for all samples and can be fitted with two lines centered at 531.2 eV and 532.8 eV. The first peak can be attributed to O![[double bond, length as m-dash]](https://www.rsc.org/images/entities/char_e001.gif) C–N and/or C
C–N and/or C![[double bond, length as m-dash]](https://www.rsc.org/images/entities/char_e001.gif) O bonds, whereas the second to O
O bonds, whereas the second to O![[double bond, length as m-dash]](https://www.rsc.org/images/entities/char_e001.gif) C–O* and/or O–C–O and/or C–OH-type bonds.53,54 The S 2p spectra for all samples show a doublet structure (doublet separation p3/2–p1/2 equals 1.2 eV) with the main line 2p3/2 centered at 163.4 eV which indicates either C–S–C sulfide or C–SH thiol-type bonds.55,56 Sodium was found on all samples and the corresponding Na 1s spectra were fitted with the single line centered at 1071.1 eV which indicates the presence of Na+ ions in either NaOH or oxides and/or sub-oxides or its salts.56 The result of XPS analysis is shown in detail in the ESI (Fig. S6–S11†).
C–O* and/or O–C–O and/or C–OH-type bonds.53,54 The S 2p spectra for all samples show a doublet structure (doublet separation p3/2–p1/2 equals 1.2 eV) with the main line 2p3/2 centered at 163.4 eV which indicates either C–S–C sulfide or C–SH thiol-type bonds.55,56 Sodium was found on all samples and the corresponding Na 1s spectra were fitted with the single line centered at 1071.1 eV which indicates the presence of Na+ ions in either NaOH or oxides and/or sub-oxides or its salts.56 The result of XPS analysis is shown in detail in the ESI (Fig. S6–S11†).
| C | N | O | Na | S | ||||||
|---|---|---|---|---|---|---|---|---|---|---|
| Energy [eV] | 284.0 | 284.8 | 286.6 | 288.3 | 289.1 | 399.7 | 531.2 | 532.8 | 1071.1 | 163.4 |
| Sample | C![[double bond, length as m-dash]](https://www.rsc.org/images/entities/char_e001.gif) C sp2 C sp2 |
C–C sp3 | C–O–C; C–OH; C–NH | C![[double bond, length as m-dash]](https://www.rsc.org/images/entities/char_e001.gif) O; O–C–O; N–C–O O; O–C–O; N–C–O |
O–(C![[double bond, length as m-dash]](https://www.rsc.org/images/entities/char_e001.gif) O)–O shake-up O)–O shake-up |
Imine C![[double bond, length as m-dash]](https://www.rsc.org/images/entities/char_e001.gif) N–R; CH2−NH2; pyridine form N–R; CH2−NH2; pyridine form |
O![[double bond, length as m-dash]](https://www.rsc.org/images/entities/char_e001.gif) C–N; C C–N; C![[double bond, length as m-dash]](https://www.rsc.org/images/entities/char_e001.gif) O O |
O![[double bond, length as m-dash]](https://www.rsc.org/images/entities/char_e001.gif) C–O; O–C–O C–O; O–C–O |
Na+ | C–S–C; C–SH |
| CA-CDs | 31.8 | 26.8 | 4.5 | 9.2 | 2.2 | 0.3 | 13.2 | 9.4 | 2.6 | 0.0 |
| N-CA-CDs | 6.5 | 39.6 | 6.2 | 12.9 | 2.3 | 9.2 | 15.1 | 6.2 | 0.7 | 0.0 |
| N-S-CA-CDs | 0.0 | 46.3 | 8.9 | 11.2 | 2.7 | 8.8 | 14.4 | 4.0 | 2.5 | 1.2 |
Furthermore, the morphology of the CDs was imaged by transmission electron microscopy: the quantum dots were irregular in appearance (Φavg = 10 ± 5nm; Fig. 4b).
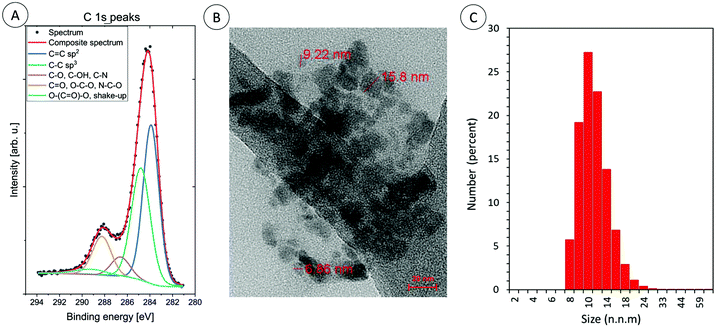 | ||
| Fig. 4 (A) The high energy resolution XPS spectra of C 1s peaks for carbon dots: CA-CDs, (B) TEM image of carbon dots: CA-CDs, and (C) DLS particle size distribution histogram of CA-CDs. | ||
High quality TEM images are difficult to obtain, because the samples at the final stage of synthesis were lyophilized and then they probably aggregated. Therefore, the size of the obtained CDs in aqueous solution was additionally measured by dynamic light scattering. The obtained results confirm that the sizes of the obtained CDs vary around 10 nm. TEM analysis, together with XPS and DLS analysis is exemplified for CA-CDs in Fig. 4.
The size distribution and the average size of the prepared carbon dots were directly determined in the aqueous suspension (0.1 mg mL−1) using dynamic light scattering (DLS) (Zetasizer Nano ZS instrument from Malvern). Due to significant aggregation of CDs at neutral pH, all measurements were conducted at pH 10 (NaOH was used for pH adjustment) (Fig. S12–S14†).
Determination of the spectroscopic properties of carbon dots
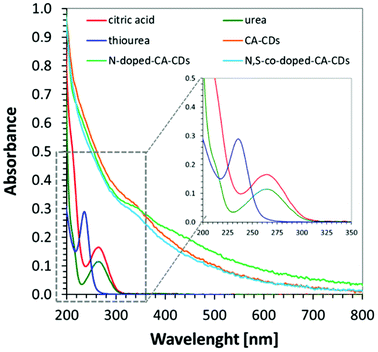
In order to determine the spectroscopic properties of the monitored carbon dots, their absorbance and fluorescence using water as a solvent were investigated. The absorbing properties of carbon dots are characteristic of this group of materials57 exhibiting strong light absorption in the UV region with a tail extending into the visible range reaching above 800 nm. The maximum absorption peak in the UV-C range may correspond to a π–π* transition involving aromatic sp2 carbons, and the tail starting from 300 nm can be assigned to an n–π* transition involving functional groups with electron lone pairs. The red-shifted absorption spectrum is directly attributed to the addition of a heteroatom e.g., nitrogen, into the carbon sp2 lattice because the nitrogen centres can inject excess electrons into the unoccupied π* orbitals and markedly reduce the HOMO–LUMO gap and the energies of the corresponding optical transitions.58 The visible absorption of CDs make them perfect materials for photocatalytic applications. For comparison, the absorbance of carbon dots was compared with the absorbance of substrates used in their synthesis in Fig. 5.The photographs of CA-CD, N-doped-CD and N,S-doped-CD aqueous solutions exposed to different conditions are presented in Fig. 6: in daylight as well as with light exposure at 254 nm and 365 nm. When using light at 365 nm, the aqueous solutions of carbon dots showed emission from blue to green luminescence, which was the most intense for carbon dots enriched with nitrogen and sulphur dopants (Fig. 6). Moreover, carbon dots are characterized by controllable photoluminescence, and their emission characteristics have a direct correlation with the excitation wavelength.59 Therefore, we have examined the emissions of the synthesized carbon dots using different excitation wavelengths in the range from approximately 400 nm to 500 nm. The results of the performed studies are presented in Fig. 6.
 | ||
| Fig. 6 Fluorescence spectra of aqueous solutions of (1) CA-CDs, (2) N-doped-CA-CDs, and (3) N,S-doped-CA-CDs determined with the use of various excitation wavelengths. | ||
Real-time FT-IR experiments
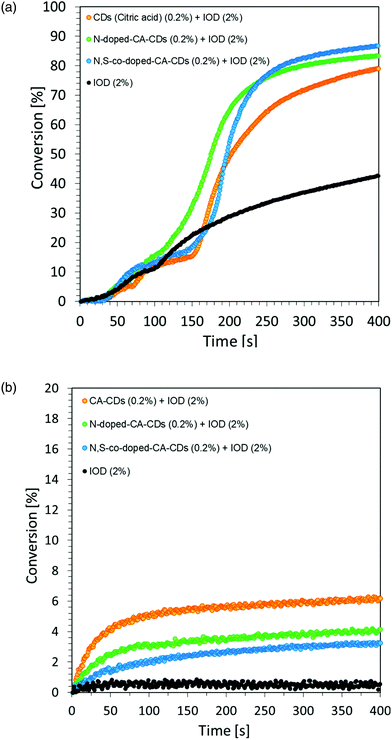
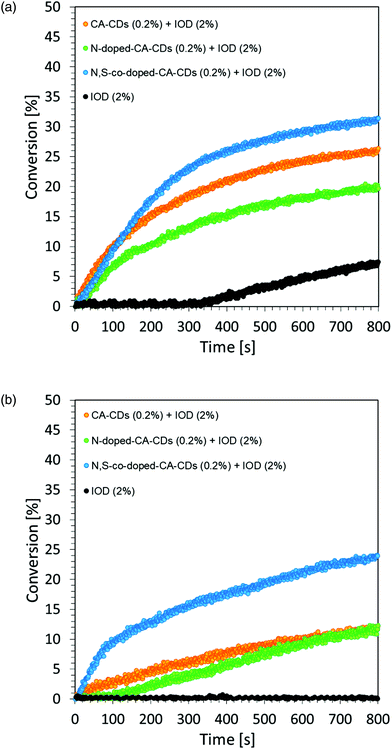
However, the spectroscopic properties of currently used commercial one component cationic photopolymerization initiators do not match the emission range of lamps used as the basic light sources in the photochemical industry. There is only a slight overlap between the absorption and emission bands. This makes the initiation process very inefficient and most of the electrical energy supplied to the lamps is wasted. Hence, the development of new cationic photoinitiators, which require shifting their absorption characteristics to longer wavelengths with increased efficiency of cationic photopolymerization processes, is a major industrial problem. Another important aspect in the exploration for new cationic photoinitiators is the reduction of the environmental impact of polymerization processes.60 Thus, the development of highly efficient cationic photoinitiators for visible light polymerization has become an extensive study focusing on synthesis through structural modifications and improvement of spectroscopic properties, as well as their application in the rapidly growing 3D printing. For this reason, this paper focused on the fundamental study of new multicomponent cationic photoinitiating systems composed of iodonium salts and appropriate bio-based photosensitizers in the form of CDs, acting via a photoinduced electron transfer process. The first step was to use CDs as a photosensitizer of iodonium salts during the chain growth cationic polymerization of the vinyl monomer TEGDVE. Considering that CDs are nanomaterials sensitive to visible light, this study has been undertaken to reveal their ability to initiate the polymerization of new photoinitiating systems based on carbon dots and iodonium salts as bimolecular photoinitiating systems (2/0.2 wt% in relation to the weight of the used monomer). As a reference, a mixture of TEGDVE monomer and iodonium salts (2 wt%) was used. The reactions were carried out in air. Conversion–time profiles using two light sources: UV-LED @365 nm and Vis-LED @405 nm are shown in Fig. 7, while the obtained conversion degrees are listed in Table 2.
| Conversion [%] | |||
|---|---|---|---|
| Acronym | EPOXY monomer (PIS with TTMSS) | VINYL monomer (PIS without NVK) | VINYL monomer (PIS without NVK) |
| @405 nm | @365 nm | @405 nm | |
| CA-CDs | 42 | 79 | 6 |
| N-Doped-CA-CDs | 21 | 83 | 4 |
| N,S-Doped-CA-CDs | 23 | 87 | 3 |
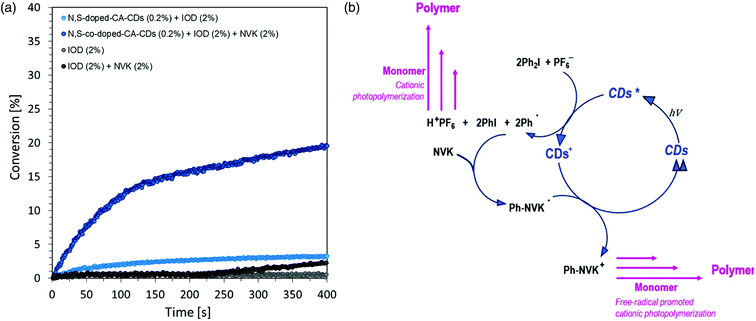
The proposed initiating system IOD/CDs effectively initiates the process of the cationic photopolymerization of the vinyl monomer TEGDVE using UV-A light, guaranteeing relatively high degrees of monomer conversion. Disturbing kinetic curves were obtained while using light from the visible range (LED @405 nm), where the proposed initiating system proved to be insufficient. Therefore, it was proposed to use an accelerating additive in the form of N-vinylcarbazole, when exposed to light at 405 nm.
The time–conversion relationship for a system containing diaryliodonium salt (IOD) (2.0 wt%), N-vinylcarbazole (2.0 wt%) and N,S-doped-CA-CDs (0.2 wt%) is shown in Fig. 8 together with the scheme of the initiation photocatalytic cycle involving CA-CDs as photocatalysts for cationic polymerization in an oxidative process at a low light intensity. The proposed solution to the problem caused by the use of light from the visible range has been effectively proved. The use of N-vinylcarbazole accelerates the IOD/CD initiating system and thus provides a high degree of conversion as well as an increased rate of the polymerization reaction (increase in curve slope).8,61,62
| Acronym | E S1* [eV] | Estimated Eox vs. Ag/AgCl [mV] | ΔGet(ox)a [eV] | Estimated Ered vs. Ag/AgCl [mV] | ΔGet(red)b [eV] |
|---|---|---|---|---|---|
a Calculated from the classical Rehm–Weller equation:  Eox (D/D˙+) – electrochemically determined oxidation potential of the electron donor. Ered (A˙−/A) – electrochemically determined reduction potential of the electron acceptor (−0.64 V for the diphenyliodonium salt vs. Ag/AgCl).64,65ES1 – singlet state energy of the sensitiser determined based on the excitation and emission spectra, while using an excitation at a wavelength of 405 nm (in accordance with the wavelength of light used in the majority of kinetic studies).
b Calculated from the equation: Eox (D/D˙+) – electrochemically determined oxidation potential of the electron donor. Ered (A˙−/A) – electrochemically determined reduction potential of the electron acceptor (−0.64 V for the diphenyliodonium salt vs. Ag/AgCl).64,65ES1 – singlet state energy of the sensitiser determined based on the excitation and emission spectra, while using an excitation at a wavelength of 405 nm (in accordance with the wavelength of light used in the majority of kinetic studies).
b Calculated from the equation:  Eox (D/D˙+) – electrochemically determined oxidation potential of the electron donor (−1.058 V for amine EDB vs. Ag/AgCl).66Ered (A˙−/A) – electrochemically determined reduction potential of the electron acceptor. ES1 – singlet state energy of the sensitiser determined based on excitation and emission spectra, while using an excitation at a wavelength of 405 nm (in accordance with the wavelength of light used in the majority of kinetic studies). Eox (D/D˙+) – electrochemically determined oxidation potential of the electron donor (−1.058 V for amine EDB vs. Ag/AgCl).66Ered (A˙−/A) – electrochemically determined reduction potential of the electron acceptor. ES1 – singlet state energy of the sensitiser determined based on excitation and emission spectra, while using an excitation at a wavelength of 405 nm (in accordance with the wavelength of light used in the majority of kinetic studies).
|
|||||
| CA-CDs | 3.05 | 300 | −2.11 | −200 | −1.99 |
| N-Doped-CA-CDs | 2.65 | 300 | −1.71 | −200 | −1.59 |
| N,S-Doped-CA-CDs | 3.05 | 300 | −2.06 | −200 | −1.99 |
Changes in the free energy of electron transfer are an important parameter (ΔGet) between the individual components of the photoinitiating system, which requires a negative value for the thermodynamically permitted processes. This value can predict the CDs’ potential applicability as the component of the photoinitiator system. The calculation could obtain the electron transfer (ΔG) value from the ΔGet equation. The values of Eox and Ered are determined by cyclic voltammetry (Fig. S20–S23†). The excited singlet state energy, ES1, could be calculated by the intersection of normalized absorption and emission spectra (Fig. S19†). It has been reported that CDs exhibited slow electron transfer due to structural effects such as low edge plane content and low specific surface area. Therefore, in order to determine the value of redox potentials on the basis of standard CD voltamperograms, measured in aqueous solutions, it is necessary to analyze the first derivatives of the obtained voltammetry profiles. Due to the low intensity of the recorded signals and high noise, the determined values of the redox potentials may be burdened with a large error. Therefore, a ferro/ferricyanide redox probe for comparative purpose was used to investigate the electrochemical properties of the analysed carbon dots. Potassium ferricyanide was used as a probe (Eox = 250 mV, Ered = 180 mV). It can be noted that as the concentration of carbon dots increases, the intensity of the signals observed for potassium ferricyanide decreases. By analysing the first derivatives of the voltammetric profiles recorded for carbon dots and the change in the intensity of signals recorded for potassium ferricyanide while increasing the concentration of carbon dots, it can be estimated that the oxidation potential of the analysed carbon dots is about 300 mV, while the reduction potential is about −200 mV. The Ered, and ES values of CDs are summarized in Table 3. The presented calculations clearly show that the electron transfer process, according to both the photo-oxidation and photo-reduction mechanisms, is thermodynamically allowed – ΔGet values are negative.
Regardless of the type of photosensitizer used, satisfactory degrees of conversion were obtained without the use of a transition metal as a catalyst for the process. The list of conversion rates obtained during the photopolymerization of the acrylic monomer is presented in Table S2.†
| Conversion during the formation of hydrogels | dα/dt [s−1] | Absorption at a given wavelength [a.u.] | Source of light [nm] | Intensity (mW cm−2) |
|---|---|---|---|---|
| 73% | 0.84 | 0.265 | @365 | 24.8 |
| 43% | 0.34 | 0.197 | @405 | 22.0 |
| 59% | 0.38 | 0.184 | @415 | 24.0 |
| 52% | 0.30 | 0.143 | @450 | 27.1 |
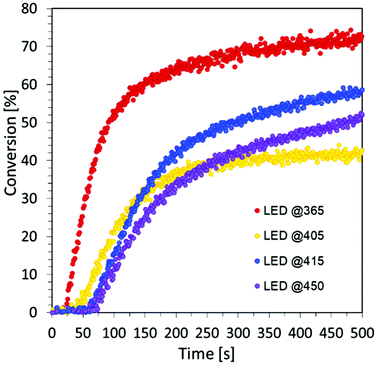
Rates of conversion were determined as the maximum slope of the conversion curves obtained by RT-FTIR. Based on the obtained results, we prove the excellent visible light absorption and photosensitizing properties of carbon dots to iodonium salts in light-emitting diodes (LEDs) at visible wavelengths under low light intensity sources during the free-radical photopolymerization processes for the production of hydrogel materials. For this purpose, a composition of HEA acrylate monomer and water in a 1![[thin space (1/6-em)]](https://www.rsc.org/images/entities/char_2009.gif) :
:![[thin space (1/6-em)]](https://www.rsc.org/images/entities/char_2009.gif) 1 mass ratio was prepared, where IOD/CDs (2/0.2 wt%) were used as the initiating system. Four light sources with different nominal powers were used and the process was conducted in air for 500 s (Fig. S7†), where the composition thickness was 0.5 mm.
1 mass ratio was prepared, where IOD/CDs (2/0.2 wt%) were used as the initiating system. Four light sources with different nominal powers were used and the process was conducted in air for 500 s (Fig. S7†), where the composition thickness was 0.5 mm.
The obtained results undoubtedly prove the excellent visible light absorption of C-dots based on the precursor of citric acid, which makes it possible to use them, among others, for the production of hydrogel materials using safe light sources from the visible range. Moreover, the analysis of the data compiled in Table 4 shows that the degree of monomer conversion decreases as the wavelength of light increases.
The main factor affecting the photopolymerization speed and maximal conversion is the light absorption capacity of photo-initiating systems and their value of the molar extinction coefficient at the working light source wavelength. Therefore, the obtained results are consistent with the decrease of the molar extinction coefficient of CDs at longer wavelengths.
In addition, we have shown that we can easily prepare hydrogels via the visible light-photopolymerization of acrylates in water. Moreover, we prove that the synthesized bio-based CDs from citric acid can play a crucial role as photosensitizers under visible light in the above-mentioned experiments. CDs can absorb visible light and transfer energy to the iodonium salt under the working light source and initiate polymerizations at room temperature, under oxygen conditions and even in an aquatic environment. This work provides new perspectives for the generation of radicals in water using bio-based materials and easy-to-set-up reaction conditions.
![[thin space (1/6-em)]](https://www.rsc.org/images/entities/char_2009.gif) :
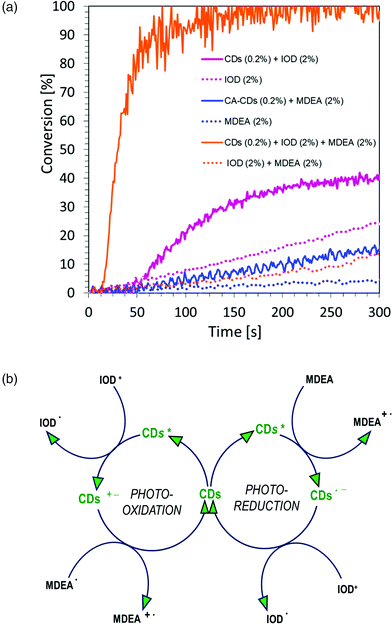
:![[thin space (1/6-em)]](https://www.rsc.org/images/entities/char_2009.gif) 1 mass ratio. The study was carried out in air for 300 s, using a LED light source at a wavelength of 405 nm in the visible range. The graphs showing the dependence of the degree of conversion on time are shown in Fig. 12a, and the values of conversion of acrylate monomers are listed in Table S3.† As can be observed, the polymerization process takes place (blue continuous line), but the monomer conversion values and the kinetics itself are not satisfactory. This has prompted us to further research whether to use carbon dots in a full catalytic cycle, in a three-component system consisting of: iodine salt IOD (2.0 wt%), amine MDEA (2.0 wt%) and CA-CDs (0.2 wt%). As a reference, the composition of HEA/water (1
1 mass ratio. The study was carried out in air for 300 s, using a LED light source at a wavelength of 405 nm in the visible range. The graphs showing the dependence of the degree of conversion on time are shown in Fig. 12a, and the values of conversion of acrylate monomers are listed in Table S3.† As can be observed, the polymerization process takes place (blue continuous line), but the monomer conversion values and the kinetics itself are not satisfactory. This has prompted us to further research whether to use carbon dots in a full catalytic cycle, in a three-component system consisting of: iodine salt IOD (2.0 wt%), amine MDEA (2.0 wt%) and CA-CDs (0.2 wt%). As a reference, the composition of HEA/water (1![[thin space (1/6-em)]](https://www.rsc.org/images/entities/char_2009.gif) :
:![[thin space (1/6-em)]](https://www.rsc.org/images/entities/char_2009.gif) 1 wt.) and IOD/MDEA (2.0/2.0 wt%) was used (Fig. 12a). The values of conversion of acrylate monomers are listed in Table S3.†
1 wt.) and IOD/MDEA (2.0/2.0 wt%) was used (Fig. 12a). The values of conversion of acrylate monomers are listed in Table S3.†
On comparing the polymerization kinetics of the acrylate monomer during the production of hydrogels for different initiating systems, it is clear that carbon dots are most effective in the full catalytic cycle, where both photo-oxidation and photo-reduction take place and the obtained conversion rate is almost full.
3D printing experiments
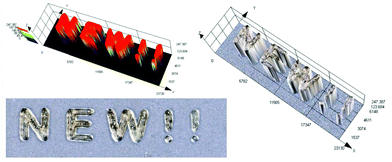
3D printing is undoubtedly a relevant topic not only among scientists, but also globally. Application of the 3D printing process is no longer limited to the chemical industry, but increasingly conquers other fields, including modern medicine.77 That is why we decided to test various carbon dots for their application in 3D printing as a part of initiation systems. In this study, we have proven for the first time the possibility of using carbon dots as an effective component of the photoinitiating system for 3D printing application, using cationic photopolymerization of vinyl monomers. For this purpose, we prepared a composition consisting of a vinyl monomer TEGDVE and the IOD/N-doped-CA-CD initiating system (2.0/0.2 wt%) and performed 3D printing under a laser source of light @405 nm (spot diameter 50 μm) with an intensity around 90 mW cm−2. The photo of the obtained printout is shown in Fig. 13 and Photo S2.† C-DOT inscription with a significant thickness of ∼0.5 mm and excellent spatial resolution (only limited by the size of the laser diode beam: spot of 50 μm) was achieved. | ||
| Fig. 13 3D inscription made by the cationic photopolymerization of a TEGDVE monomer in the presence of a two-component photoinitiating system based on N-doped-CA-CDs (0.2 wt%) and IOD (2 wt%). | ||
3D printing of hydrogels in aqueous plotting media
As mentioned above, the use of 3D printing is currently not only limited to the chemical industry, but is also increasingly used in biomedicine. Hydrogel materials can be produced through photopolymerization in several ways, e.g. vat polymerization, using fast prototyping techniques, such as photolithography or 3D printing. However, due to its high precision, high efficiency for a single product and convenient operation, 3D printing has recently become the main method of producing hydrogel materials (Photo S1†).The challenge in 3D printing of hydrogel materials is to choose the suitable photosensitive composition and the type of initiating system, which should be well soluble in an aqueous medium, ensuring the use of visible light sources. Therefore, we created a system of the acrylate monomer HEA and water in a 1![[thin space (1/6-em)]](https://www.rsc.org/images/entities/char_2009.gif) :
:![[thin space (1/6-em)]](https://www.rsc.org/images/entities/char_2009.gif) 1 mass ratio together with the initiating system IOD/CDs (2/0.2 wt%) to produce hydrogel materials with a defined structure under a laser source of light @405 nm (spot diameter 50 μm) with an intensity around 90 mW cm−2. The photos of the obtained hydrogel printout are shown in Fig. 14. In the results of this experiment, a hydrogel printout of ∼2.5 mm thickness and excellent optical resolution was obtained. Therefore, water soluble nano-photoinitiating systems based on carbon dots hold great promise for environmentally-benign synthesis of useful hydrogel materials under low intensity visible irradiation with light emitting diodes (LEDs). We believe that these results can provide insights into the research done in this field so far, which can pave the way for further progress in this topic of far-fetched social significance. Therefore, carbon dots (C-Dots) are promising new materials for the development of biocompatible photosensitizers for hydrogel production in aqueous solution.
1 mass ratio together with the initiating system IOD/CDs (2/0.2 wt%) to produce hydrogel materials with a defined structure under a laser source of light @405 nm (spot diameter 50 μm) with an intensity around 90 mW cm−2. The photos of the obtained hydrogel printout are shown in Fig. 14. In the results of this experiment, a hydrogel printout of ∼2.5 mm thickness and excellent optical resolution was obtained. Therefore, water soluble nano-photoinitiating systems based on carbon dots hold great promise for environmentally-benign synthesis of useful hydrogel materials under low intensity visible irradiation with light emitting diodes (LEDs). We believe that these results can provide insights into the research done in this field so far, which can pave the way for further progress in this topic of far-fetched social significance. Therefore, carbon dots (C-Dots) are promising new materials for the development of biocompatible photosensitizers for hydrogel production in aqueous solution.
Conclusions
Herein, the first utilization of carbon dots (CDs) as an efficient component of photoinitiating systems (PISs) and photoinitiator catalysts (PICs) for visible-light-induced cationic photopolymerization under a source of low intensity LED irradiation was investigated. A series of structurally different CDs based on citric acid as a precursor (CA-CDs) and containing heteroatom dopants including nitrogen (N-doped-CA-CDs) and sulfur atoms (N,S-co-doped-CA-CDs) were prepared via a ‘bottom-up’ pyrolysis approach. Moreover, the full path from the synthesis of citric acid-based CDs to their various applications was developed, with special attention paid to the importance of the purification process. Taking advantage of a heteroatom-modulated bottom-up synthetic protocol, CDs were obtained, enabling cationic photopolymerization processes of unsaturated monomers that undergo chain polymerization through the carbon–carbon double bonds, and cyclic monomers that undergo ring-opening polymerization (ROP). This approach links two-component photoinitiating systems (PISs) with further technologies such as coating and 3D printing based on LED sources. Additionally, photopolymerization at different wavelengths covering the electromagnetic spectrum was performed, demonstrating the ability of CDs to act as a component of visible photoinitiating systems (PISs) (Fig. S24†). An interesting aspect of this study is also the description of the 3D printing experiment of cationic photopolymerization processes initiated by PISs and PICs based on CDs, which offer new opportunities for broadening their applications. Moreover, the development of new and efficient metal-free photoinduced electron transfer (PET) photoinitiator catalyst (PIC) systems regulated by visible light based on CD structural engineering was introduced. Moreover, PICs based on CDs could be used in the production of 3D hydrogel materials using the acrylate monomer HEA and water. Thus, such systems also have great potential in biomedical applications, including the production of hydrogel materials both in situ and via 3D printing, using safe light sources in the visible range. These findings will be assisting researchers in moving forward and exploring the hidden potential of CDs for the development of new photoinitiating systems and in other areas of photochemistry, including interdisciplinary research in 3D printing, which is one of the key pillars of Industry 4.0.Conflicts of interest
There are no conflicts to declare.Acknowledgements
This research was funded by the Foundation for Polish Science (Warsaw, Poland) TEAM TECH project Grant No. TEAM TECH/2016-2/15 (POIR.04.04.00-00-204B/16-00). Additionally, the research of synthesis of CDs was supported by the Polish National Agency for Academic Exchange (The Bekker Programme No. PPN/BEK/2018/1/00460/U/00001). The authors are also grateful to Mrs Marta Gejewska from the Academic Centre for Materials and Nanotechnology (ACMiN), AGH University of Science and Technology for the TEM analysis used during this study.References
- P. Glöckner, S. Struck, T. Jung and K. Studer, Radiation Curing: Coatings and Printing Inks, Technical Basics, Applications and Trouble Shooting, 2008, vol. 3 Search PubMed.
- P. Fiedor and J. Ortyl, Materials, 2020, 13, 2951 CrossRef CAS PubMed.
- J. Olmsted, J. Phys. Chem., 1979, 83, 2581–2584 CrossRef CAS.
- A. Bagheri and J. Jin, ACS Appl. Polym. Mater., 2019, 1, 593–611 CrossRef CAS.
- M. Layani, X. Wang and S. Magdassi, Adv. Mater., 2018, 30, e1706344 CrossRef PubMed.
- A. Bagheri, K. E. Engel, C. W. A. Bainbridge, J. Xu, C. Boyer and J. Jin, Polym. Chem., 2020, 11, 641–647 RSC.
- J. Zhang and P. Xiao, Polym. Chem., 2018, 9, 1530–1540 RSC.
- E. Hola, J. Ortyl, M. Jankowska, M. Pilch, M. Galek, F. Morlet-Savary, B. Graff, C. Dietlin and J. Lalevée, Polym. Chem., 2020, 11, 922–935 RSC.
- E. Hola, M. Topa, A. Chachaj-Brekiesz, M. Pilch, P. Fiedor, M. Galek and J. Ortyl, RSC Adv., 2020, 10, 7509–7522 RSC.
- S. C. Ligon, R. Liska, J. Stampfl, M. Gurr and R. Mülhaupt, Chem. Rev., 2017, 117, 10212–10290 CrossRef CAS PubMed.
- Z. Wang, W. Huang, P. Peng and D. E. Fennell, Chemosphere, 2010, 78, 147–151 CrossRef CAS PubMed.
- W. Tomal, M. Pilch, A. Chachaj-Brekiesz, M. Galek, F. Morlet-Savary, B. Graff, C. Dietlin, J. Lalevée and J. Ortyl, Polym. Chem., 2020, 11, 4604–4621 RSC.
- W. Tomal and J. Ortyl, Polymers, 2020, 12, 1073 CrossRef CAS PubMed.
- J. W. Stansbury, J. Esthet. Restor. Dent., 2000, 12, 300–308 CrossRef CAS PubMed.
- M. E. Khosroshahi, M. Atai and M. S. Nourbakhsh, Lasers Med. Sci., 2008, 23, 399–406 CrossRef CAS PubMed.
- N. A. Peppas, J. Z. Hilt, A. Khademhosseini and R. Langer, Adv. Mater., 2006, 18, 1345–1360 CrossRef CAS.
- J. L. Ifkovits and J. A. Burdick, Tissue Eng., 2007, 13, 2369–2385 CrossRef CAS PubMed.
- R. Censi, W. Schuurman, J. Malda, G. di Dato, P. E. Burgisser, W. J. A. Dhert, C. F. van Nostrum, P. di Martino, T. Vermonden and W. E. Hennink, Adv. Funct. Mater., 2011, 21, 1833–1842 CrossRef CAS.
- G. J. Kavarnos and N. J. Turro, Chem. Rev., 1986, 86, 401–449 CrossRef CAS.
- W. Tomal, M. Pilch, A. Chachaj-Brekiesz and J. Ortyl, Catalysts, 2019, 9, 827 CrossRef CAS.
- W. Tomal, A. Chachaj-Brekiesz, R. Popielarz and J. Ortyl, RSC Adv., 2020, 10, 32162–32182 RSC.
- E. Hola, M. Pilch, M. Galek and J. Ortyl, Polym. Chem., 2020, 11, 480–495 RSC.
- E. Hola, M. Pilch and J. Ortyl, Catalysts, 2020, 10, 1–28 CrossRef.
- P. Fiedor, M. Pilch, P. Szymaszek, A. Chachaj-Brekiesz, M. Galek and J. Ortyl, Catalysts, 2020, 10, 284 CrossRef CAS.
- J. Ortyl, P. Fiedor, A. Chachaj-Brekiesz, M. Pilch, E. Hola and M. Galek, Sensors, 2019, 19, 1668 CrossRef CAS PubMed.
- M. Topa, F. Petko, M. Galek and J. Ortyl, Sensors, 2020, 20(11), 3043 CrossRef CAS PubMed.
- J. Zhang, N. Zivic, F. Dumur, P. Xiao, B. Graff, J. P. Fouassier, D. Gigmes and J. Lalevée, Polym. Chem., 2018, 9, 994–1003 RSC.
- M. L. Liu, B. B. Chen, C. M. Li and C. Z. Huang, Green Chem., 2019, 21, 449–471 RSC.
- C. Xia, S. Zhu, T. Feng, M. Yang and B. Yang, Adv. Sci., 2019, 6, 1901316 CrossRef CAS PubMed.
- M. Liu, Nanoarchitectonics, 2020, 1, 1–12 CrossRef.
- J. Wang, P. Zhang, C. Huang, G. Liu, K. C. F. Leung and Y. X. J. Wáng, Langmuir, 2015, 31, 8063–8073 CrossRef CAS PubMed.
- Y. Song, X. Yan, Z. Li, L. Qu, C. Zhu, R. Ye, S. Li, D. Du and Y. Lin, J. Mater. Chem. B, 2018, 6, 3181–3187 RSC.
- F. Yan, Y. Jiang, X. Sun, J. Wei, L. Chen and Y. Zhang, Nano Res., 2020, 13, 52–60 CrossRef CAS.
- Y. Wang, Y. Zhu, S. Yu and C. Jiang, RSC Adv., 2017, 7, 40973–40989 RSC.
- V. Strauss, J. T. Margraf, C. Dolle, B. Butz, T. J. Nacken, J. Walter, W. Bauer, W. Peukert, E. Spiecker, T. Clark and D. M. Guldi, J. Am. Chem. Soc., 2014, 136, 17308–17316 CrossRef CAS PubMed.
- J. Zhang and S. H. Yu, Mater. Today, 2016, 19, 382–393 CrossRef CAS.
- L. Li and T. Dong, J. Mater. Chem. C, 2018, 6, 7944–7970 RSC.
- V. Sharma, P. Tiwari and S. M. Mobin, J. Mater. Chem. B, 2017, 5, 8904–8924 RSC.
- H. Tao, K. Yang, Z. Ma, J. Wan, Y. Zhang, Z. Kang and Z. Liu, Small, 2012, 8, 281–290 CrossRef CAS PubMed.
- F. Chen, W. Gao, X. Qiu, H. Zhang, L. Liu, P. Liao, W. Fu and Y. Luo, Front. Lab. Med., 2017, 1, 192–199 CrossRef.
- W. Kasprzyk, S. Bednarz and D. Bogdał, Chem. Commun., 2013, 49, 6445–6447 RSC.
- W. Kasprzyk, S. Bednarz, P. Zmudzki, M. Galica and D. Bogdał, RSC Adv., 2015, 5, 34795–34799 RSC.
- W. Kasprzyk, T. Świergosz, S. Bednarz, K. Walas, N. V. Bashmakova and D. Bogdał, Nanoscale, 2018, 10, 13889–13894 RSC.
- V. Strauss, H. Wang, S. Delacroix, M. Ledendecker and P. Wessig, Chem. Sci., 2020, 11, 8256–8266 RSC.
- C. I. M. Santos, I. F. A. Mariz, S. N. Pinto, G. Gonçalves, I. Bdikin, P. A. A. P. Marques, M. G. P. M. S. Neves, J. M. G. Martinho and E. M. S. Maçôas, Nanoscale, 2018, 10, 12505–12514 RSC.
- X. Jia and X. Ji, RSC Adv., 2015, 5, 107270–107275 RSC.
- J. Jiang, G. Ye, Z. Wang, Y. Lu, J. Chen and K. Matyjaszewski, Angew. Chem., Int. Ed., 2018, 57, 12037–12042 CrossRef CAS PubMed.
- C. Kütahya, P. Wang, S. Li, S. Liu, J. Li, Z. Chen and B. Strehmel, Angew. Chem., 2020, 59, 3166–3171 CrossRef PubMed.
- Q. Wang, L. Hu, Z. Cui, P. Fu, M. Liu, X. Qiao and X. Pang, ACS Appl. Mater. Interfaces, 2020, 12, 42161–42168 CrossRef CAS PubMed.
- S. Kalytchuk, L. Zdražil, M. Scheibe and R. Zbořil, Nanoscale, 2020, 12, 8379–8384 RSC.
- K. Bazaka, M. V. Jacob and K. Ostrikov, Chem. Rev., 2016, 116, 163–214 CrossRef CAS PubMed.
- T. D. Ngo, A. Kashani, G. Imbalzano, K. T. Q. Nguyen and D. Hui, Composites, Part B, 2018, 143, 172–196 CrossRef CAS.
- H. Bennett and G. Oliver, J. Chem. Educ., 1993, 70, A25 Search PubMed.
- P. G. Rouxhet and M. J. Genet, Surf. Interface Anal., 2011, 43, 1453–1470 CrossRef CAS.
- M. Fantauzzi, B. Elsener, D. Atzei, A. Rigoldi and A. Rossi, RSC Adv., 2015, 5, 75953–75963 RSC.
- A. D. Wagner, A. V. Naumkin, A. Kraut-Vass, J. W. Allison, C. J. Powell and J. R. J. Rumble, NIST Standard Reference Database 20, http:/srdata.nist.gov/xps/ Search PubMed.
- C. Carbonaro, R. Corpino, M. Salis, F. Mocci, S. Thakkar, C. Olla and P. Ricci, C, 2019, 5, 60 CAS.
- J. Tang, J. Zhang, Y. Zhang, Y. Xiao, Y. Shi, Y. Chen, L. Ding and W. Xu, Nanoscale Res. Lett., 2019, 14, 1–10 CrossRef CAS PubMed.
- G. E. Lecroy, F. Messina, A. Sciortino, C. E. Bunker, P. Wang, K. A. S. Fernando and Y. P. Sun, J. Phys. Chem. C, 2017, 121, 28180–28186 CrossRef CAS.
- M. A. Tasdelen, J. Lalevée and Y. Yagci, Polym. Chem., 2020, 11, 1111–1121 RSC.
- J. Lalevée, M. A. Tehfe, A. Zein-Fakih, B. Ball, S. Telitel, F. Morlet-Savary, B. Graff and J. P. Fouassier, ACS Macro Lett., 2012, 1, 802–806 CrossRef.
- A. Balcerak, D. Kwiatkowska, K. Iwińska and J. Kabatc, Polym. Chem., 2020, 11, 5500–5511 RSC.
- M. A. Tehfe, J. Lalevée, X. Alionas and J. P. Fouassier, Macromolecules, 2009, 42, 8669–8674 CrossRef CAS.
- P. P. Romańczyk and S. S. Kurek, Electrochim. Acta, 2017, 255, 482–485 CrossRef.
- B. Strehmel, Z. Phys. Chem., 2014, 228, 129–153 CrossRef CAS.
- E. Andrzejewska, D. Zych-Tomkowiak, M. Andrzejewski, G. L. Hug and B. Marciniak, Macromolecules, 2006, 39, 3777–3785 CrossRef CAS.
- K. Haraguchi, J. Stem Cells Regener. Med., 2012, 8, P2–P11 CrossRef.
- M. Chen, M. Zhong and J. A. Johnson, Chem. Rev., 2016, 116, 10167–10211 CrossRef CAS PubMed.
- Q. Cao, T. Heil, B. Kumru, M. Antonietti and B. V. K. J. Schmidt, Polym. Chem., 2019, 10, 5315–5323 RSC.
- S. E. Shim, Y. Shin, J. W. Jun, K. Lee, H. Jung and S. Choe, Macromolecules, 2003, 36, 7994–8000 CrossRef CAS.
- F. Le Quéméner, D. Subervie, F. Morlet-Savary, J. Lalevée, M. Lansalot, E. Bourgeat-Lami and E. Lacôte, Angew. Chem., 2018, 130, 969–973 CrossRef.
- X. Huang, X. Wang and Y. Zhao, Dyes Pigm., 2017, 141, 413–419 CrossRef CAS.
- A. S. Hoffman, Adv. Drug Delivery Rev., 2012, 64, 18–23 CrossRef.
- R. Sanna, V. Alzari, D. Nuvoli, S. Scognamillo, S. Marceddu and A. Mariani, J. Polym. Sci., Part A: Polym. Chem., 2012, 50, 1515–1520 CrossRef CAS.
- F. Ahmadi, Z. Oveisi, M. Samani and Z. Amoozgar, Res. Pharm. Sci., 2015, 10, 1–16 CAS.
- C. Arakawa, R. Ng, S. Tan, S. Kim, B. Wu and M. Lee, J. Tissue Eng. Regener. Med., 2017, 11, 164–174 CrossRef CAS PubMed.
- A. Ghilan, A. P. Chiriac, L. E. Nita, A. G. Rusu, I. Neamtu and V. M. Chiriac, J. Polym. Environ., 2020, 28, 1345–1367 CrossRef CAS PubMed.
Footnote |
| † Electronic supplementary information (ESI) available. See DOI: 10.1039/d1py00228g |
| This journal is © The Royal Society of Chemistry 2021 |


