A proof-of-concept application of water-soluble ytterbium(III) molecular probes in in vivo NIR-II whole body bioimaging†
Yingying
Ning‡
 a,
Si
Chen‡
bc,
Hao
Chen
b,
Jing-Xiang
Wang
a,
Shuqing
He
b,
Yi-Wei
Liu
a,
Zhen
Cheng
a,
Si
Chen‡
bc,
Hao
Chen
b,
Jing-Xiang
Wang
a,
Shuqing
He
b,
Yi-Wei
Liu
a,
Zhen
Cheng
 *b and
Jun-Long
Zhang
 *a
*a
aBeijing National Laboratory for Molecular Sciences, State Key Laboratory of Rare Earth Materials Chemistry and Applications, College of Chemistry and Molecular Engineering, Peking University, Beijing 100871, P. R. China. E-mail: zhangjunlong@pku.edu.cn
bMolecular Imaging Program at Stanford (MIPS), Bio-X Program, and Department of Radiology, Canary Center at Stanford for Cancer Early Detection, Stanford University, California 94305-5344, USA. E-mail: zcheng@stanford.edu
cDepartment of Neurology, Xiangya Hospital, Central South University, Xiangya Road 88, Changsha, Hunan 410008, P. R. China
First published on 10th May 2019
Abstract
Near-infrared (NIR) emissive lanthanide (Ln) complexes are promising candidates for fluorescence imaging in the NIR-II region (1000–1700 nm) to combine the advantages of small organic molecules and inorganic metal ions. However, their metabolism in vivo and application in in vivo imaging are still unknown. In this work, we used water-soluble Yb3+ molecular probes with a quantum yield of ca. 10% in water, which showed a deep penetration (>3 mm) upon excitation at the Q band. One of the Yb3+ complexes, Yb-2, was successfully applied in high resolution non-invasive whole body, vasculature and lymph node imaging of small animals. The complex cleared from the body through hepatobiliary and renal systems, similar to most organic fluorophores. Importantly, we demonstrated the application of Yb-2 in fluorescence-guided sentinel lymph node surgery, showing the prospective application of lanthanide complexes as molecular probes in NIR-II whole body bioimaging and surgical operation.
Introduction
Fluorescence imaging allows non-invasive, sensitive and high resolution monitoring of many early events in carcinogenesis and a wide range of biological processes in vivo. Compared to traditional fluorescence imaging in the visible and NIR-I regions (400–900 nm), imaging at the second near-infrared window (NIR-II, 1000–1700 nm) dramatically reduced tissue absorption, autofluorescence and photon scattering.1,2 Consequently, fluorescence imaging in the NIR-II window can achieve deeper tissue penetration and higher spatial and temporal resolution than those in the NIR-I window.3,4 In recent years, organic molecules,5–8 carbon nanotubes,9 quantum dots10,11 and upconversion nanoparticles12–14 have been used for NIR-II in vivo imaging, particularly in the real-time vasculature visualization and removal of sentinel lymph nodes and tumors. However, organic dyes generally suffer from problems such as easy photobleaching and small Stokes shift; on the other hand, inorganic nanomaterials are limited by their unknown toxicity concerns and slow excretion pharmacokinetics arising from their sizes.15,16To circumvent the photostability of organic molecules and large size in inorganic nanoparticles, NIR-II emissive lanthanide (Ln) complexes are promising candidates due to their small sizes and metal-centered emission.17,18 These features endow them with f–f characteristic emission, large Stokes shift and high photo- and/or chemostability.19,20 However, Ln NIR luminescence is easily quenched by high energy X–H bond (X = C, N and O) vibration arising from ligands and solvents.21–23 Only a very limited number of NIR Ln molecular probes have previously been applied in cell imaging due to their low quantum yields (below 3% in water),24–28 although many visible Ln molecular probes have been investigated for bioimaging before.29–33 Even to date, in vivo imaging using NIR Ln molecular probes with antenna ligands has not been achieved for the inefficient antenna effect, although the design of NIR probes for bioanalysis started two decades ago.34–36 To overcome this challenge, we recently reported perfluorinated Yb3+ porphyrinates emitted with unprecedented high quantum yields (ca. 25%) in the NIR region (900–1100 nm).37,38 Moreover, after subsequent modifications to improve their biocompatibility, the quantum yields of Yb3+ complexes reached 5–13% in water, thus they can be applied in live cell imaging.39 Their long decay lifetimes also allowed them to be successfully applied in time-resolved fluorescence lifetime imaging recently.40 However, the behaviour of the Yb3+ complexes in vivo is still unknown. Therefore, the next endeavour is to answer the crucial questions such as whether Yb3+ porphyrinates can be employed in NIR-II in vivo whole body bioimaging, which is critical to demonstrate their potential applications as theragnostic agents eventually for clinical translation.
Herein we report a proof-of-concept work using water-soluble Yb3+ molecular probes for in vivo whole body bioimaging. According to a previous report, we synthesized cationic phosphoniums39 and anionic carboxylate Yb3+ porphyrinates40 with quantum yields of ca. 10% in water. Combining with the large extinction coefficient of the porphyrin ligand, Yb-2, with carboxylate modification, presents high in vivo luminescence and achieves high resolution vasculature imaging in small animals. By using a 1000 nm longpass filter, Yb3+ porphyrinates have been demonstrated to help the image-guided operation in the NIR-II region using mice models. Therefore, this work provides a foundation and insight into the design of NIR in vivo imaging molecular probes using emissive Ln coordination compounds and enriches the repertoire of the chemical biology of Ln compounds.
Results and discussion
According to a previous report, we prepared Yb-2 and Yb-3 as water-soluble Yb3+ porphyrinates with carboxylate and cationic phosphoniums, respectively (Fig. 1a).39,40 Ester group containing Yb-1, which is not water-soluble, was used as control. The absorption spectra of Yb3+ complexes in DMSO and H2O are similar and display an intense Soret band centered at ca. 410 nm and Q bands between 520–650 nm (Fig. 1b and S1†). It is noteworthy that the extinction coefficient (ε) of the Q band in the range of ca. 525–620 nm is larger than 104 M−1 cm−1 for Yb-2. Upon excitation at the Soret or Q band, Yb-1–3 exhibited intense characteristic 2F5/2 → 2F7/2 transition bands of Yb3+ at 900–1100 nm. The fluorescence quantum yields of Yb-1–3 in DMSO were ca. 20–22%, with long decay lifetimes of ca. 205–220 μs (Fig. S2†). Importantly, compared to Yb-3 (ΦYb = 5.1%, τobs = 56 μs in H2O), Yb-2 presented a higher quantum yield (10%, Fig. 1c) and lifetime (140 μs) in H2O (Fig. S3†), with the brightness (ε*Φ) of ca. 103 M−1 cm−1. Although complex Yb-2 is pH-sensitive, it still maintains a high luminescence and lifetime (100 μs) in serum. For Yb-3, the NIR emission is not pH-sensitive (Fig. S4†). More importantly, from the NIR-II images in water (Fig. 1d), we can observe a strong NIR-II luminescence from Yb-2 and Yb-3 even under the excitation at 520 nm (Q band).Yb-2 and Yb-3 showed high stability in water, phosphate buffer saline (PBS), and fetal bovine serum (FBS) under basic and acidic conditions (Fig. S5 and 6†). Importantly, we found that the complexes showed significantly higher photostability than a commercial NIR fluorophore (Cy5.5), when taking Yb-2 as an example (Fig. S7†). Although the complexes showed lower NIR brightness than that of Cy 5.5 (ca. 104 M−1 cm−1), they are still promising for in vivo imaging due to their strong resistance to photobleaching. The standard CCK-8 assay also indicated the low dark cytotoxicity and photocytotoxicity of Yb-2 and Yb-3 towards HeLa cells (Fig. S8†).
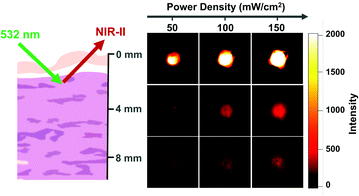
As Yb-2 shows a higher NIR quantum yield than Yb-3, before its application in in vivo bioimaging, we investigated the NIR-II penetration depth by covering pork of different thicknesses (0, 4 and 8 mm) in the water solution of Yb-2 as an example. As shown in Fig. 2, upon excitation at the Q band (532 nm), the NIR-II luminescence signals decreased with the increasing pork thickness and decreasing excitation laser power. However, the signals were still collected even with the block of 8 mm pork and using 50 mW cm−2 excitation laser power, which should benefit from the high luminescence of Yb-2. These results strongly demonstrate the deep penetration ability of the Yb-2 luminescence in the NIR-II region.
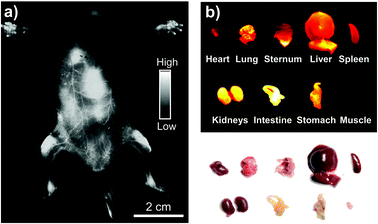
Based on in vitro results, we then performed whole-body NIR-II imaging of C57BL/6 mice with the injection of Yb-2 using a 1000 nm longpass filter under the excitation of a 520 nm laser. Immediately after tail vein injection, superior vasculature and whole body imaging were visualized from the surrounding background tissue due to the reduced scattering, tissue absorption and autofluorescence in the NIR-II window, as shown in Fig. 3. After 12 h post-injection, an ex vivo biodistribution study was performed to evaluate the biodistribution of the complex in the major organs. The results showed that Yb-2 mainly accumulated in kidneys and intestines. A small fraction of probe signal was also detected in the liver and no signals were observed in muscles, matching with the in vivo fluorescence results. These indicate that the clearance routes of the Yb3+ complexes are through both hepatobiliary and renal systems, similar to most organic fluorophores.1,41 NIR-II fluorescence images of the 143B osteosarcoma tumor-bearing mice were also captured after injecting Yb-2 intravenously and no osteosarcoma fluorescence images were observed (Fig. S9†). This indicated that the complexes still need to be further modified for their application in tumor targeting. However, after 36 h tail vein injection, imaging of the femoral artery and major artery could still be performed (Fig. S10†), suggesting the long blood-circulation half-life of Yb-2. The high stability and long excretion time provide the possibility of utilizing the Yb3+ complexes for real-time visualization in long-time surgical operation, clinical diagnoses and biopsies.
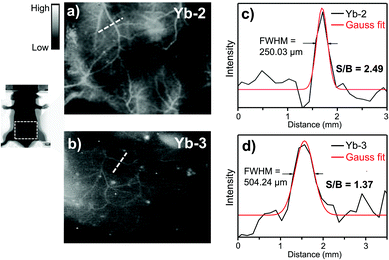
Then we compared the NIR-II in vivo imaging resolution between Yb-2 and Yb-3 under the same conditions. Immediately after tail vein injection (150 μL, 3 mg ml−1), NIR fluorescence images of the mice were captured. As shown in Fig. 4, the NIR-II image using Yb-2 (Fig. 4a) displayed more small vessels compared to that obtained by Yb-3 (Fig. 4b). The Gaussian-fit of the vessel FWHM (full width at half maxima) width is ca. 250.03 μm, with the signal-to-background ratio (SBR) of 2.49 ± 0.3 (Fig. 4c). However, compared to Yb-2, the NIR-II image of blood vessels using Yb-3 showed a significant lower resolution (FWHM = 504.24 μm) and signal-to background ratio (1.37 ± 0.1, Fig. 4d), likely due to the lower NIR quantum yield. This indicates the importance of NIR quantum yields in in vivo imaging resolution in the NIR-II region. Although the value of signal to background ratio is still slightly lower than that obtained using NIR-II luminescent organic molecules,7,42 which should be due to the visible excitation wavelength, this can be improved by precise modulation of the porphyrin structures in the future.24,43
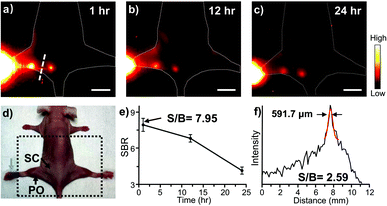
Considering the higher resolution and SBR of Yb-2 than Yb-3, we chose Yb-2 for further in vivo experiments. Yb-2 was then injected in the footpads of nude mice at a prone position to explore its application in lymphoscintigraphy. One hour after the injection, high-bright contrast of the lymphatic vasculature and nodes was visualized clearly (Fig. 5). The popliteal lymph node-to-background ratios were observed to be 7.95 ± 0.3 and remained as high as 6.8 ± 0.2 even after 12 h injection. Moreover, the NIR-II measured lymph vessel had a Gaussian-fit diameter of ca. 591.7 μm and a SBR of ca. 2.59 ± 0.1 at 1 h, reflecting the transportation of the complexes through the lymphatic system. This revealed the potential application of the Yb3+ complexes in lymph related diagnoses and surgical operation.
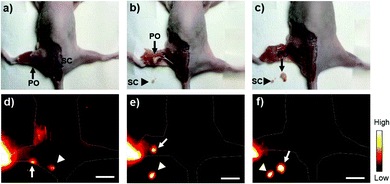
NIR-II fluorophores have shown advantages in the real-time removal of sentinel lymph nodes and tumors at a higher spatial and temporal resolution, which is useful in “imaging-guided-operation”.1,2 Due to the high popliteal lymph node-to-tissue ratios of Yb-2, we then carried out the surgical resection of popliteal and sacral lymph nodes under the guidance of NIR-II imaging. As shown in Fig. 6, distinguished by the higher fluorescence intensity, the popliteal and sacral lymph nodes can be easily and clearly identified and dissected at their prone position under the NIR-II imaging, successfully mimicking the standard SLNB procedure of clinical cancer surgery. Importantly, after the lymph nodes were resected, the operative field was clearly identified with NIR-II imaging, proving that no lymph nodes remained.
Conclusions
Taken together, we utilized highly luminescent water-soluble β-fluorinated Yb3+ complexes for in vivo NIR-II whole body bioimaging. Because of the deep penetration of the Yb3+ luminescence, the complex Yb-2 was successfully applied in the noninvasive imaging of mice blood and lymphatic vasculatures and image-guided sentinel lymph node surgery in the NIR-II region, achieving a high signal-to-noise ratio. The metabolism mechanism of the Yb3+ complexes in vivo is similar to that of small organic molecules, excluding the slow excretion disadvantage of nanoparticles. As the luminescence of the lanthanide complex is metal-centered, it possesses higher photostability and environment irrelevant emission bands than traditional organic dyes. These results indicate that lanthanide complexes are highly promising and clinically translatable NIR-II fluorescence probes, paving a way to the design of metal coordination complexes for NIR-II fluorescence imaging and the study of NIR Ln3+in vivo biology. Red-shifting the excitation wavelength to the NIR region and achieving tumor targeting are highly desirable in the next step, which are also currently under exploration in our lab.Experimental section
General materials and methods
Unless otherwise stated, all reactions were performed under an inert atmosphere of nitrogen. UV-vis spectra were recorded on an Agilent 8453 UV-vis spectrometer equipped with an Agilent 89090A thermostat (±0.1 °C) at 25 °C. HeLa cells were obtained from the Peking University Health Science Center and incubated in complete medium (Dulbecco's modified Eagle's Medium, supplemented with 10% fetal bovine serum (FBS) and 1% penicillin–streptomycin) at 37 °C in an atmosphere containing 5% CO2. Eight-week-old male C57BL/6 mice and nude mice were obtained from Charles River for animal studies and all animal procedures were performed under the approval of Stanford University's Administrative Panel on Laboratory Animal Care. For the optical measurements in liquid solution, spectroscopic-grade dimethyl sulfoxide was used as purchased from Alfa-Aesar. H2O was obtained from Milli-Q integral. Yb-1, Yb-2 and Yb-3 were synthesized according to literature methods.39,40Measurement of photophysical properties
Emission and excitation spectra and lifetimes were measured on an Edinburgh Analytical Instruments FLS980 lifetime and steady state spectrometer equipped with a 450 W Xe lamp, a 60 W microsecond flash lamp, PMT R928 for visible emission spectra, HAMAMATSU R5509-73 PMT with a C9940-02 cooler for NIR emission spectra and luminescence lifetime. Excitation and emission spectra were corrected for instrumental functions (including the correction for the detector, gratings etc.). Quantum yields were determined using a comparative method,44 similar to previous studies.39 The estimated error for the quantum yield measurements is 15%.Cytotoxicity assay
HeLa cells were seeded in flat-bottomed 96-well plates, 104 cells per well, with 200 μL complete culture media in the dark for 24 h. Cells were incubated with 1–16 μM complexes for another 24 h in the dark while wells containing no cells were set as the controls. (For the measurement of photocytotoxicity: after washing three times with PBS, the cells were irradiated for 30 min in 100 μL PBS under the light irradiation (400–700 nm) with the same dose of light (6.5 mW cm−2) for 30 min. Then PBS was replaced by 200 μL fresh culture media.) After culturing for 24 h, the cells were washed three times with PBS. Then 10 μL Cell Counting Kit-8 (CCK-8) solution and 90 μL PBS were added per well. After 30 min, the absorbance at 450 nm was read using a 96-well plate reader. The viability of HeLa cells was calculated by the following equation:| CV = (As – Ab)/(Ac − Ab) × 100% | (1) |
CV stands for the viability of cells, As, Ac and Ab stand for the absorbance of cells containing the studied complexes, cell control (no treated cells) and blank control (wells containing neither cells nor the studied complexes).
In vivo NIR-II fluorescence imaging
Mice were placed on a stage with a venous catheter for injection of contrast and imaging agents, and anesthesized using a 2 L min−1 oxygen flow with 2% isoflurane. The excitation laser was a 520 nm laser diode at a power density of 0.3 W cm−2 and emission was collected using a two-dimensional InGaAs array (Princeton Instruments) with a 1000 nm longpass filter. A lens set was used to obtain tunable magnifications ranging from 1× (whole body) to 2.5× (high magnification) magnification by changing the relative position of two NIR achromats (200 mm and 75 mm, Thorlabs). The exposure time for all images was 1000–3000 ms and images were processed with ImageJ.Ex vivo biodistribution analysis
12 h after injection of Yb-2, nude mice were sacrificed and the major organs and tissues were collected. Then the NIR-II fluorescence images were obtained using a home-built NIR-II fluorescence imaging system with an InGaAs camera under illumination of a 520 nm laser diode at a power density of roughly 50 mW cm−2 and an exposure time of 500 ms.Conflicts of interest
There are no conflicts to declare.Acknowledgements
We acknowledge the financial support from the National Key Basic Research Support Foundation of China (2015CB856301), the National Scientific Foundation of China (Grant No. 21778002, 21571007, 21861162008 and 81301160), the Office of Science (BER), the U.S. Department of Energy (DE-SC0008397), and the NCI of Cancer Nanotechnology Excellence Grant CCNE-TR U54 CA119367, CA151459.Notes and references
- G. Hong, A. L. Antaris and H. Dai, Nat. Biomed. Eng., 2017, 1, 0010 CrossRef.
- Q. Miao and K. Pu, Adv. Mater., 2018, 30, 1801778 CrossRef PubMed.
- S. He, J. Song, J. Qu and Z. Cheng, Chem. Soc. Rev., 2018, 47, 4258–4278 RSC.
- Y. Jiang and K. Pu, Adv. Biosyst., 2018, 2, 1700262 CrossRef.
- A. L. Antaris, H. Chen, K. Cheng, Y. Sun, G. Hong, C. Qu, S. Diao, Z. Deng, X. Hu, B. Zhang, X. Zhang, O. K. Yaghi, Z. R. Alamparambil, X. Hong, Z. Cheng and H. Dai, Nat. Mater., 2016, 15, 235–242 CrossRef CAS PubMed.
- E. D. Cosco, J. R. Caram, O. T. Bruns, D. Franke, R. A. Day, E. P. Farr, M. G. Bawendi and E. M. Sletten, Angew. Chem., Int. Ed., 2017, 56, 13126–13129 CrossRef CAS PubMed.
- Q. Yang, Z. Hu, S. Zhu, R. Ma, H. Ma, Z. Ma, H. Wan, T. Zhu, Z. Jiang, W. Liu, L. Jiao, H. Sun, Y. Liang and H. Dai, J. Am. Chem. Soc., 2018, 140, 1715–1724 CrossRef CAS PubMed.
- Y. Jiang, P. K. Upputuri, C. Xie, Y. Lyu, L. Zhang, Q. Xiong, M. Pramanik and K. Pu, Nano Lett., 2017, 17, 4964–4969 CrossRef CAS PubMed.
- H. Gong, R. Peng and Z. Liu, Adv. Drug Delivery Rev., 2013, 65, 1951–1963 CrossRef CAS PubMed.
- C. Chen, P. Zhang, G. Gao, D. Gao, Y. Yang, H. Liu, Y. Wang, P. Gong and L. Cai, Adv. Mater., 2014, 26, 6313–6317 CrossRef CAS PubMed.
- M. Sakiyama, H. Sugimoto and M. Fujii, Nanoscale, 2018, 10, 13902–13907 RSC.
- Y. Lu, J. Lu, J. Zhao, J. Cusido, F. M. Raymo, J. Yuan, S. Yang, R. C. Leif, Y. Huo, J. A. Piper, J. Paul Robinson, E. M. Goldys and D. Jin, Nat. Commun., 2014, 5, 3741 CrossRef CAS PubMed.
- W. Zheng, D. Tu, P. Huang, S. Zhou, Z. Chen and X. Chen, Chem. Commun., 2015, 51, 4129–4143 RSC.
- Y. Fan, P. Wang, Y. Lu, R. Wang, L. Zhou, X. Zheng, X. Li, J. A. Piper and F. Zhang, Nat. Nanotechnol., 2018, 13, 941–946 CrossRef CAS PubMed.
- I. Martinić, S. V. Eliseeva and S. Petoud, J. Lumin., 2017, 189, 19–43 CrossRef.
- E. Thimsen, B. Sadtler and M. Y. Berezin, Nanophotonics, 2017, 6, 1043–1054 CAS.
- J.-C. G. Bünzli, J. Lumin., 2016, 170, 866–878 CrossRef.
- C. G. Ma, M. G. Brik, D. X. Liu, B. Feng, Y. Tian and A. Suchocki, J. Lumin., 2016, 170, 369–374 CrossRef CAS.
- D. Parker, in Handbook on the Physics and Chemistry of Rare Earths, Elsevier, 2016, vol. 50, pp. 269–299 Search PubMed.
- M. Sy, A. Nonat, N. Hildebrandt and L. J. Charbonniere, Chem. Commun., 2016, 52, 5080–5095 RSC.
- G. Mancino, A. J. Ferguson, A. Beeby, N. J. Long and T. S. Jones, J. Am. Chem. Soc., 2005, 127, 524–525 CrossRef CAS PubMed.
- C. Doffek, N. Alzakhem, C. Bischof, J. Wahsner, T. Guden-Silber, J. Lugger, C. Platas-Iglesias and M. Seitz, J. Am. Chem. Soc., 2012, 134, 16413–16423 CrossRef CAS PubMed.
- W. Wu, X. Zhang, A. Y. Kornienko, G. A. Kumar, D. Yu, T. J. Emge, R. E. Riman and J. G. Brennan, Inorg. Chem., 2018, 57, 1912–1918 CrossRef CAS PubMed.
- S. Luo, E. Zhang, Y. Su, T. Cheng and C. Shi, Biomaterials, 2011, 32, 7127–7138 CrossRef CAS PubMed.
- A. D'Aleo, A. Bourdolle, S. Brustlein, T. Fauquier, A. Grichine, A. Duperray, P. L. Baldeck, C. Andraud, S. Brasselet and O. Maury, Angew. Chem., Int. Ed., 2012, 51, 6622–6625 CrossRef PubMed.
- A. Foucault-Collet, K. A. Gogick, K. A. White, S. Villette, A. Pallier, G. Collet, C. Kieda, T. Li, S. J. Geib, N. L. Rosi and S. Petoud, Proc. Natl. Acad. Sci. U. S. A., 2013, 110, 17199–17204 CrossRef CAS PubMed.
- A. Foucault-Collet, C. M. Shade, I. Nazarenko, S. Petoud and S. V. Eliseeva, Angew. Chem., Int. Ed., 2014, 53, 2927–2930 CrossRef CAS PubMed.
- I. Martinic, S. V. Eliseeva, T. N. Nguyen, V. L. Pecoraro and S. Petoud, J. Am. Chem. Soc., 2017, 139, 8388–8391 CrossRef CAS PubMed.
- M. A. Alcala, C. M. Shade, H. Uh, S. Y. Kwan, M. Bischof, Z. P. Thompson, K. A. Gogick, A. R. Meier, T. G. Strein, D. L. Bartlett, R. A. Modzelewski, Y. J. Lee, S. Petoud and C. K. Brown, Biomaterials, 2011, 32, 9343–9352 CrossRef CAS PubMed.
- E. M. Surender, S. Comby, B. L. Cavanagh, O. Brennan, T. C. Lee and T. Gunnlaugsson, Chem, 2016, 1, 438–455 CAS.
- W. Yang, L. M. Fu, X. Wen, Y. Liu, Y. Tian, Y. C. Liu, R. C. Han, Z. Y. Gao, T. E. Wang, Y. L. Sha, Y. Q. Jiang, Y. Wang and J. P. Zhang, Biomaterials, 2016, 100, 152–161 CrossRef CAS PubMed.
- H. Ma, B. Song, Y. Wang, D. Cong, Y. Jiang and J. Yuan, Chem. Sci., 2017, 8, 150–159 RSC.
- A. T. Frawley, H. V. Linford, M. Starck, R. Pal and D. Parker, Chem. Sci., 2018, 9, 1042–1049 RSC.
- S. Comby and J. C. G. Bünzli, Lanthanide near-infrared luminescence in molecular probes and devices, Elsevier, Amsterdam, 2007 Search PubMed.
- V. Pansare, S. Hejazi, W. Faenza and R. K. Prud'homme, Chem. Mater., 2012, 24, 812–827 CrossRef CAS PubMed.
- S. J. Bradberry, A. J. Savyasachi, M. Martinez-Calvo and T. Gunnlaugsson, Coord. Chem. Rev., 2014, 273–274, 226–241 CrossRef CAS.
- J. Y. Hu, Y. Ning, Y. S. Meng, J. Zhang, Z. Y. Wu, S. Gao and J. L. Zhang, Chem. Sci., 2017, 8, 2702–2709 RSC.
- J. Y. Hu, Z. Y. Wu, K. Chai, Z. S. Yang, Y. S. Meng, J. Zhang and J. L. Zhang, Inorg. Chem. Front., 2017, 4, 1539–1545 RSC.
- Y. Ning, J. Tang, Y. W. Liu, J. Jing, Y. Sun and J. L. Zhang, Chem. Sci., 2018, 9, 3742–3753 RSC.
- Y. Ning, S. Cheng, J.-X. Wang, Y.-W. Liu, W. Feng, F. Li and J.-L. Zhang, Chem. Sci., 2019, 10, 4227–4235 RSC.
- F. Ding, Y. Zhan, X. Lu and Y. Sun, Chem. Sci., 2018, 9, 4370–4380 RSC.
- Z. M. Tao, G. S. Hong, C. Shinji, C. X. Chen, S. Diao, A. L. Antaris, B. Zhang, Y. P. Zou and H. J. Dai, Angew. Chem., Int. Ed., 2013, 52, 13002–13006 CrossRef CAS PubMed.
- R. Xiong, D. Mara, J. Liu, R. Van Deun and K. E. Borbas, J. Am. Chem. Soc., 2018, 140, 10975–10979 CrossRef CAS PubMed.
- H. J. Yvon, A Guide to Recording Fluorescence Quantum Yields, HORIBA Jobin Yvon Inc, Stanmore, Middlesex, UK, 2012.
Footnotes |
| † Electronic supplementary information (ESI) available. See DOI: 10.1039/c9qi00157c |
| ‡ These authors contributed equally. |
| This journal is © the Partner Organisations 2019 |


![[thin space (1/6-em)]](https://www.rsc.org/images/entities/char_2009.gif) 000,
000, 