Size controlled synthesis of highly dispersed anatase/rutile nanoparticles with photocatalytic activity toward salicylic acid degradation
Juliana
Martins de Souza e Silva
,
Murilo
Pastorello
,
Mathias
Strauss
,
Camila Marchetti
Maroneze
,
Fernando Aparecido
Sigoli
,
Yoshitaka
Gushikem
and
Italo Odone
Mazali
*
Functional Materials Laboratory, Institute of Chemistry, University of Campinas, UNICAMP, P.O. Box 6154, 13083-970, Campinas, SP, Brazil. E-mail: mazali@iqm.unicamp.br; Tel: +55 19 35213164; Fax: +55 19 35213023
First published on 20th April 2012
Abstract
TiO2 nanocrystals supported in SBA-15 pores were prepared by a simple route of successive cycles of impregnation of SBA-15 with titanium(IV) di-(n-propoxy)-di-(2-ethylhexanoate) followed by thermal treatment. Anatase and rutile phases were identified by XRD in the materials obtained after cycles 1, 3, 5, 7 and 10. Raman scattering combined with XRD and TEM shows that titania is in a nanometric regime. Increases in the size of the titania nanocrystals, as well as increases in the TiO2 content in the final material (XRF), occur after successive cycles. SAXS and N2 sorption indicate that the nanocrystals are formed inside the SBA-15 mesopores, which remain unblocked even after 10 cycles. UV-Vis (DRS) spectroscopy indicates important changes in electronic properties. The ability of SBA-15-supported titania nanocrystals to photodegrade salicylic acid was tested. There is a clear relation between the TiO2 nanoparticle size and the photocatalytic activity. Among all samples tested, the best result was obtained for the materials with the highest band-gaps and with the smallest sized titania.
Introduction
The quest for nanoscale architectures has attracted important world-wide attention over recent decades. The synthesis and study of the so-called nanomaterials has become a major interdisciplinary area of research, because of the unique physicochemical, electronic and mechanical properties resulting from their small dimensions. Among all the nanomaterials being studied recently, nanometric semiconductors constitute a promising class that are being employed for several potential applications in the fields of energy conversion1 and magnetism2 and have shown good perspectives in the field of catalysis.3,4 In the nanometric semiconductors class, nano-TiO2 is one of the most investigated, because of its low cost and low toxicity, water insolubility and high physical and chemical stabilities.5,6Many synthetic techniques to prepare semiconductor nanoparticles have been developed and much of the research concerning nanoparticle synthesis is focused on methodologies for tuning their sizes7 and for stabilizing their high surface energies, thus reducing their tendency towards aggregation. One important route for preparing stabilized nanoparticles is to bind them to solid substrates. Among the several available substrates, mesoporous silica has the benefit of having high mechanical and chemical stability; and high specific surface area. Particularly, the stabilization of TiO2 nanoparticles in mesoporous silica substrates has the additional advantage of promoting the close interaction between titania and silica, synergistically combining the distinct properties of the individual components.8,9
In this work, a simple method to prepare a mesoporous silica (SBA-15) with its pores decorated with highly dispersed and stabilized TiO2 anatase–rutile nanoparticles with tunable sizes is described. Considering that photocatalytic processes on nanometric TiO2 supported in silica have been extensively studied from the standpoint of solar energy utilization and the remediation of water and gas streams polluted with low concentrations of toxic organic molecules,10,11 materials prepared and characterized in the present work were tested as catalysts for the photodegradation of a probe pollutant, salicylic acid. Characterizations show that the materials prepared fit two of the promising routes to enhance the photocatalytic activity of TiO2, which are to engineer a polymorph composition12 of anatase and rutile; and to prepare a silica–titania composition.13 Additionally, the materials here described show TiO2 nanoparticles immobilized into porous matrices, which seems to be an adequate approach to overcome the limitations related to the use of nanoparticles in catalysis, such as their tendency towards agglomeration (which makes substrate access to catalytic sites difficult) and difficulties related to catalyst separation and reuse.
Experimental
SBA-15 synthesis
The SBA-15 synthesis was based on a procedure described elsewhere.14 4 g of pluronic P123 (Mav = 5800, EO20PO70EO20) was dissolved in 150 mL of an HCl aqueous solution (1.6 mol L−1) at 313 K and 7.7 g of tetraethyl orthosilicate (TEOS) was added. The suspension was stirred for 24 h at 313 K, transferred into a Teflon®-lined stainless steel autoclave and heated at 373 K for 24 h. The solid obtained was filtered, washed, and dried at 373 K for 8 h and finally calcined at 773 K (5 K min−1) under a synthetic air flux for 6 h for the removal of organics. The SBA-15 was stored under ambient conditions prior to further use.TiO2 nanoparticle synthesis in the SBA-15 matrix
TiO2 precursor titanium(IV) di-(n-propoxy)-di-(2-ethylhexanoate), from now on named Ti(OnPr)2(hex)2, was prepared according to a procedure described elsewhere.15 Titanium n-propoxide and 2-ethyl-hexanoic acid reacted according to eqn (1), under reflux at 373 K in an inert atmosphere. The reaction by-product, 1-propanol, was removed by vacuum distillation. The temperature of Ti(OnPr)2(hex)2 degradation was determined by thermogravimetry and occurs at 823 K.| Ti[O(CH2)2CH3]4(l) + 2C7H15COOH(l) → Ti[(CH2)2CH3]2(OCOCHCH2CH3(CH2)3CH3)2 + 2CH3(CH2)OH | (1) |
For the preparation of SBA-15 decorated with TiO2 nanoparticles, there is no need for a previous dehydration procedure. Thus 2 g of SBA-15 was added to 30 mL of Ti(OnPr)2(hex)2 solution (0.75 mol L−1 in hexane) and the suspension was kept under stirring for 8 h at ambient conditions. Thereafter, the SBA-15 was filtered and copiously washed with hexane to remove excess precursor. The solid obtained was immediately submitted to thermal treatment at 1023 K (5 K min−1) under static air for 8 h to guarantee the complete degradation of Ti(OnPr)2(hex)2. This procedure is called an impregnation–decomposition cycle (IDC) and resulted in SBA-15–1TiO2. The IDC was repeated, resulting in SBA-15–xTiO2, with x corresponding to the final IDC number, equal to 3, 5, 7 or 10 times. All SBA-15–xTiO2 samples, independent of the number of IDC, were submitted to thermal treatment for a total of 80 h at 1023 K.
Photocatalytic tests
The photocatalytic activities of the SBA-15–xTiO2 samples under UV light were evaluated using salicylic acid as a model pollutant. In all experiments, the amount of TiO2 was normalized to 4 mg per 50 mL of substrate solution. In a typical experiment, a suspension of catalyst in 50 mL of salicylic acid solution (50 mmol L−1) was sonicated for 30 min to allow for the diffusion of salicylic acid into the SBA-15 pores and guarantee the equilibrium of adsorption–desorption of salicylic acid over the catalyst surface. The suspension of catalyst in salicylic acid was then transferred to a reactor (5 cm diameter) at 298 K located 8 cm from an uncapped high pressure mercury lamp (125 W). The suspension was magnetically stirred and bubbled (0.2 L min−1) with synthetic air during the photodegradation experiment. Aliquots for the kinetic study were centrifuged and analyzed by UV-vis spectroscopy using a HP8354 UV-vis spectrometer. The conversion of salicylic acid to its degradation products was monitored by the band intensity at 297 nm. The kinetics of the salicylic acid photodegradation was expressed by the Langmuir–Hinshelwood model,16 valid when the initial concentration of substrate is low. In this case, the Langmuir–Hinshelwood equation may be simplified to a pseudo first-order expression given by:| − ln(C/C0) = kt | (2) |
Characterizations
TiO2 content was determined quantitatively in a Shimadzu sequential X-ray fluorescence (XRF) spectrometer model XRF1800 using a calibration curve prepared with commercial TiO2 (P25, Degussa, 99.5%) and silica (Aldrich, 99%). Samples as self-supported wafers were examined using an analyzing area of 5 mm2 and radiation from a Rh-target X-ray tube.Powder X-ray diffraction (XRD) measurements were obtained for slightly pressed powders at room temperature, placed in a stainless steel sample holder at the D12A-XRD1 beamline at the Brazilian Synchrotron Light Laboratory (LNLS, Campinas, Brazil) with a radiation source of λ = 0.124 nm with 0.05° (2θ) step size, or using a Shimadzu XRD7000 with radiation from a Cu target (λ = 0.154 nm), operating at 40 kV and 30 mA using a 10 s acquisition time and 0.02° (2θ) step size.
Small-angle X-ray scattering (SAXS) measurements were carried out at the D2A-SAXS2 beamline of LNLS. The incident X-ray beam of λ = 1.488 Å was detected on a marCCD 165 detector operating in a 2 × 2 binning mode. The measurements were performed covering a scattering vector q from 0.14 nm−1 to 4 nm−1, with a typical exposure time of 60 s, on samples placed in stainless steel windows of 2 mm thick closed with Kapton tape.
Raman spectroscopy was performed in a T64000 Horiba Jobin Yvon Confocal Raman instrument equipped with a microscope with 1 cm−1 of spectral resolution using an Ar+ laser (514 nm, 10 mW).
Diffuse reflectance UV-vis spectroscopy (DRS) was performed in a CARY 5 UV-Vis-NIR spectrophotometer. The powder samples were smoothly compacted into a quartz sample holder which was mounted onto an integrating sphere spectral collector. BaSO4 powder was used as the standard for the instrumental background correction.
Nitrogen (77.4 K) adsorption–desorption measurements were performed with an Autosorb-1 instrument (Quantachrome Instruments, Boynton Beach, FL) in the relative pressure range p/p0 from 10−6 to 1. The samples were outgassed for at least 2 h at 423 K prior to the adsorption analysis. The specific surface area was determined by the BET method. Pore size distributions were calculated assuming cylindrical pore geometry from nitrogen desorption data using the DFT method.
Transmission electron microscopy (TEM) was performed using a JEM 2100 ARP transmission microscope, at an acceleration voltage of 200 kV from a LaB6 thermo-ionic filament and 0.25 nm point-to-point resolution. The images were processed in a Gatan ES500W and in a TVips CCD camera (16 MP). Samples were prepared by dispersion of the powder in acetone. The suspension formed was placed on a Cu grid covered with a holey carbon film and left to dry in air.
Results and discussion
The crystalline phase of TiO2 present in the SBA-15–xTiO2 samples was determined by XRD. SBA-15–1TiO2 presents a diffraction profile similar to the pristine SBA-15 (Fig. 1(A), (a) and (b)), with only one signal related to the amorphous halo centered at 18.4° 2θ. After three IDCs, signals at 35.2 and 38.7° 2θ and a shoulder at 19.8° 2θ start to emerge (Fig. 1(A), (c)). These signals continuously increase and new peaks appear after successive IDCs and match ICDD PDF 21-1272 anatase and 21-1276 rutile files. The coexisting anatase and rutile phases in the SBA-15–xTiO2 samples is in agreement with reports in the literature,17,18 which show that the SBA-15 wall microporosity strongly affects the crystallization temperature of the guest phase confined in the silica matrix. The continuous increase in the signal intensities suggests an increase in the TiO2–SiO2 ratio after each IDC performed, as confirmed by XRF analyses (Table 1). | ||
| Fig. 1 (A) Powder X-ray diffraction patterns (λ = 0.124 nm) of (a) pure SBA-15, (b) SBA-15–1TiO2, (c) SBA-15–3TiO2, (d) SBA-15–5TiO2, (e) SBA-15–7TiO2 and (f) SBA-15–10TiO2, with (210) rutile (∼44° 2θ) and (200) anatase (∼48° 2θ) reflections obtained using step mode (λ = 0.154 nm) in the detail; and (B) the TiO2 crystallite sizes increase with the IDCs obtained from the XRD results and eqn (3). Empty symbols indicate values estimated by exponential fittings according to the equations shown in the figure. | ||
Peaks related to the (210) and (200) planes of rutile and anatase, respectively, were used to determine the crystallite sizes of the TiO2 present in SBA-15–xTiO2, with x = 5, 7, and 10 (Fig. 1 (B)). Unfortunately, XRD peaks of the SBA-15–1TiO2 and SBA-15–3TiO2 samples show low definition and could not be used for crystallite size determination. The position and full width at half maximum (FWHM) were obtained by pseudo-Voigt fittings of the peaks observed in Fig. 1 (A). Titania crystallite sizes were evaluated by the Scherrer equation (eqn (3)),
| D = kλ/βcosθ | (3) |
For both the rutile and anatase phases, the results obtained by the Scherrer equation suggest that the titania present in the SBA-15–xTiO2 samples is under the nanometric regime. Also, increases in the crystallite size with sequential IDCs are observed, which are already described for similar systems19–21 and are explained by the fact that nanoparticles exceeding the interfacial free energy are expected to be minimized by their growth. Therefore, instead of forming new nucleation sites, consecutive IDCs preferentially promote the coverage of the pre-formed titania nanoparticles, causing their increase in size. Results show that the change in size observed for rutile crystallites is more pronounced than for anatase ones (Fig. 1(B)) and mathematical fittings suggest that, after the first IDC, anatase is 7.3 nm and rutile is 3.8 nm while after three IDCs these numbers change to 8.1 nm and 4.5 nm, respectively.
The Spurr equation (eqn (4)) was used for determining the mass fraction of each titania phase in the materials:
| WR = 1/1 + 0.8(IA + IR) | (4) |
SBA-15–xTiO2 was analyzed by Raman spectroscopy, which is known as a tool to understand the quantum size effects related to spatial restrictions caused by a nanometric size regime. The Raman spectrum of anatase shows a band at 144 (vs, Eg), while rutile exhibits bands at 143 (w) (where vs stands for very strong and w for weak intensities) related to lattice phonons. Raman spectroscopy is very sensitive to the vibrational mode of the anatase lattice phonon Eg, occurring at 144 cm−1 for bulk titania, and is used to monitor anatase nanoparticle sizes.22 Since this band is very strong for anatase and weak for rutile, in this work the lowest frequency anatase Eg mode related band was used to monitor the variations in the anatase nanoparticle sizes.
An initial analysis of SBA-15–xTiO2 shows that the frequency and relative intensity of the Eg mode change with the IDC number (Fig. 2(A)). The lowest frequency Eg mode related band, located at 144 cm−1 for bulk anatase, experiences a down shift and becomes sharper as the number of IDCs increases. The Raman Eg band position was used to calculate the anatase nanoparticle sizes using the phonon confinement model (Fig. 2(B)), which is a model used to express Eg band size-induced shifts.23,24 The results suggest that the anatase nanocrystallite size increases with successive IDCs, supporting earlier XRD results. Crystallite sizes obtained using the Scherrer equation are larger, compared with those calculated by the phonon confinement model and can be explained by the different limitations of each technique and each size-determining model used.
 | ||
| Fig. 2 (A) Raman spectra of (a) SBA-15–1TiO2, (b) SBA-15–3TiO2, (c) SBA-15–5TiO2, (d) SBA-15–7TiO2 and (e) SBA-15–10TiO2, and (B) crystallite size-dependent variations of the Raman Eg band position for SBA-15–xTiO2 according to the phonon confinement model.19–21 | ||
Results shown until now allow for the inference that successive IDCs cause the TiO2 nanoparticle sizes to increase, although XRD and Raman limitations do not allow for the exact determination of their size. Since nanoparticles are increasing in size and the anatase–rutile ratio remains almost unchanged even with increasing TiO2 wt%, an anatase-to-rutile phase transition must be occurring. Regarding the two titania phases present in all the samples, according to the literature,25 the formation of rutile and/or anatase from the decomposition of free Ti(OnPr)2(hex)2 depends on the temperature of thermal treatment: at 773 K, titania composed of 38% rutile is obtained; at 873 K the amount of rutile increases to 43%; and at 973 K pure rutile is obtained. The decomposition of another TiO2 precursor, titanium di-(methoxy)-di-(neodecanoate), as thin films, also presented a behavior dependent on the temperature:26 below 813 K, pure anatase film is obtained; at around 943 K both anatase and rutile were identified; and at around 1093 K, a complete phase transition occurs and rutile is the only TiO2 phase obtained. Therefore, the formation of both rutile and anatase in SBA-15 samples impregnated with Ti(OnPr)2(hex)2 and thermally treated at 1023 K is consistent with the literature, considering that the thermal decomposition of the titanium metallo-organic precursor is occurring in the confined ambient SBA-15 pores. In addition, the formation of Si–O–Ti bonds between the SBA-15 surface and TiO2 nanoparticles can also retard phase transition, as already described in literature.22
DRS analyses of SBA-15–xTiO2 samples after different numbers of IDCs are shown (Fig. 3(A)). A red-shift in the absorption band edge with a TiO2 content increase is observed. DRS analyses were used to estimate the band-gap energy (E*g) of the TiO2 present in SBA-15. Theoretical studies propose that the absorption edge of the plot of [F(R)hν]nvs. E*g, where F(R) is the Kubelka–Munk function and E*g = hν = (1239/λ (nm)) corresponds to the band-gap energy of TiO2 (Fig. 2(B)). For direct allowed transitions, the term n takes the value 2; for indirect allowed transitions, n is ½.27 According to the literature,28 direct allowed transition is suitable for mixed TiO2 nanocrystals with rutile and anatase structures and the apparent band-gap energies of TiO2 nanocrystals with anatase and rutile structures supported in SBA-15 are shown in Fig. 3(B).
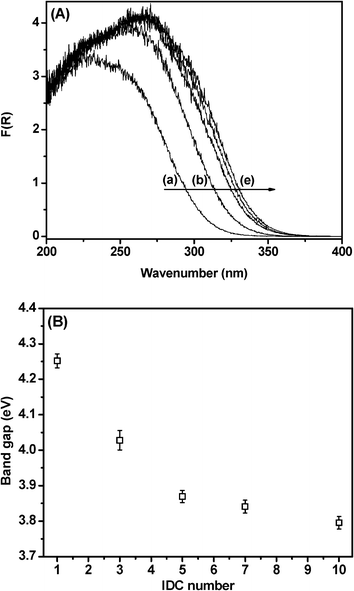 | ||
| Fig. 3 (A) DRS analyses of (a) SBA-15–1TiO2, (b) SBA-15–3TiO2, (c) SBA-15–5TiO2, (d) SBA-15–7TiO2 and (e) SBA-15–10TiO2, and (B) direct and indirect band-gaps calculated from DRS analyses. | ||
The larger band-gap values observed for the SBA-15–xTiO2 samples submitted to lower numbers of IDCs may be related to the well-known size-induced effect observed for semiconductors under a nanometric regime,29 which supports the assumption of the increase in size of the TiO2 nanoparticles with successive ICDs. Some authors30,31 have also suggested that changes in band-gap could be related to the support effect, since it is known that Ti–O–Si bonds in titania–silica oxides strongly modify the electronic structure of the Ti atom by increasing its effective positive charge.32,33 Therefore, it seems that the extraordinarily high band gap values observed for the SBA-15–xTiO2 samples should not be attributed to one or other effect, but to a combination of both the quantum size effect (which is supported by the Raman and XRD results) and an electronic semiconductor support interaction.
N2 adsorption–desorption analyses (Fig. 4) were performed in order to understand how the presence of TiO2 affects the SBA-15 structure. Pristine SBA-15 presents a typical physisorption profile exhibiting a type IV isotherm with a pronounced H1 hysteresis loop. The nearly vertical and parallel adsorption and desorption branches reveal the uniformity of the SBA-15 mesopores (Fig. 4(A), (a)). After one IDC (Fig. 4(A), (b)), a less steep adsorption step and a broader hysteresis loop is observed. Continuous and more pronounced changes in the isotherm profile, together with the decrease in the total surface area (SBET) and in the mean pore volume (Vp), occur with an IDC number increase (Fig. 3, Table 2). These changes in the N2 adsorption–desorption isotherms confirm that all the SBA-15–xTiO2 samples retained their mesoporous structure after impregnation–decomposition cycles and suggest that the TiO2 is formed inside the SBA-15 pores, causing constriction of the pore width (Fig. 4(B), Table 2) and reduction of SBET and of Vp (Table 2).
 | ||
| Fig. 4 (A) N2 adsorption–desorption isotherms and (B) pore size distribution of (a) pristine SBA-15, (b) SBA-15–1TiO2, (c) SBA-15–3TiO2, (d) SBA-15–5TiO2, (e) SBA-15–7TiO2 and (f) SBA-15–10TiO2. | ||
| Sample | S BET (m2 g−1) | V p (cm3 g−1) | D p (nm) | a 0 a (nm) | Pore wall thickness (nm)b |
|---|---|---|---|---|---|
| a a 0 corresponds to the distance between the centers of two adjacent pores and is equal to 2d10/√3, where d10 = 2π/q10. b calculated from a0 − Dp. | |||||
| SBA-15 | 800 | 1.38 | 8.24 | 11.81 | 3.57 |
| SBA-15–1TiO2 | 455 | 0.78 | 3.59 | 10.51 | 6.92 |
| SBA-15–3TiO2 | 331 | 0.56 | 3.50 | 10.54 | 7.04 |
| SBA-15–5TiO2 | 313 | 0.49 | 3.41 | 10.51 | 7.10 |
| SBA-15–7TiO2 | 303 | 0.48 | 3.36 | 10.51 | 7.15 |
| SBA-15–10TiO2 | 282 | 0.46 | 3.29 | 10.47 | 7.18 |
SAXS analyses of all SBA-15–xTiO2 samples were performed in order to study the structural changes caused in SBA-15 by the IDC methodology with the TiO2 metallo-organic precursor. The SAXS patterns of all the SBA-15–xTiO2 samples (Fig. 5(A)) show a series of distinct reflections characteristic of P6mm hexagonal symmetry with a well ordered hexagonal array and one-dimensional channel structure,14 in agreement with the N2 physisorption analyses. The five peaks located at q10 = 0.61, q11 = 1.07, q20 = 1.23, q21 = 1.63 and q30 = 1.84 nm−1 for pristine SBA-15 shift to higher q values after the first IDC. For SBA-15–1TiO2, and for the other SBA-15–xTiO2 samples, q10 = 0.69, q11 = 1.20, q20 = 1.39, q21 = 1.85 and q30 = 2.07 nm−1. Peaks that shift toward larger q values are observed after the first IDC and indicate changes in the SBA-15 unit cell size, a0 (Table 2). In fact, the a0 reduction from 11.8 nm (for pristine SBA-15) to 10.5 nm (for SBA-15–1TiO2) suggests a contraction of the SBA-15 structure caused by further silica condensation.34 The significant pore wall thickness increase (obtained by subtracting Dp from a0), from 3.57 nm for the pristine material to 6.92 nm for SBA-15–1TiO2, is in agreement with this assumption. However, no further cell contraction is observed after the first or after all the subsequent IDCs and, in this case, all changes in the mean pore diameter and in the pore wall thickness between the SBA-15–xTiO2 samples should be addressed to the presence of TiO2 inside the SBA-15 mesopores. Changes in the relative intensity of the SBA-15 related peaks 110 and 200 are described in the literature34 as dependent on the ratio of the pore diameter (Dp) to the unit cell parameter (a0) and, therefore, on SBA-15 wall thickness. Despite the fact that a0 does not change with successive IDCs (Table 2), the changes observed in the I110–I200 ratio (Fig. 5(B)) support the previous discussion.
 | ||
| Fig. 5 (A) Comparison between the SAXS intensity curves obtained for (a) SBA-15, (b) SBA-15–1TiO2, (c) SBA-15–3TiO2, (d) SBA-15–5TiO2, (e) SBA-15–7TiO2 and (f) SBA-15–10TiO and (B) dependence of the 110–200 intensity ratio on the pore per unit cell in the SBA-15–xTiO2 samples. | ||
The morphology of SBA-15–10TiO2 was investigated by TEM and a representative image is shown in Fig. 6, where the typical SBA-15 structure is seen, consisting of an aligned arrangement of cylindrical pores. Crystalline domains of nanometric size are identified inside the matrix mesopores. These observations are in agreement with the assumption of the presence of TiO2 nanoparticles inside the SBA-15 matrix, not affecting its original porous framework.
 | ||
| Fig. 6 TEM image of SBA-15–7TiO2. | ||
Considering that the TEM image shows crystalline nanoparticles inside the SBA-15 mesopores and supports the N2 sorption results, TiO2 size determination using Raman analysis seems to give a more reliable result than XRD. However, this characterization does not allow for the inference of the architecture of the TiO2 nanoparticles, which could explain the differences in the size evaluation using the above-mentioned techniques.
Despite the fact that anatase is generally identified as the more photoactive phase of titania, Degussa P25, a material with a 30![[thin space (1/6-em)]](https://www.rsc.org/images/entities/char_2009.gif) :70 rutile:anatase ratio is an excellent photocatalyst for the mineralization of organics during waste water treatment.35 Also, a recent paper has shown that a film with ca. 40% rutile and 60% anatase exhibits optimal performance, among other anatase–rutile ratios examined.9 Therefore, it seems that there is a synergistic effect between rutile and anatase. Considering that the characterization shown in this work suggests that titania nanoparticles are present in all samples with approximately a 43:57 rutile:anatase ratio, independent of the number of IDCs performed, the photocatalytic activity of the SBA-15–xTiO2 series of samples in the degradation of salicylic acid was tested. Among the carboxylic acids, salicylic acid is of particular interest since it is present in industrial and domestic effluents.
:70 rutile:anatase ratio is an excellent photocatalyst for the mineralization of organics during waste water treatment.35 Also, a recent paper has shown that a film with ca. 40% rutile and 60% anatase exhibits optimal performance, among other anatase–rutile ratios examined.9 Therefore, it seems that there is a synergistic effect between rutile and anatase. Considering that the characterization shown in this work suggests that titania nanoparticles are present in all samples with approximately a 43:57 rutile:anatase ratio, independent of the number of IDCs performed, the photocatalytic activity of the SBA-15–xTiO2 series of samples in the degradation of salicylic acid was tested. Among the carboxylic acids, salicylic acid is of particular interest since it is present in industrial and domestic effluents.
The photocatalytic activity of the SBA-15–xTiO2 samples was monitored by the dependence of C/C0 with irradiation time (Fig. 7(A)). No important variation of C/C0 is observed during the dark experiment, indicating that salicylic acid does not degrade in the absence of light in 180 min and adsorbs and desorbs at the same rate over the catalyst’s (SBA-15–10TiO2) surface, meaning that it is under dynamic equilibrium. Under UV-vis light, reduction of the relative salicylic acid concentration is observed (Fig. 7(A)), indicating that the degradation of this molecule over SBA-15–xTiO2 is, as expected, a photo-activated process. A similar degradation profile is observed for SBA-15–xTiO2 with x = 3, 5, 7 and 10 (Fig. 7(A)) and the rate constant changes slightly from 7 × 10⁻⁴ for SBA-15–3TiO2 to 8 × 10⁻⁴ min−1 for SBA-15–10TiO2. In the SBA-15–xTiO2 series, the best catalytic activity is observed for SBA-15–1TiO2, which is the sample with the smallest TiO2 nanoparticles. The rate constant calculated for this sample is 1 × 10⁻³ min−1.
 | ||
| Fig. 7 (A) Photodegradation of salicylic acid using SBA-15–xTiO2 as catalyst, and (B) determination of the rate constant. | ||
All catalysts tested present low photodegradation ratios. Ideally, salicylic acid photodegrades to complete mineralization and yields CO2 and water. However, the situation might be different if it is only partially oxidized, forming by-products that could adhere irreversibly to the surface of TiO2, reducing its ability to photodegrade salicylic acid.36
The most important difference in photocatalytic activity is observed for SBA-15–1TiO2, which is able to convert salicylic acid into its degradation products faster than the other SBA-15–xTiO2 samples. Since the rutile–anatase ratio is practically identical for all samples, changes in photocatalytic activity may be explained by differences in other properties related to successive IDCs, such as textural properties; titania nanoparticle sizes; and changes in the band-gap.
The highest photocatalytic activity of SBA-15–1TiO2 could be related to its highest band-gap: for TiO2 under a nanometric regime an increase in the band-gap has been attributed to an elevation of the conduction band edge added to the lowering of the valence band edge. Consequently, under UV light irradiation, there would be an increase in the photodegradation of the organic substrate because of the reduction of the electron–hole recombination rate and because of the high oxidizing potential of the photogenerated holes. Also, generally, the photocatalytic activity is directly related to the catalyst’s surface area and, between the prepared samples, SBA-15–1TiO2 is the one presenting the highest specific surface area, pore volume and pore size, in complete agreement with its higher activity towards salicylic acid degradation.
Conclusion
Crystalline anatase–rutile nanoparticles with tunable size were prepared inside SBA-15 pores by the IDC methodology. The SBA-15 matrix controls the coalescence process and the titania nanoparticles formed inside the porous structure are highly dispersed and stabilized. It is observed that the methodology shown in the present work results in the formation of TiO2 under a nanometric regime, with anatase as the predominant phase. With sequential IDCs, TiO2 nanoparticles increase in size and must undergo a phase transition to maintain the anatase–rutile ratio, which is almost unchanged after several cycles. The above listed modifications cause changes in the optical and textural properties between the SBA-15–xTiO2 samples: reductions in surface area, mean pore diameter and total pore volume are observed, in addition to modifications in the photocatalytic activity for the degradation of salicylic acid.Acknowledgements
The authors acknowledge CNPq, FAPESP and CAPES for fellowships and financial support, the electron microscopy laboratory of the Cesar Lattes Nanoscience and Nanotechnology Center (C2Nano) and the LNNano for use of the TEM; the LNLS for the use of the SAXS and XRD lines and the Laboratory of Advanced Optical Spectroscopy (LMEOA/IQ-UNICAMP/FAPESP 2009/54066-7). The authors thank Prof. Carol H. Collins for text revision. This work is a contribution from the National Institute of Science and Innovation in Complex Functional Materials (INOMAT).References
- D. R. Rolison, R. W. Long, J. C. Lytle, A. E. Fischer, C. P. Rhodes, T. M. McEvoy, M. E. Bourga and A. M. Lubers, Chem. Soc. Rev., 2009, 38, 226 RSC.
- D. Cangussu, W. C. Nunes, H. L. D. Correa, W. A. A. Macedo, M. Knobel, O. L. Alves, A. G. Souza Filho and I. O. Mazali, J. Appl. Phys., 2009, 105, 013901 CrossRef.
- M. Zahmakıran and S. Özkar, Nanoscale, 2011, 3, 3462 RSC.
- H. S. Ferreira and M. D. Rangel, Quim. Nova, 2009, 32, 1860 CrossRef CAS.
- S. G. Kumar and L. G. Devi, J. Phys. Chem. A, 2011, 115, 13211 CrossRef CAS.
- M. Asiltürk, F. Sayılkan, S. Erdemoğlu, M. Akarsu, H. Sayılkan, M. Erdemoğlu and E. Arpaç, J. Hazard. Mater., 2006, 129, 161 Search PubMed.
- M. Pal, J. García Serrano, P. Santiago and U. Pal, J. Phys. Chem. C, 2007, 111, 96 CAS.
- G. Cernuto, S. Galli, F. Trudu, G. M. Colonna, N. Masciocchi, A. Cervellino and A. Guagliardi, Angew. Chem., 2011, 123, 11020 CrossRef.
- X. Gao and I. E. Wachs, Catal. Today, 1999, 51, 233 CrossRef CAS.
- M. A. Lazar and W. A. Daoud, RSC Adv., 2012, 2, 447 RSC.
- S. Higashimoto, K. Okada, M. Azuma, H. Ohue, T. Teraia and Y. Sakata, RSC Adv., 2012, 2, 669 RSC.
- R. Su, R. Bechstein, L. Sø, R. T. Vang, M. Sillassen, B. Esbjörnsson, A. Palmqvist and F. Besenbacher, J. Phys. Chem. C, 2011, 115, 24287 CAS.
- H. R. Jafry, M. V. Liga, Q. Li and A. R. Barron, Environ. Sci. Technol., 2011, 45, 1563 CrossRef CAS.
- D. Zhao, J. Feng, Q. Huo, N. Melosh, G. H. Fredrickson, B. F. Chmelka and G. D. Stucky, Science, 1998, 279, 548 CrossRef CAS.
- R. W. Vest and S. Singaram, Mater. Res. Soc. Symp. Proc., 1986, 60, 35 CrossRef.
- A. N. Rao, B. Sivasankar and V. Sadasivam, J. Hazard. Mater., 2009, 166, 1357 CrossRef.
- R. Zukerman, L. Vradman, L. Titelman, C. Weidenthaler, M. V. Landau and M. Herskowitz, Microporous Mesoporous Mater., 2008, 116, 237 CrossRef CAS.
- F. Zhang, X. Carrier, J.-M. Krafft, Y. Yoshimura and J. Blanchard, New J. Chem., 2010, 34, 508 RSC.
- I. O. Mazali, R. Romano and O. L. Alves, Thin Solid Films, 2006, 495, 64 CrossRef CAS.
- N. M. Carneiro, W. C. Nunes, R. P. Borges, M. Godinho, L. E. Fernandez-Outon, W. A. A. Macedo and I. O. Mazali, J. Phys. Chem. C, 2010, 114, 18773 CAS.
- J. M. de Souza e Silva, M. Strauss, C. M. Maroneze, E. R. Souza, Y. Gushikem, F. A. Sigoli and I. O. Mazali, J. Mater. Chem., 2011, 21, 15678 RSC.
- I. O. Mazali, A. G. Souza Filho, B. C. Viana, J. Mendes Filho and O. L. Alves, J. Nanopart. Res., 2006, 8, 141 CrossRef CAS.
- H. Richter, Z. P. Wang and L. Ley, Solid State Commun., 1981, 39, 625 CrossRef CAS.
- S. K. Gupta, R. Desai, P. K. Jha, S. Sahoo and D. Kirin, J. Raman Spectrosc., 2010, 41, 350 CAS.
- I. O. Mazali and O. L. Alves, J. Phys. Chem. Solids, 2005, 66, 37 CrossRef CAS.
- W. Ousi-Benomar, S. S. Xue, R. A. Lessard, A. Singh, Z. L. Wu and P. K. Kuo, J. Mater. Res., 2011, 9, 970 CrossRef.
- T. Toyoda and I. Tsuboya, Rev. Sci. Instrum., 2003, 74, 782 CrossRef CAS.
- T. Toyoda, R. Taira, Q. Shen and M. Ohmori, Jpn. J. Appl. Phys., 2001, 40, 3587 CrossRef CAS.
- W. G. Menezes, P. H. C. Camargo, M. M. Oliveira, D. J. Evans, J. F. Soares and A. J. G. Zarbin, J. Colloid Interface Sci., 2006, 299, 291 CrossRef CAS.
- C. Anderson and A. J. Bard, J. Phys. Chem., 1995, 99, 9882 CrossRef CAS.
- G. Lassaletta, A. Fernandez, J. P. Espinos and A. R. Gonzalez, J. Phys. Chem., 1995, 99, 1484 CrossRef CAS.
- X. Gao and I. E. Wachs, Catal. Today, 1999, 51, 233 CrossRef CAS.
- M. Gärtner, V. Dremov, P. Müller and H. Kisch, ChemPhysChem, 2005, 6, 714 CrossRef.
- S. Pikus, L. A. Solovyov, M. Kozak and M. Jaroniec, Appl. Surf. Sci., 2007, 253, 5682 CrossRef CAS.
- H. Li, W. Zhang and W. Pan, J. Am. Ceram. Soc., 2011, 94, 3184 CrossRef CAS.
- M. Nussbaum and Y. Paz, Phys. Chem. Chem. Phys., 2012, 14, 3392 RSC.
| This journal is © The Royal Society of Chemistry 2012 |