 Open Access Article
Creative Commons Attribution 3.0 Unported Licence
Electrochemical impedance spectroscopy of PEM fuel cells at low hydrogen partial pressures: efficient cell tests for mass production†
Felix
Haimerl‡
*ab,
Sunil
Kumar‡
 bc,
Michael
Heere
c and
Aliaksandr S.
Bandarenka
 *ad
*ad
aTechnical University of Munich, School of Natural Sciences, Department of Physics, Professorship of Physics of Energy Conversion and Storage, 85748 Garching, Germany
bBMW AG, Petuelring 130, 80809 München, Germany. E-mail: felix.haimerl@bmw.de
cTechnical University Braunschweig, Faculty of Mechanical Engineering, Institute of Internal Combustion Engines and Fuel Cells, 38108 Braunschweig, Germany
dTechnical University of Munich, Catalysis Research Center TUM, Ernst-Otto-Fischer-Straße 1, 85748 Garching, Germany. E-mail: bandarenka@ph.tum.de
First published on 4th October 2023
Abstract
Quality testing costs hinder the large-scale production of PEM fuel cell systems due to long testing times and high safety measures for hydrogen. While eliminating both issues, electrochemical impedance spectroscopy at low hydrogen concentrations can provide valuable insights into fuel cell processes. However, the influence of high anode stream dilutions on PEM fuel cell performance is not yet completely understood. This study presents a new equivalent circuit model to analyze impedance spectra at low hydrogen partial pressures. The proposed model accurately describes the impedance response and explains the performance decrease at low hydrogen concentrations. First, the reduced availability of hydrogen at the anode leads to rising reaction losses from the hydrogen side. Further, the resulting losses lead to potential changes also influencing the cathode processes. The findings indicate that impedance spectroscopy at low hydrogen partial pressure might provide a reliable fuel cell quality control tool, simplifying production processes, reducing costs, and mitigating risks in fuel cell production.
Keywords: PEM fuel cells; Electrochemical impedance spectroscopy; EIS; Large scale PEMFC production; Anodes; Cathodes.
1 Introduction
Decarbonizing the transportation sector is crucial in achieving a renewable energy transition, as transport emissions have been growing faster than any other end-use sector.1 Fuel cells offer a clean alternative to fossil fuel combustion for many transport applications. For road applications, such as cars, trucks, and buses, polymer electrolyte membrane fuel cells (PEMFCs) have emerged as the most promising technology. Over the past decade, rapid developments in fuel cell materials, integration, and manufacturing have fueled commercial interest in fuel cell electric vehicles (FCEVs).2,3 Prominent original equipment manufacturers (OEMs), such as the BMW Group, Daimler, Volkswagen, Toyota, and Hyundai, have actively engaged in extensive research, development, and demonstration endeavors in this field.4–8Despite the progress, further technological advancements are necessary to maximize FCEVs' viability and widespread adoption.9 As the emphasis shifts to PEMFC mass production, there is a growing need to develop stable and cost-effective production processes with short cycle times. Within the value chain of FCEVs, several intermediate quality checks are standard since companies usually focus on only one or two of the production steps shown in Fig. 1. These quality checks are a significant obstacle to further commercializing FCEVs.10–14 Testing protocols must identify and isolate manufacturing flaws in the production process, including quality control checks on individual components, the fuel cell stack, and the fuel cell system while keeping the cost of production low. The IEC 62282-2-100 standard mandates the conduct of routine quality control tests that need to be carried out on every unit.15 Those tests at the end of the production line are frequently called “End-of-Line” (EoL) or “Factory Acceptance Test” (FAT). They are contractually obligated to customers to verify that the unit meets the specified requirements.16,17
 | ||
| Fig. 1 Visualization of the value chain of a fuel cell electric vehicle. After each production step, a quality control step ensures the safety and performance of the product. | ||
State-of-the-art quality control procedures mostly rely on the operation with hydrogen. However, hydrogen poses safety concerns as it can detonate at a volumetric concentration ratio as low as 4.3% and has high permeability through various materials.18,19 Consequently, stringent safety measures must be implemented during hydrogen testing, leading to cost inefficiencies in the manufacturing process.20 Therefore, test strategies that require lower security measures are necessary. For fuel cell components, including catalyst layers, membranes, gas diffusion layers (GDLs), and bipolar plates, optical tools provide a solution. Recent advances in this field include through-plane reactive excitation techniques for detecting pinholes in membrane electrode assemblies,21 infrared thermography studies to detect membrane irregularities22 or electrode defects,23,24 and deep learning implementations.16,25 However, optical measures are limited to component testing, and alternative methods must be employed for fuel cell stack and fuel cell system testing.
Electrochemical impedance spectroscopy (EIS) offers a well-established method to gain insights into fuel cells for simultaneous fast and non-invasive measurements. By subjecting the fuel cell to small amplitude sinusoidal perturbations, EIS can reveal important information about the charge transfer kinetics, mass transport limitations, and the overall electrochemical behavior of the cell.26–30 In particular, EIS is a widespread tool to monitor degradation in PEM fuel cells31–33 and is also applied in FCEVs for on-road state-of-health monitoring.34,35 Applying EIS at low hydrogen partial pressure (hpp) might provide valuable insights while mitigating safety and cost concerns. However, since the cathode side in a PEM fuel cell is usually rate-determining, few studies investigate the impact of reduced hpp on the fuel cell performance. Stühmeier et al.37 studied the hydrogen oxidation reaction (HOR) pressure dependence in the range 100–400 kPa using hydrogen pump measurements and found a dependency of the apparent activation energy of the HOR on the hpp. In contrast, a full factorial study by Gerling et al.41 found no dependency of the apparent activation energy on the hpp in the range 4–100 kPa. Both studies did, however, only focus on the impact on the anodic reaction.
Through this study, we aim to enhance the understanding of fuel cell behavior under varying hydrogen concentrations using impedance analysis and contribute to developing improved diagnostic techniques and strategies for fuel cell system manufacturing.
2 Results and discussion
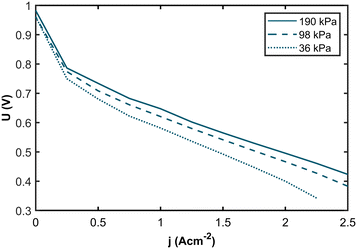
The membrane electrolyte assemblies (MEAs) were operated at various levels of anode inlet gas dilution corresponding to different hydrogen partial pressures (hpps) to investigate the correlation between hpp and performance. Polarization curves and impedance spectra were recorded for hpps between 36 kPa and 190 kPa. Fig. 2 shows the resulting polarization curves at 190 kPa (solid curve), 98 kPa (dashed curve), and 36 kPa (dotted curve) hydrogen partial pressure. The dilution was achieved by mixing nitrogen gas into the anode gas stream while the hydrogen flow remained constant. Humidified air was used as the cathode gas.The polarization curves demonstrate a pronounced decline in performance with decreasing partial pressure across the entire range of current densities. Comparing the polarization curves, the voltage losses are more apparent at higher current densities. In Fig. 3a, the resulting voltage values at j = 1.0 A cm−2 are plotted against the hydrogen partial pressure. We see a logarithmic dependency with a voltage difference of 54 mV between 190 kPa and 36 kPa hpp, respectively. For the voltage values at j = 2.0 A cm−2 (Fig. 3b), we found a logarithmic dependency with a total voltage drop of 107 mV at 36 kPa partial pressure. The voltage difference at j = 2.0 A cm−2 is twice as high as at j = 1.0 A cm−2.
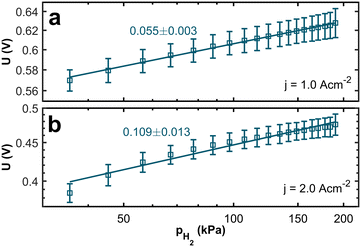 | ||
| Fig. 3 Logarithmic plot of the voltage at a current density of (a) 1.0 A cm−2 and (b) 2.0 A cm−2 against the hydrogen partial pressure. The lines serve as a guide for the eye. | ||
From the Nernst equation (eqn (1)), we can see a theoretical logarithmic dependency of the open circuit voltage UOCV on the partial pressure of hydrogen pH2:
 | (1) |
| Ucell = UOCV − ηHOR − ηORR − ηMT − ηΩ | (2) |
To investigate the origins of the voltage losses related to decreased hpp, electrochemical impedance spectra were recorded for each partial pressure value at a current density of j = 1.0 A cm−2. The frequencies spanned 36 logarithmically distributed points between 3 Hz and 10 kHz. In total, twelve spectra were recorded for each partial pressure. The Kramers–Kronig check was performed to ensure high data quality.
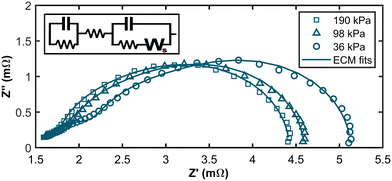
Exemplary Nyquist plots are shown in Fig. 4 (For all EIS spectra, please refer to the ESI†). It is apparent that the low-frequency intercept with the x-axis, associated with overall fuel cell losses, increased at low hpp. A pronounced feature in the high-frequency range becomes visible as the partial pressure decreases. Previous studies found a similar feature for extremely low platinum loadings at the anode, contributing to anode reaction losses.37,38 Therefore, we propose a new equivalent circuit model (ECM) for fitting the impedance data of PEM fuel cells at low hpp. The ECM consists of an uncompensated resistance equalling all ohmic resistances in the cell and a parallel circuit of a charge transfer resistance, and a double layer capacitance mimicking the electrochemical response in the cathode layer. In series with the charge transfer resistance, a Warburg short element simulates gas diffusion losses in the cathode. To account for increasing anode contributions to the cell overpotential at high anode stream dilutions, we added a parallel connection of a charge transfer resistance for the HOR and a capacitance for the double layer forming at the anode interface. The ECM and the resulting fits are shown in Fig. 4 for 36 kPa, 98 kPa, and 190 kPa partial pressure.
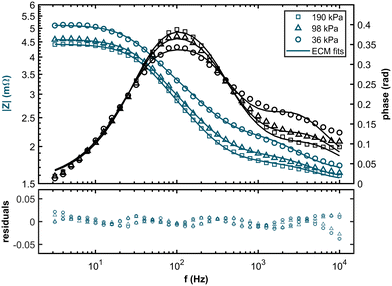
The Bode plots and the corresponding residuals of the fits are displayed in Fig. 5. The ECM fits show good agreement with the experimental data across all partial pressure values, with all relative residuals below 5%.
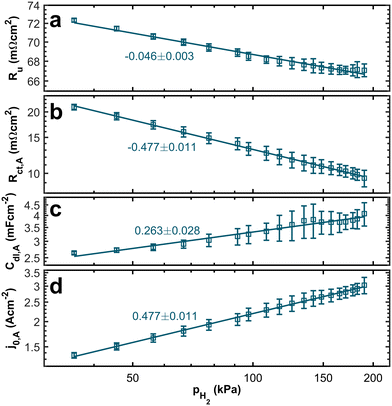
In Fig. 6a, we can see the relation between the uncompensated resistance, which is dominated by proton transport, and the partial pressure. We observe a trend of increasing resistance with decreasing hydrogen concentration. Theoretically, we do not expect a dependency between the uncompensated resistance and the partial pressure. However, the relationship between the water content of the ionomer and proton conduction is well established.39,40 Since we keep the stoichiometry constant and adjust the nitrogen flow, flow velocities increase significantly at low hydrogen concentrations. Thus, the electro-osmatic drag might drain water from the ionomer and increase the resistance associated with proton transport.
In contrast, the theory does predict a dependency of the anodic charge transfer resistance on the hpp.16 The double-logarithmic plot in Fig. 6b reveals the proportionality, validating the chosen ECM. The Butler–Volmer equation describes the relation between current density and anode overpotential. For small overpotentials, we can linearize the equation. Hence, the voltage loss at the anode can be described by
 | (3) |
 | (4) |
 | (5) |
Here,  is the calculated exchange current density at a reference concentration
  referring to a reference partial pressure
  . Hence, we can determine the reaction order m of the HOR from the slope in a double logarithmic plot of the exchange current density against the hpp. The corresponding plot is shown in Fig. 6d. We obtain a reaction order of 0.477 ± 0.011, which is in line with previous publications.37,41,42 Stühmeier et al.37 found a reaction order of 0.39 ± 0.05 at 60 °C calculated from micro-polarization measurements in a hydrogen pumping configuration. Therefore, it was shown that we could indeed analyze anode contributions to the fuel cell performance by reducing the hpp.
A trend of higher capacities at higher partial pressures (see Fig. 6c) supports the idea that the electro-osmotic drag at high flow velocities dries out the ionomer. High water content in the catalyst layer is generally associated with high double-layer capacities.34,43 Hence, drying of the anode catalyst layers at high flow velocities leads to reduced double layer capacities.
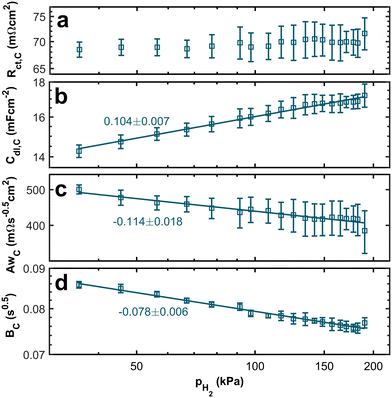
Fig. 7 depicts the dependence of cathode characteristics on the hpp in the anode stream. No clear trend is visible from the double-logarithmic plot of the charge transfer resistance associated with the ORR in Fig. 7a. While the absolute values of the cathodic charge transfer resistance are nearly one order of magnitude higher than those for the anodic charge transfer resistance, the measured values at low hpps equal those at high partial pressures within the error bars. Therefore, the dependency of the anodic reaction on the hydrogen concentration is, as expected, more significant than that of the ORR charge transfer resistance. Fig. 7b–d displays the other fitting parameters Cdl,C, AwC, BC associated with the cathode. All three parameters show a dependency on the hpp. Even though the trend is smaller than those seen for parameters associated with the anode, the effect of the hydrogen concentration at the anode on the double layer capacitance and the diffusion at the cathode side is surprising. We will therefore analyze the origin further.
From the correlation between the Warburg short parameter AwC and the charge transfer resistance Rct,C, we can calculate the apparent rate coefficient kapp.
 | (6) |
 | (7) |
The resulting trends of the apparent rate coefficient kapp and the Nernst diffusion layer thickness δ are displayed in Fig. 8. The values for the ratio AwC/Rct,C vary between ∼5.4 s−0.5 and ∼7.3 s−0.5, which is in accordance with previously reported values.32,33,51 We can see a slight dependence of the apparent rate coefficient and the Nernst diffusion layer thickness on the hpp. Since the cell is operated in galvanostatic mode, the potential changes with the partial pressure (compare Fig. 3). The reaction kinetics and the mass transport depend on the electrode potential. Also, hydrogen crossover might increase due to higher flow velocities on the anode side. An increase in the rate of hydrogen crossover correlates with increased mass transport issues on the cathode side.52,53
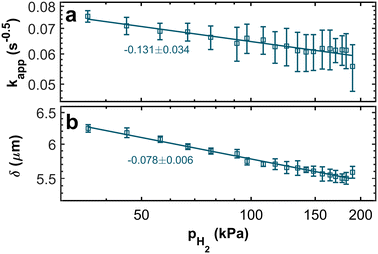 | ||
| Fig. 8 Double-logarithmic plots of (a) the apparent rate coefficient kapp and (b) the Nernst diffusion layer thickness δ in relation to the hydrogen partial pressure. | ||
3 Conclusions
The study focused on investigating the correlation between hydrogen partial pressure (hpp) and the performance of PEMFCs, which can help in testing the fuel cells under low hydrogen partial pressure. Polarization curves and impedance spectra were recorded for a wide range of hpps between 36 kPa and 190 kPa by diluting the hydrogen stream with nitrogen while keeping the hydrogen flow constant.The polarization curves and impedance spectra obtained from the experiments showed a pronounced decline in performance with decreasing hpp across the entire range of current densities. The voltage losses were more significant at higher current densities.
The impedance spectra analysis revealed that the low-frequency intercept associated with overall fuel cell losses increased at low hpp, while a prominent feature in the high-frequency range became visible. An ECM was proposed to fit the impedance data, including a part for anode contributions. The fits showed good agreement with the experimental data. As predicted from theory, the charge transfer resistance associated with the anode showed an exponential dependency on hpp. The calculated anodic reaction order confirmed results from previous studies based on micro-polarization measurements. We, therefore, proved the validity of the chosen ECM. The cathode characteristics, including charge transfer resistance, double-layer capacitance, and Warburg short parameters, also showed dependencies on the hpp, although smaller than those observed for the anode. While hpp does not influence cathode processes directly, the induced performance losses lead to electrode potential changes since the current was kept constant. The unsaturated resistance, dominated by proton transport, showed an increasing trend with decreasing hydrogen concentrations, potentially attributed to increased electro-osmotic drag.
Overall, the research findings contribute to understanding the relationship between hpp and the performance of PEMFCs. Improved knowledge of testing with low hydrogen concentrations should pave the way to simplify processes, reduce costs, and mitigate risks in fuel cell production.
4 Experimental section
4.1 Cell preparation
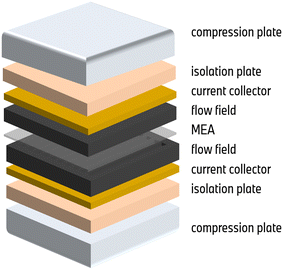
The MEAs were assembled manually and subsequently hot-pressed for 240 s at 160 °C to ensure optimal electric contact. A proton exchange membrane supplied by Gore (M775.15) was utilized. For anode and cathode, commercial platinum/Vulcan catalyst layers with weight loadings of 0.08 mg cm−2 and 0.4 mg cm−2, respectively, were applied. The MEA configuration is complemented by two gas diffusion layers by Toray with a thickness of 150/180 μm for anode/cathode. The effective active area of the MEAs is 43.56 cm2. In the context of the experiment, each fuel cell in the experimental setup consisted of a single MEA sandwiched between two graphite flow fields. The flow fields were arranged in a parallel counter-flow configuration, allowing for efficient gas flow and reaction pathways. Each side of the cell setup is completed by a copper current collector plated with gold, an isolation plate, and compression hardware. The compression plates evenly compress the cell to a pressure of 900 kPa. The cell setup is visualized in Fig. 9.Electrochemical measurements
Tests were performed on the single-cell test station Evaluator C50-LT from HORIBA FuelCon AG (Germany). During the experimental procedures, the fuel cell was operated automatically with TestWork by HORIBA FuelCon AG. The anode was supplied with a mixture of hydrogen (99.999% purity) and nitrogen (99.999% purity), and the cathode was fed with air. The hydrogen flow was kept at 19.2 cm2 s−1, equalling a stoichiometric factor of 1.5 for the maximum current density of 2.5 A cm−2. Similarly, to ensure an ample air supply at the cathode and mitigate losses, the air was supplied at a flow rate of 168.6 cm2 s−1 corresponding to a stoichiometry of 5.5 at 2.5 A cm−2. While the hydrogen flow was limited by the maximum total flow rates of the testbench, the air stoichiometry was chosen to minimize the effect of mass transport limitations. The supplied gases were conditioned to a constant relative humidity of 50% throughout the experiments at a cell temperature of 60 °C. The back pressure was kept at 200 kPa at both the anode and cathode. For better comparability, the set of operating parameters was adapted from common operating conditions in the literature. The hpp was varied by adapting the nitrogen flow while the supply of hydrogen and air was kept constant. Starting from 190 kPa, equaling no added nitrogen supply, going down to 36 kPa partial pressure, equaling a nitrogen flow rate of 87.7 cm2 s−1, and going back up to pure hydrogen. The whole procedure was repeated two times so that the measurements for all hpps were carried out in total four times. This way, it was ensured that the data was not affected by any degradation effects.Before conducting the measurements, a comprehensive 9 h activation step based on potential cycling was carried out to prepare the cell for optimal functioning. A purging process was implemented with a predetermined high gas concentration to minimize any potential fluctuations. This purging process was intended to stabilize the cell and create a controlled environment for reliable measurements.
At each hpp step, a polarization curve was recorded. The experimental procedure involved gradually increasing the cell's current density up to 2.5 A cm−2. Potentials were recorded at each defined current density while ramping the current density downward. The standard duration for holding each current density was typically 60 s to ensure accurate and reliable measurements. However, shorter durations were employed for lower densities and open circuit voltages to minimize the risk of potential cell degradation. Minimizing the exposure time under these specific conditions mitigated the risk of any adverse effects on the cell's performance and integrity. A 4800 s hold was introduced after every change in hpp to ensure consistent experimental conditions. This time interval allowed the system to stabilize before measuring each polarization curve.
Impedance measurements were subsequently conducted after each polarization curve while keeping the nitrogen dilution and operating parameters constant. A Zahner Zennium workstation was utilized for these measurements, capturing spectra ranging from 3 Hz to 10 kHz at 1.0 A cm−2 with five points per decade. After a stabilization time of 600 s, three impedance spectra are recorded with a 600 s waiting time between each other.
Data processing
For the polarization curves, the voltage values were averaged over 25 s for each current hold. The resulting cell voltages were averaged over the four polarization curves measured for each partial pressure for error analysis.Prior to the fitting process, all impedance spectra were checked for validity by applying the Kramers–Kronig check. The impedance spectra were fitted with MATLAB using a non-linear least square fitting algorithm. Subsequently, the fitting parameters were averaged over twelve impedance spectra taken for each hpp. Regression models for the relations of voltage values and fitting parameters on the partial pressure were also fitted using a non-linear least square algorithm. Uncertainties for the cell descriptors deduced from the fitting parameters were calculated by applying error propagation rules.
Partial pressure values were calculated by subtracting the water vapor pressure from the back pressure and dividing the resulting value of 190 kPa according to the volumetric ratios of hydrogen and nitrogen.
Conflicts of interest
The authors declare no conflict of interest.Acknowledgements
We acknowledge financial funding from the Deutsche Forschungsgemeinschaft (DFG, German Research Foundation) under Germany's Excellence Strategy – EXC 2089/1 – 390776260 (e-conversion) & – EXC 2163/1 – 390881007 (Sustainable and Energy Efficient Aviation). We also acknowledge the BMW AG, Germany for supporting the research.References
- Transport, International Energy Agency, https://www.iea.org/reports/transport, (23.08. 2023).
- D. A. Cullen, K. C. Neyerlin, R. K. Ahluwalia, R. Mukundan, K. L. More, R. L. Borup, A. Z. Weber, D. J. Myers and A. Kusoglu, New roads and challenges for fuel cells in heavy-duty transportation, Nat. Energy, 2021, 6, 462–474 CrossRef CAS.
- B. G. Pollet, S. S. Kocha and I. Staffell, Current status of automotive fuel cells for sustainable transport, Curr. Opin. Electrochem., 2019, 16, 90–95 CrossRef CAS.
- Automobility in transition? a socio-technical analysis of sustainable transport, ed. F. W. Geels, Routledge, New York, 2012 Search PubMed.
- B. Budde, F. Alkemade and K. M. Weber, Expectations as a key to understanding actor strategies in the field of fuel cell and hydrogen vehicles, Technol. Forecast. Soc. Change, 2012, 79, 1072–1083 CrossRef PubMed.
- Y. Luo, Y. Wu, B. Li, T. Mo, Y. Li, S.-P. Feng, J. Qu and P. K. Chu, Development and application of fuel cells in the automobile industry, J. Energy Storage, 2021, 42, 103124 CrossRef.
- T. Yoshida and K. Kojima, Toyota MIRAI fuel cell vehicle and progress toward a future hydrogen society, Interface Mag., 2015, 24, 45–49 CrossRef CAS.
- G. Trencher and A. Edianto, Drivers and barriers to the adoption of fuel cell passenger vehicles and buses in Germany, Energies, 2021, 14, 833 CrossRef CAS.
- O. Saritas, D. Meissner and A. Sokolov, A transition management roadmap for fuel cell electric vehicles (FCEVs), J. Knowl. Econ., 2019, 10, 1183–1203 CrossRef.
- A. Kampker, P. Ayvaz, C. Schön, J. Karstedt, R. Förstmann and F. Welker, Challenges towards large-scale fuel cell production: Results of an expert assessment study, Int. J. Hydrogen Energy, 2020, 45, 29288–29296 CrossRef CAS.
- J. Marcinkoski, B. D. James, J. A. Kalinoski, W. Podolski, T. Benjamin and J. Kopasz, Manufacturing process assumptions used in fuel cell system cost analyses, J. Power Sources, 2011, 196, 5282–5292 CrossRef CAS.
- M. Ulsh, B. Sopori, N. V. Aieta and G. Bender, Challenges to high-volume production of fuel cell materials: Quality control, ECS Trans., 2013, 50, 919–926 CrossRef.
- J. Wang, H. Wang and Y. Fan, Techno-economic challenges of fuel cell commercialization, Engineering, 2018, 4, 352–360 CrossRef CAS.
- M. Miller and A. Bazylak, A review of polymer electrolyte membrane fuel cell stack testing, J. Power Sources, 2011, 196, 601–613 CrossRef CAS.
- International Electrotechnical Commission, Fuel cell technologies: Part 2–100: Fuel cell modules – Safety, https://webstore.iec.ch/publication/59780, (23.08. 2023).
- F. Sasse, G. Fischer, N. Eschner and G. Lanza, Improving End-Of-Line Quality Control of Fuel Cell Manufacturing Through Machine Lerning Enabled Data Analysis, PhD thesis, Technische Universität Chemnitz, Chemnitz, 2022 Search PubMed.
- M. Killcross, in Chemical and Process Plant Commissioning Handbook, Elsevier, 2021, pp. 203–212 Search PubMed.
- M. Molnarne and V. Schroeder, Hazardous properties of hydrogen and hydrogen containing fuel gases, Process Saf. Environ. Prot., 2019, 130, 1–5 CrossRef CAS.
- C. Henager, in Materials for the Hydrogen Economy, ed. R. Jones and G. Thomas, CRC Press, 2007, pp. 181–190 Search PubMed.
- E. Abohamzeh, F. Salehi, M. Sheikholeslami, R. Abbassi and F. Khan, Review of hydrogen safety during storage, transmission, and applications processes, J. Loss Prev. Process Ind., 2021, 72, 104569 CrossRef CAS.
- M. Ulsh, A. DeBari, J. M. Berliner, I. V. Zenyuk, P. Rupnowski, L. Matvichuk, A. Z. Weber and G. Bender, The development of a through-plane reactive excitation technique for detection of pinholes in membrane-containing MEA sub-assemblies, Int. J. Hydrogen Energy, 2019, 44, 8533–8547 CrossRef CAS.
- M. Wang, S. Medina, J. Ochoa-Lozano, S. Mauger, S. Pylypenko, M. Ulsh and G. Bender, Visualization, understanding, and mitigation of process-induced-membrane irregularities in gas diffusion electrode-based polymer electrolyte membrane fuel cells, Int. J. Hydrogen Energy, 2021, 46, 14699–14712 CrossRef CAS.
- M. Ulsh, J. M. Porter, D. C. Bittinat and G. Bender, Defect detection in fuel cell gas diffusion electrodes using infrared thermography, Fuel Cells, 2016, 16, 170–178 CrossRef CAS.
- P. K. Das, A. Z. Weber, G. Bender, A. Manak, D. Bittinat, A. M. Herring and M. Ulsh, Rapid detection of defects in fuel-cell electrodes using infrared reactive-flow-through technique, J. Power Sources, 2014, 261, 401–411 CrossRef CAS.
- A. Yan, P. Rupnowski, N. Guba and A. Nag, Towards deep computer vision for in-line defect detection in polymer electrolyte membrane fuel cell materials, Int. J. Hydrogen Energy, 2023, 48, 18978–18995 CrossRef CAS.
- X.-Z. Yuan, C. Song, H. Wang and J. Zhang, Electrochemical Impedance Spectroscopy in PEM Fuel Cells, Springer London, London, 2010 Search PubMed.
- M. A. Rubio, A. Urquia and S. Dormido, Diagnosis of performance degradation phenomena in PEM fuel cells, Int. J. Hydrogen Energy, 2010, 35, 2586–2590 CrossRef CAS.
- R. R. Gaddam, L. Katzenmeier, X. Lamprecht and A. S. Bandarenka, Review on physical impedance models in modern battery research, Phys. Chem. Chem. Phys., 2021, 23, 12926–12944 RSC.
- S. M. Rezaei Niya and M. Hoorfar, Study of proton exchange membrane fuel cells using electrochemical impedance spectroscopy technique – A review, J. Power Sources, 2013, 240, 281–293 CrossRef CAS.
- T. Lochner, M. Perchthaler, F. Hnyk, D. Sick, J. P. Sabawa and A. S. Bandarenka, Analysis of the capacitive behavior of polymer electrolyte membrane fuel cells during operation, ChemElectroChem, 2021, 8, 96–102 CrossRef CAS.
- T. Lochner, L. Hallitzky, M. Perchthaler, M. Obermaier, J. Sabawa, S. Enz and A. S. Bandarenka, Local degradation effects in automotive size membrane electrode assemblies under realistic operating conditions, Appl. Energy, 2020, 260, 114291 CrossRef CAS.
- J. P. Sabawa and A. S. Bandarenka, Investigation of degradation mechanisms in PEM fuel cells caused by low-temperature cycles, Int. J. Hydrogen Energy, 2021, 46, 15951–15964 CrossRef CAS.
- J. P. Sabawa and A. S. Bandarenka, Degradation mechanisms in polymer electrolyte membrane fuel cells caused by freeze-cycles: Investigation using electrochemical impedance spectroscopy, Electrochim. Acta, 2019, 311, 21–29 CrossRef CAS.
- T. Lochner, M. Perchthaler, J. T. Binder, J. P. Sabawa, T. A. Dao and A. S. Bandarenka, Real-time impedance analysis for the on-road monitoring of automotive fuel cells, ChemElectroChem, 2020, 7, 2784–2791 CrossRef CAS.
- S. Dirkes, J. Leidig, P. Fisch and S. Pischinger, Prescriptive Lifetime Management for PEM fuel cell systems in transportation applications, Part II: On-board operando feature extraction, condition assessment and lifetime prediction, Energy Convers. Manage., 2023, 283, 116943 CrossRef.
- J. Zhang, C. Song, J. Zhang, R. Baker and L. Zhang, Understanding the effects of backpressure on PEM fuel cell reactions and performance, J. Electroanal. Chem., 2013, 688, 130–136 CrossRef CAS.
- B. M. Stühmeier, M. R. Pietsch, J. N. Schwämmlein and H. A. Gasteiger, Pressure and temperature dependence of the hydrogen oxidation and evolution reaction kinetics on Pt electrocatalysts via PEMFC-based hydrogen-pump measurements, J. Electrochem. Soc., 2021, 168, 064516 CrossRef.
- A. Huth, B. Schaar and T. Oekermann, A “proton pump” concept for the investigation of proton transport and anode kinetics in proton exchange membrane fuel cells, Electrochim. Acta, 2009, 54, 2774–2780 CrossRef CAS.
- L. Wu, Z. Zhang, J. Ran, D. Zhou, C. Li and T. Xu, Advances in proton-exchange membranes for fuel cells: An overview on proton conductive channels (PCCs), Phys. Chem. Chem. Phys., 2013, 15, 4870 RSC.
- P. Knauth and M. L. Di Vona, Hydration and proton conductivity of ionomers: The model case of sulfonated aromatic polymers, Front. Energy Res., 2014, 2, 50 Search PubMed.
- C. Gerling, M. Hanauer, U. Berner and K. A. Friedrich, PEM single cells under differential conditions: Full factorial parameterization of the ORR and HOR kinetics and loss analysis, J. Electrochem. Soc., 2022, 169, 014503 CrossRef CAS.
- K. C. Neyerlin, W. Gu, J. Jorne and H. A. Gasteiger, Study of the exchange current density for the hydrogen oxidation and evolution reactions, J. Electrochem. Soc., 2007, 154, B631 CrossRef CAS.
- S. A. Watzele, L. Katzenmeier, J. P. Sabawa, B. Garlyyev and A. S. Bandarenka, Temperature dependences of the double layer capacitance of some solid/liquid and solid/solid electrified interfaces. An experimental study, Electrochim. Acta, 2021, 391, 138969 CrossRef CAS.
- D. A. Caulk and D. R. Baker, Heat and Water Transport in Hydrophobic Diffusion Media of PEM Fuel Cells, J. Electrochem. Soc., 2010, 157, B1237 CrossRef CAS.
- K. R. Harris and L. A. Woolf, Pressure and temperature dependence of the self diffusion coefficient of water and oxygen-18 water, J. Chem. Soc., Faraday Trans. 1, 1980, 76, 377 RSC.
- J. W. Darbyshire and J. B. Lawrence, An electrochemically based electrical fuel cell model. In an electrochemically based electrical fuel cell model, AUPEC, 2004 Search PubMed.
- T. Hoshiko, H. Nakajima, T. Konomi, T. Kitahara and S. Kita, Estimation of Water Layer Thickness Adjacent to the Cathode Catalyst Layer of a PEFC (Analysis Using Electrochemical Impedance Spectroscopy), ECS Trans., 2008, 16, 2117–2123 CrossRef CAS.
- N. Nonoyama, S. Okazaki, A. Z. Weber, Y. Ikogi and T. Yoshida, Analysis of oxygen-transport diffusion resistance in proton-exchange-membrane fuel cells, J. Electrochem. Soc., 2011, 158, B416 CrossRef CAS.
- L. Zhang, C. Ma and S. Mukerjee, Oxygen reduction and transport characteristics at a platinum and alternative proton conducting membrane interface, J. Electroanal. Chem., 2004, 568, 273–291 CrossRef CAS.
- Z. Fang, M. S. Lee, J. Y. Kim, J. H. Kim and T. F. Fuller, The effect of carbon support surface functionalization on PEM fuel cell performance, durability, and ionomer coverage in the catalyst layer, J. Electrochem. Soc., 2020, 167, 064506 CrossRef CAS.
- F. Haimerl, J. P. Sabawa, T. A. Dao and A. S. Bandarenka, Spatially resolved electrochemical impedance spectroscopy of automotive PEM fuel cells, ChemElectroChem, 2022, 9, e20220006 CrossRef.
- B. Ghorbani, J. DeVaal, G. Afonso and K. Vijayaraghavan, Use of reduced-voltage EIS to establish a relation between oxygen concentration and EIS responses of large commercial PEM fuel cell modules, Int. J. Hydrogen Energy, 2023, S0360319923021791 Search PubMed.
- R. Omrani and B. Shabani, Hydrogen crossover in proton exchange membrane electrolysers: The effect of current density, pressure, temperature, and compression, Electrochim. Acta, 2021, 377, 138085 CrossRef CAS.
Footnotes |
| † Electronic supplementary information (ESI) available. See DOI: https://doi.org/10.1039/d3im00075c |
| ‡ Equally contributing authors. |
| This journal is © Institute of Process Engineering of CAS 2024 |

