Exploring the potential of ruthenium(II)–phosphine–mercapto complexes as new anticancer agents†
Marcos V.
Palmeira-Mello
 ab,
Analu R.
Costa
 a,
Leticia P.
de Oliveira
a,
Olivier
Blacque
a,
Leticia P.
de Oliveira
a,
Olivier
Blacque
 c,
Gilles
Gasser
 *b and
Alzir A.
Batista
 *a
*a
aDepartament of Chemistry, Universidade Federal de São Carlos, 13561-901, São Carlos, SP, Brazil. E-mail: daab@ufscar.br
bChimie ParisTech, PSL University, CNRS, Institute of Chemistry for Life and Health Sciences, Paris, France. E-mail: gilles.gasser@chimeparistech.psl.eu; Web: https://www.gassergroup.com
cDepartment of Chemistry, University of Zurich, Winterthurerstrasse 190, 8057 Zurich, Switzerland
First published on 19th June 2024
Abstract
The search for new metal-based anticancer drug candidates is a fundamental task in medicinal inorganic chemistry. In this work, we assessed the potential of two new Ru(II)–phosphine–mercapto complexes as potential anticancer agents. The complexes, with the formula [Ru(bipy)(dppen)(Lx)]PF6 [(1), HL1 = 2-mercapto–pyridine and (2), HL2 = 2-mercapto–pyrimidine, bipy = 2,2′-bipyridine, dppen = cis-1,2-bis(diphenylphosphino)-ethylene] were synthesized and characterized by nuclear magnetic resonance (NMR) [1H, 31P(1H), and 13C], high resolution mass spectrometry (HR-MS), cyclic voltammetry, infrared and UV-Vis spectroscopies. Complex 2 was obtained as a mixture of two isomers, 2a and 2b, respectively. The composition of these metal complexes was confirmed by elemental analysis and liquid chromatography-mass spectrometry (LC-MS). To obtain insights into their lipophilicity, their distribution coefficients between n-octanol/PBS were determined. Both complexes showed affinity mainly for the organic phase, presenting positive log![[thin space (1/6-em)]](https://www.rsc.org/images/entities/char_2009.gif) P values. Also, their stability was confirmed over 48 h in different media (i.e., DMSO, PBS and cell culture medium) via HPLC, UV-Vis and 31P{1H} NMR spectroscopies. Since enzymes from the P-450 system play a crucial role in cellular detoxification and metabolism, the microsomal stability of 1, which was found to be the most interesting compound of this study, was investigated using human microsomes to verify its potential oxidation in the liver. The analyses by LC-MS and ESI-MS reveal three main metabolites, obtained by oxidation in the dppen and bipy moieties. Moreover, 1 was able to interact with human serum albumin (HSA). The cytotoxicity of the metal complexes was tested in different cancerous and non-cancerous cell lines. Complex 1 was found to be more selective than cisplatin against MDA-MB-231 breast cancer cells when compared to MCF-10A non-cancerous cells. In addition, complex 1 affects cell morphology and migration, and inhibits colony formation in MDA-MB-231 cells, making it a promising cytotoxic agent against breast cancer.
P values. Also, their stability was confirmed over 48 h in different media (i.e., DMSO, PBS and cell culture medium) via HPLC, UV-Vis and 31P{1H} NMR spectroscopies. Since enzymes from the P-450 system play a crucial role in cellular detoxification and metabolism, the microsomal stability of 1, which was found to be the most interesting compound of this study, was investigated using human microsomes to verify its potential oxidation in the liver. The analyses by LC-MS and ESI-MS reveal three main metabolites, obtained by oxidation in the dppen and bipy moieties. Moreover, 1 was able to interact with human serum albumin (HSA). The cytotoxicity of the metal complexes was tested in different cancerous and non-cancerous cell lines. Complex 1 was found to be more selective than cisplatin against MDA-MB-231 breast cancer cells when compared to MCF-10A non-cancerous cells. In addition, complex 1 affects cell morphology and migration, and inhibits colony formation in MDA-MB-231 cells, making it a promising cytotoxic agent against breast cancer.
Introduction
Cancer is a genetic disease associated with uncontrollable cell growth that can infiltrate normal tissues and spread throughout the body. Cancer cells present a microenvironment with different characteristics compared to normal cells such as dysregulated metabolism, resisting cell death, non-functional angiogenesis, high ATP demand, and low oxygen supply.1,2 Almost 19.3 million cases of cancer were reported in 2020. Breast cancer was the most commonly diagnosed cancer with almost 2.3 million cases.3 The treatment depends on several factors such as the subtype and the stage. A combination of chemotherapy, radiotherapy, and surgery (when it is possible) is so far the best strategy to avoid recurrence.4Platinum-based compounds have been employed in anticancer chemotherapy.5–7 Usually their mechanism of action involves the formation of platinum-DNA adducts which arise from covalent bonds between the platinum center and purine-N7 position of guanine or adenine residues.8 Although their efficacy has been demonstrated, several problems related to platinum drugs resistance are reported, which arise from enhanced efflux and consequently, the reduced accumulation of platinum drugs.9 In addition to platinum, several metals have been investigated as potential anticancer agents.10–19
For example, ruthenium-based compounds are considered promising alternatives to platinum complexes, exhibiting different chemical and structural characteristics from those presented by platinum drugs.20–23 Ruthenium complexes in general present an octahedral geometry, which allows variations of ligands in the coordination sphere, and are less susceptible to deactivation by detoxification agents in the biological environment.24 Several ruthenium(II)-based compounds have reached clinical trials, such as NAMI-A, KP-1019 and BOLD-100 (Fig. 1).25–27
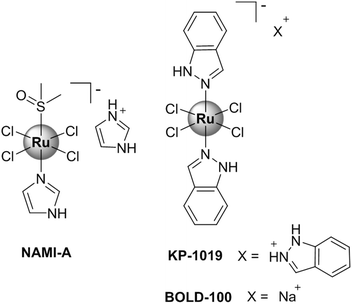 | ||
| Fig. 1 Chemical structures of ruthenium complexes (NAMI-A, KP-1019 and BOLD-100) that reached clinical trials. | ||
The coordination of bioactive ligands to a ruthenium center is one of several strategies that allow the development of new anticancer agents.28–31 Ruthenium(II)–phosphine complexes, which were primarily known for their catalytic applications, have gained special attention due to their promising cytotoxicity properties.32–39 In general, the presence of phosphine in the complexes improves their lipophilicity, which is a crucial factor for the stability of the complexes and their internalization and anticancer property.40,41 In this direction, complexes 1 and 2a/2b (see Scheme 1) were synthesized and characterized. As pharmacokinetics (PK) is an important parameter that can hamper the correlation between in vitro/in vivo performance,42–44 we have decided to investigate the formation of potential metabolites from our ruthenium(II)–phosphine complexes. Since CYP P-450 enzymes play an important role in drug metabolism, human liver microsomes (HLM) were used to obtain important insights about the microsomal stability of complex 1 and its possible oxidation in the liver. To the best of our knowledge, this is the first metabolic study involving a Ru(II)–phosphine–mercapto complex. The cytotoxicity of these metal complexes was investigated in MDA-MB-231 (triple negative breast cancer), MCF-7 (breast cancer), and MCF-10A (nontumor breast epithelial) cell lines. Cell morphology, migration and clonogenic experiments were also performed. We demonstrated that 1 presents anti-migratory capacity and inhibits the colony formation in breast cancer cells, making it a promising anticancer compound.
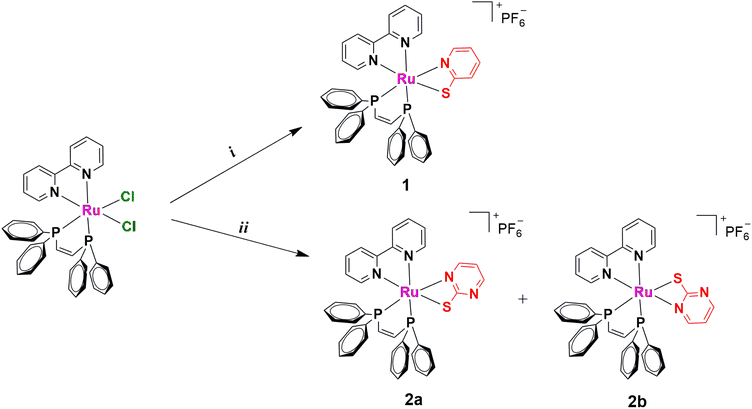 | ||
Scheme 1 Synthetic procedures for complexes 1 and 2a/2b (i) 2-mercaptopyridine or 2-mercaptopyrimidine, Et3N, KPF6, MeOH/DCM (1![[thin space (1/6-em)]](https://www.rsc.org/images/entities/char_2009.gif) : :![[thin space (1/6-em)]](https://www.rsc.org/images/entities/char_2009.gif) 1), reflux, 24 h. 1), reflux, 24 h. | ||
Results and discussion
Metal complexes 1 and 2a/2b were synthesized by refluxing the precursor cis-[RuCl2(bipy)(dppen)] (bipy = 2,2′-bipyridine, dppen = cis-1,2-bis(diphenylphosphino)-ethylene) with the respective mercapto ligand, 2-mercapto–pyridine (HL1) or 2-mercapto–pyrimidine (HL2), in MeOH/DCM (1![[thin space (1/6-em)]](https://www.rsc.org/images/entities/char_2009.gif) :
:![[thin space (1/6-em)]](https://www.rsc.org/images/entities/char_2009.gif) 1) in the presence of triethylamine (Scheme 1). Yellow powders were obtained after adding KPF6 to the reaction mixture. The metal complexes were characterized by NMR [1H, 31P{1H}, and 13C] spectroscopy (Fig. S1–S8†). The 31P{1H} signals in compounds 1 and 2a/2b spectra are shifted to higher frequencies (more deshielding effect) when compared with the precursor cis-[RuCl2(bipy)(dppen)] as a consequence of the exchange of chlorido ligands (π- and σ-donor) by the mercapto skeleton (π-acceptor) (Fig. S9†). For 1, in its 31P{1H}, there is only one set of peaks, two doublets at 77.08 and 74.16 ppm, which are assigned to the two phosphorus atoms (d, J = 11.4 Hz) in the dppen ligand. On the other hand, these signals are duplicated in 2a/2b, and four doublets can be observed at 77.39 and 74.97 ppm (d, J = 11.6 Hz) and at 79.70 and 67.62 ppm (d, J = 6.1 Hz). A similar pattern is observed in the 1H NMR spectrum, indicating the presence of two isomers in solution, 2a and 2b, respectively. The first one contains the two phosphorus atoms trans to N from bipy and mercapto moieties, and a second one presents one P trans to Smercapto and another one coordinated trans to Nbipy. This behavior was already observed for other Ru(II)–phosphine complexes.45,46 For 1, in its 31P{1H} NMR spectrum, there are also signals of two isomers, but in this case, the amount of one of them is insignificant. As expected, in the 1H NMR spectra of 1 and 2a/2b, a heptet around −144 ppm is observed and ascribed to the PF6− anion. These findings were confirmed by LC-MS experiments. Results obtained in methanol revealed the presence of only one species for 1 with a retention time (RT) of 12.47 min (m/z+ = 764.10). As expected, for 2a/2b, two different peaks can be observed in the chromatogram at 11.55 and 11.19 min, assigned to 2a and 2b (m/z+ = 765.00) (Fig. S10†). The integrated areas of these chromatographic peaks confirm the presence of these isomers, in a ratio of 1
1) in the presence of triethylamine (Scheme 1). Yellow powders were obtained after adding KPF6 to the reaction mixture. The metal complexes were characterized by NMR [1H, 31P{1H}, and 13C] spectroscopy (Fig. S1–S8†). The 31P{1H} signals in compounds 1 and 2a/2b spectra are shifted to higher frequencies (more deshielding effect) when compared with the precursor cis-[RuCl2(bipy)(dppen)] as a consequence of the exchange of chlorido ligands (π- and σ-donor) by the mercapto skeleton (π-acceptor) (Fig. S9†). For 1, in its 31P{1H}, there is only one set of peaks, two doublets at 77.08 and 74.16 ppm, which are assigned to the two phosphorus atoms (d, J = 11.4 Hz) in the dppen ligand. On the other hand, these signals are duplicated in 2a/2b, and four doublets can be observed at 77.39 and 74.97 ppm (d, J = 11.6 Hz) and at 79.70 and 67.62 ppm (d, J = 6.1 Hz). A similar pattern is observed in the 1H NMR spectrum, indicating the presence of two isomers in solution, 2a and 2b, respectively. The first one contains the two phosphorus atoms trans to N from bipy and mercapto moieties, and a second one presents one P trans to Smercapto and another one coordinated trans to Nbipy. This behavior was already observed for other Ru(II)–phosphine complexes.45,46 For 1, in its 31P{1H} NMR spectrum, there are also signals of two isomers, but in this case, the amount of one of them is insignificant. As expected, in the 1H NMR spectra of 1 and 2a/2b, a heptet around −144 ppm is observed and ascribed to the PF6− anion. These findings were confirmed by LC-MS experiments. Results obtained in methanol revealed the presence of only one species for 1 with a retention time (RT) of 12.47 min (m/z+ = 764.10). As expected, for 2a/2b, two different peaks can be observed in the chromatogram at 11.55 and 11.19 min, assigned to 2a and 2b (m/z+ = 765.00) (Fig. S10†). The integrated areas of these chromatographic peaks confirm the presence of these isomers, in a ratio of 1![[thin space (1/6-em)]](https://www.rsc.org/images/entities/char_2009.gif) :
:![[thin space (1/6-em)]](https://www.rsc.org/images/entities/char_2009.gif) 0.6. This result is consistent with the ones observed by NMR spectroscopy (Table S1†). The IR spectra of these complexes show peaks around 840 cm−1, confirming the presence of the PF6− counter ion (Fig. S11 and S12†) in the obtained products. This observation is in agreement with the molar conductance of the complexes obtained in DMSO, which supported these compounds as hexafluorophosphate salts of the type 1
0.6. This result is consistent with the ones observed by NMR spectroscopy (Table S1†). The IR spectra of these complexes show peaks around 840 cm−1, confirming the presence of the PF6− counter ion (Fig. S11 and S12†) in the obtained products. This observation is in agreement with the molar conductance of the complexes obtained in DMSO, which supported these compounds as hexafluorophosphate salts of the type 1![[thin space (1/6-em)]](https://www.rsc.org/images/entities/char_2009.gif) :
:![[thin space (1/6-em)]](https://www.rsc.org/images/entities/char_2009.gif) 1 electrolytes.47
1 electrolytes.47
Although the isomers from 2a/2b could not be isolated, suitable single crystals were obtained only for 2b in a methanol/DCM (1![[thin space (1/6-em)]](https://www.rsc.org/images/entities/char_2009.gif) :
:![[thin space (1/6-em)]](https://www.rsc.org/images/entities/char_2009.gif) 1) mixture for X-ray diffraction (XRD) experiments. Complex 2b crystallizes in a monoclinic system, in a P21/c space group. In this configuration, the ruthenium(II) ion lies on a distorted octahedral environment, coordinated to dppen moiety (P1 and P2), one bipy (N3 and N4), and a mercapto ligand in its deprotonated form (N1 and S1) (Fig. 2). In this structure, the S1 is coordinated trans to P1 while N1 is trans to N4. Furthermore, the Ru–S1 and Ru–N1 bond distances are 2.4602(4) and 2.0817(4) Å, respectively, which are in agreement with those observed for Ru(II)–mercapto-based complexes (for more information, see ESI, Table S2–S4†). For 1 and 2a/2b, elemental analysis and ESI-HRMS results are in agreement with theoretical values (Fig. S13 and S14†). The UV-Vis spectra of the complexes recorded in DMSO (Fig. S15†) revealed the presence of a band with absorption at 298 nm, centered in the ancillary ligands. Additionally, a second one can be observed around 402 nm, which is characteristic of metal-to-ligand charge transfer (MLCT).48
1) mixture for X-ray diffraction (XRD) experiments. Complex 2b crystallizes in a monoclinic system, in a P21/c space group. In this configuration, the ruthenium(II) ion lies on a distorted octahedral environment, coordinated to dppen moiety (P1 and P2), one bipy (N3 and N4), and a mercapto ligand in its deprotonated form (N1 and S1) (Fig. 2). In this structure, the S1 is coordinated trans to P1 while N1 is trans to N4. Furthermore, the Ru–S1 and Ru–N1 bond distances are 2.4602(4) and 2.0817(4) Å, respectively, which are in agreement with those observed for Ru(II)–mercapto-based complexes (for more information, see ESI, Table S2–S4†). For 1 and 2a/2b, elemental analysis and ESI-HRMS results are in agreement with theoretical values (Fig. S13 and S14†). The UV-Vis spectra of the complexes recorded in DMSO (Fig. S15†) revealed the presence of a band with absorption at 298 nm, centered in the ancillary ligands. Additionally, a second one can be observed around 402 nm, which is characteristic of metal-to-ligand charge transfer (MLCT).48
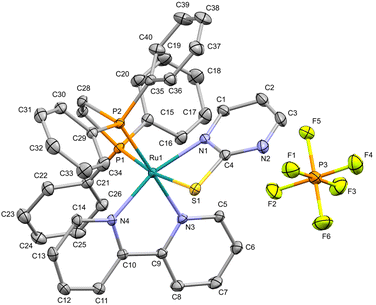 | ||
| Fig. 2 The molecular structure of 2b with displacement ellipsoids drawn at the 30% probability level. Hydrogen atoms are excluded for clarity. | ||
The electrochemical behavior of the metal complexes was investigated by the cyclic voltammetry (CV) technique. Measurements in DCM revealed quasi-reversible processes, associated with the couple Ru(II)/Ru(III) (Table 1). As described in several metal-based systems, the metal-centered process can be modulated by the different donor/acceptor properties of the ligands.49,50 In the present case, the chlorido replacement (π- and σ-donor) by the mercapto ligand (π-acceptor) changes the electron density over the Ru(II) center, providing a higher electrochemical stability.37 Thus, the E1/2 observed for the Ru(II)–phosphine complexes are found at 0.95 and 1.11 V vs. Ag/AgCl, respectively, which are the following values already reported for Ru(II)–phosphine–mercapto complexes (Fig. 3).40,41
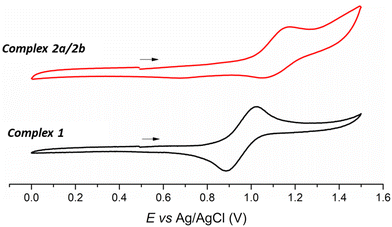 | ||
| Fig. 3 Cyclic voltammogram of Ru(II)–phosphine–mercapto complexes 1 and 2a/2b in DCM (0.1 mol L−1 TBAP). Scan rate 50 mV s−1. | ||
| E pa | E pc | E 1/2 | |
|---|---|---|---|
| [Ru(bipy)(dppen)(L1)] (1) | 1.02 | 0.89 | 0.95 |
| [Ru(bipy)(dppen)(L2)] (2a/2b) | 1.16 | 1.06 | 1.11 |
The lipophilicity is an important parameter in drug design, playing a crucial role in the pharmacokinetic process. To assess this physicochemical property, the n-octanol/PBS partition coefficient (log![[thin space (1/6-em)]](https://www.rsc.org/images/entities/char_2009.gif) P) of complexes 1 and 2a/2b was determined by the shake-flask method.51 These complexes were found principally in an organic layer. The results indicate a similar lipophilic profile for 1 (log
P) of complexes 1 and 2a/2b was determined by the shake-flask method.51 These complexes were found principally in an organic layer. The results indicate a similar lipophilic profile for 1 (log![[thin space (1/6-em)]](https://www.rsc.org/images/entities/char_2009.gif) P = 0.89 ± 0.12) and 2a/2b (log
P = 0.89 ± 0.12) and 2a/2b (log![[thin space (1/6-em)]](https://www.rsc.org/images/entities/char_2009.gif) P = 1.00 ± 0.10) with little deviations (Fig. 4). To investigate the possible aggregation of our ruthenium complexes in phosphate buffered saline (PBS), dynamic light scattering (DLS) experiments were performed in PBS containing 10% fetal bovine serum (FBS) (Fig. 4 and S16†). The low diameters and polydispersity indexes (PDIs) observed for both complexes suggests their stabilization due the presence of plasmatic proteins, as already reported in the literature.52
P = 1.00 ± 0.10) with little deviations (Fig. 4). To investigate the possible aggregation of our ruthenium complexes in phosphate buffered saline (PBS), dynamic light scattering (DLS) experiments were performed in PBS containing 10% fetal bovine serum (FBS) (Fig. 4 and S16†). The low diameters and polydispersity indexes (PDIs) observed for both complexes suggests their stabilization due the presence of plasmatic proteins, as already reported in the literature.52
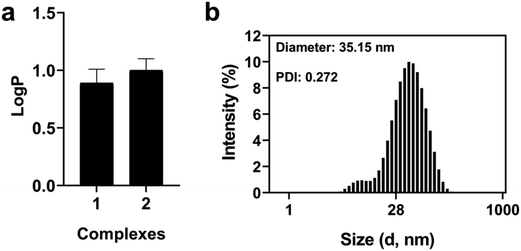 | ||
| Fig. 4 Solubility and aggregation of Ru(II) complexes 1 and 2a/2b. (a) Partition coefficient between n-octanol/PBS and (b) size distribution by the intensity (20 μM) in PBS 10% FBS. | ||
Stability studies
Since the stability of a drug in solution directly affects its biological profile, the stability of the compounds 1 and 2a/2b was assessed. First, the 31P{1H} NMR spectra of the complexes were measured at different times in DMSO and DMSO containing 30% DMEM, over 48 h. No significant changes were detected in the samples, indicating their stability during this time (Fig. S17–S20†). The complexes were also found to be stable according to their UV-visible spectra recorded in DMSO solution over 48 h. Little changes were observed in their UV-Vis spectra in DMSO/PBS, indicating that most of these complexes remained stable during this time. Furthermore, their stabilities were also confirmed by HPLC in a cell culture medium containing 10% FBS, indicating their integrity in the biological environment over 48 h (Fig. S21–S25†).Metabolic studies with human liver microsomes
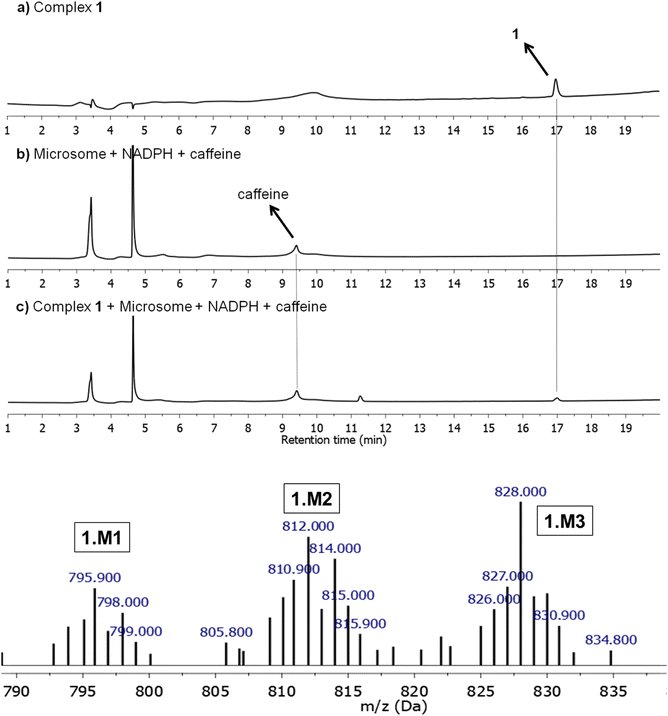
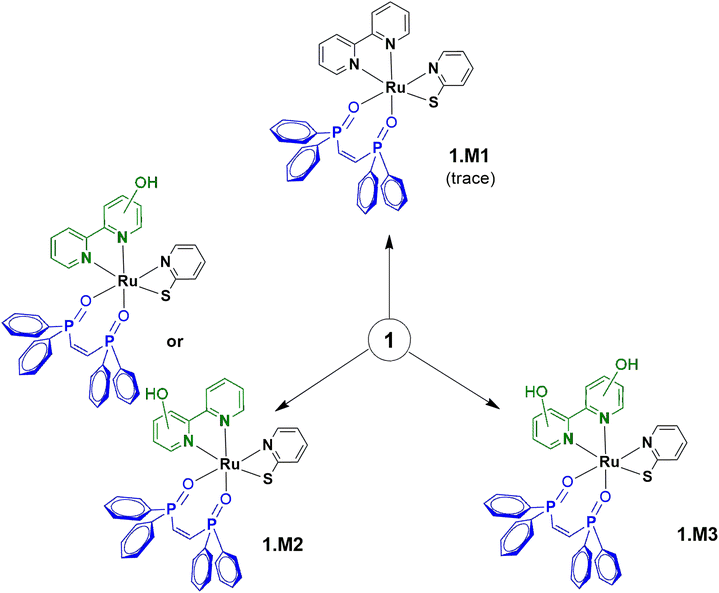
Microsomal stability tests are crucial to evaluate the metabolic process of drug candidates and their ADME (absorption, distribution, metabolism & elimination) profile.53 Since several drugs present a metabolism mediated via hepatic cytochrome P450 system, these approaches can be used to measure in vitro intrinsic clearance and identify possible metabolites eventually formed in solution.54,55 Here, the metabolism of 1, which was found to be the most promising compound of this study (see below), was investigated using human liver microsomes (HLM) that are fractions mostly derived from the endoplasmatic reticulum and are constituted by several enzymes from the cytochrome P450 system. Due to its inexpensive value and practical use, microsomes are employed to study in vitro drug metabolism, serving as screening to detect and characterize drug metabolites, playing an important role in the pharmacokinetic (PK) process. In this direction, 1 was incubated with HLM in the presence of NADPH (nicotinamide adenine dinucleotide phosphate), an enzyme co-factor of phase I metabolism, at 37 °C for 6 h. 1 only and microsomes in the presence of the co-factor were also prepared and caffeine was used as a standard control. As presented, 1 was detected at a retention time of 17.0 min, by LC-MS (positive ion electrospray mode) and remained unchanged with corresponding m/z+ = 764.10 (Fig. 5 and S26†). In the presence of microsome/NADPH, a decrease of almost 14% of this peak in the LC spectrum was detected, indicating the consumption of the ruthenium(II) compound (Table S5†). It should be mentioned that peaks close to 3.4 and 4.7 min came from the microsome/NADPH mixture. The formation of metabolites 1.M1, 1.M2, and 1.M3 was confirmed upon ESI-MS analyses (Fig. 5 and S27†). These species were detected at a retention time of ∼14.7 min in the HPLC experiment and present mass spectra patterns with peaks at m/z+ = 795.90, 812.00, and 828.00, respectively (Fig. 5). The less abundant metabolite 1.M1 (<1%) has been obtained by oxidation of phosphorus in dppen ligand forming an O-coordinated pentavalent oxide (calculated m/z = 796.08). It should be mentioned that this coordination mode has already been reported for similar ruthenium-based compounds.56,57 The most abundant metabolites 1.M2 and 1.M3 present peaks that match well the molecular weight of products formed from oxidation of bipy ligand (calculated m/z = 812.08 and 828.08) and can be associated with isomers containing hydroxyl group(s) at different positions on the aromatic ring. Similar results have been reported by Maximiano et al. which investigated Phase I and II metabolites from ruthenium-cyclopentadienyl anticancer compounds (Scheme 2).58Human serum albumin interaction
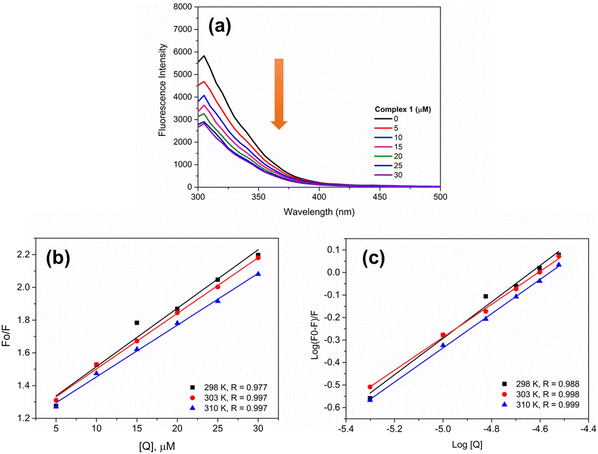
Human serum albumin (HSA) is the most important transport protein present in the human circulatory system. The interaction between HSA and metal-based compounds is an important parameter that can affects the pharmacokinetic process. This interaction can occur via one or two binding sites of the protein, namely, site I (warfarin site) and site II (benzodiazepine site). Here, the interaction between 1 and HSA was investigated via analysis of the fluorescence quenching of the protein in the presence of 1 (Fig. 6). To assess this effect, the Stern–Volmer relationship was applied. As observed in Table 2, the quenching constant (KSV) was decreased with increasing temperature, indicating fluorescence suppression via a static mechanism. This implies the formation of a complex between the fluorophore and the suppressor in the ground state. Moreover, the bimolecular quenching rate constant (Kq) is in the order of 1012 M−1 s−1, higher than the maximum for dynamic quenching (kq = 2.0 × 10¹⁰ M−1 s−1), also confirming this quenching mechanism.36 The binding constant (Kb) was determined and the results indicate that 1 interacts with HSA with affinities in a similar order to other ruthenium(II) complexes.59–61| Complex | T (K) | K SV (104, M−1) | k q (1012, M−1 s−1) | K b (103, M−1) | n | ΔG (KJ mol−1) |
|---|---|---|---|---|---|---|
| 1 | 298 | 3.77 ± 0.35 | 6.30 | 11.10 ± 0.11 | 0.87 | −23.09 ± 5.29 |
| 303 | 3.68 ± 0.40 | 6.10 | 6.37 ± 0.12 | 0.82 | −22.08 ± 5.36 | |
| 310 | 3.44 ± 0.37 | 5.70 | 8.04 ± 0.12 | 0.85 | −23.19 ± 5.47 |
Furthermore, the KSV and kq parameters are similar to those obtained for the platinum drug oxaliplatin, implying that both compounds interact with serum albumin through a similar mechanism.62
The thermodynamic parameters free energy change (ΔG°), entropy change (ΔS°), and enthalpy (ΔH°) were also obtained. The ΔG values indicate that the interaction occurs spontaneously at the temperature studied. In addition, negative values of ΔH and positive values for ΔS, as observed for 1, −17.46 kJ mol−1 and 17.54 J mol−1, respectively, indicate an interaction via electrostatic contacts.
Cytotoxicity studies
The cytotoxic profile of 1 and 2a/2b was investigated in human breast cancer MDA-MB-231 [estrogen receptor-negative (ER−)] and MCF-7 [estrogen receptor-positive (ER+)] cells, as well as noncancerous breast MCF-10A cells after 48 h of incubation, using the colorimetric MTT assay. Complexes 1 and 2a/2b are cytotoxic in all cell lines tested (Fig. S28 and S29†), and were found to be more cytotoxic in triple-negative breast cancer cells, with IC50 (μM) values lower than those obtained for cisplatin, 26- and 35-fold more potent, respectively. Although it shows high cytotoxicity on MDA-MB-231 cells (IC50 = 0.48 μM), unfortunately 1 also affects MCF-10A non-cancerous cells, exhibiting IC50 values of 1.28 μM. Despite this result, both metal complexes showed a higher selectivity index (SI) in MDA-MB-231 compared to the cisplatin control (Table 3). It should be mentioned that analogous Ru(II)–phosphine compounds were tested and their mixture of isomers presented similar IC50 values when compared to the isolated isomers.45 The precursor and free ligands HL1 and HL2 are not cytotoxic at the maximum concentration tested. Thus, due to its promising results, 1 was selected for future biological studies.| MDA-MB-231 | MCF-7 | MCF-10A | SI1 | SI2 | |
|---|---|---|---|---|---|
| SI1 = IC50 MCF10A/IC50 MDA-MB-231; SI2 = IC50 MCF10A/IC50 MCF7. | |||||
| 1 | 0.48 ± 0.04 | 1.64 ± 0.13 | 1.28 ± 0.08 | 2.7 | 0.78 |
| 2a/2b | 0.35 ± 0.04 | 1.19 ± 0.09 | 0.79 ± 0.03 | 2.2 | 0.66 |
| Precursor | >100 | >100 | >100 | — | — |
| HL1 | >100 | >100 | >100 | — | — |
| HL2 | >100 | >100 | >100 | — | — |
| Cisplatin | 12.43 ± 0.20 | 13.98 ± 0.40 | 23.90 ± 0.70 | 1.92 | 1.71 |
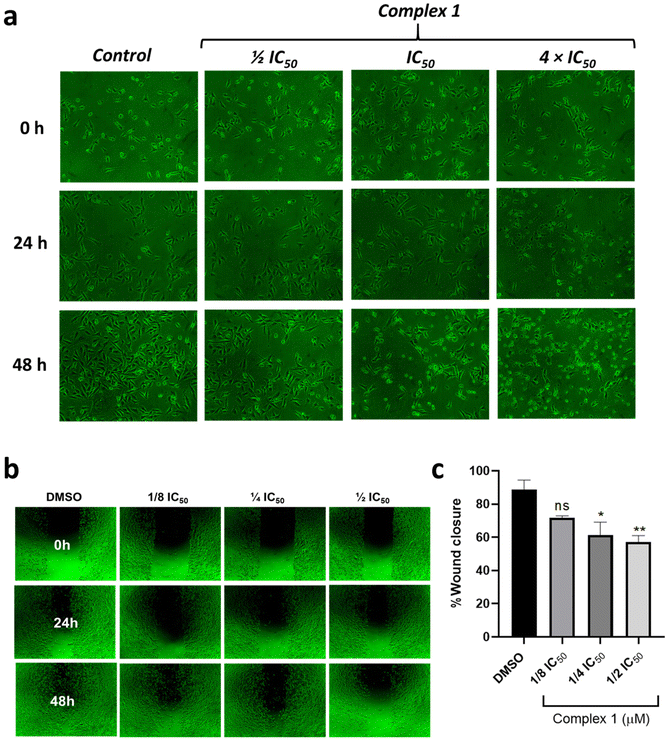
Thus, the effect of 1 in the morphology of MDA-MB-231 cancer cells was investigated. After treatment of the cells during 48 h, a decrease in their density and adhesion was observed. Moreover, significant changes in the morphology of the cells were detected at higher concentrations, such as cell shrinkage and fragmentation, suggesting cell death/damage (Fig. 7).
Cell migration is an important process directly involved in tissue repair that can contribute to the formation of metastasis, playing a crucial role in cancer progression. Also, metastasis constitutes the main cause of death in cancer disease and remains poorly understood.63,64 In this direction, the anti-migratory capacity of 1 was investigated using the wound healing assay in MDA-MB-231 cells (Fig. 7). For this purpose, cells were seeded, and once they reached confluence, a scratch was made on the adherent cell monolayer using a sterile pipette tip. A culture medium containing 1 at different concentrations was added and the images were taken at 0, 24, and 48 h. Results presented in Fig. 8b reveal that, as expected, cells treated with DMSO had significant migratory potential. On the other hand, cells treated with 1 at concentrations of 0.06, 0.12, and 0.24 μM (1/8 IC50, 1/4 IC50, and 1/2 IC50 concentration) presented lower migration capacity and consequently lower percentage of wound closure, thus reflecting its potential as cell migration inhibitor.
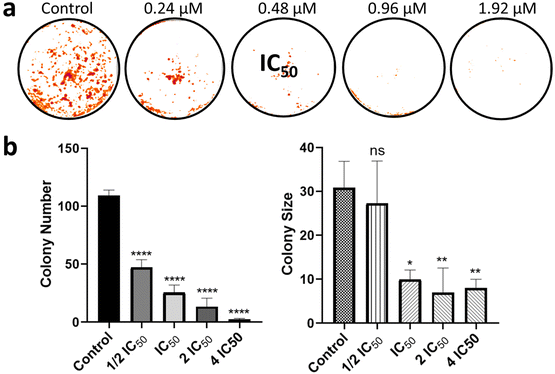
Upon verifying the anti-migratory capacity, a clonogenic assay was performed to investigate how 1 affects colony formation in MDA-MB-231 cells (Fig. 8). The clonogenic assay measures the capacity of a single cell to form a colony of 50 or more cells in vitro.65 Here, MDA-MB-231 cells were treated with different concentrations of 1, and the colonies formed after 7 days were colored with violet-blue, washed, and dried. A decrease in the colony number upon treatment with 1 at 0.24 μM (½ IC50 concentration) was observed in Fig. 8. Also, the size of the colonies was drastically reduced in the presence of 1 at 0.48 μM (IC50 concentration) when compared to the untreated control, indicating the ability of 1 to reduce the clonogenic survival of MDA-MB-231 cells.
Conclusion
In this work [Ru(L1)(bipy)(dppen)]PF6 (HL1 = 2-mercapto–pyridine) (1) and [Ru(L2)(bipy)(dppen)]PF6 (HL2 = 2-mercapto–pyrimidine) (2a/2b) were synthesized and characterized. For 2b, the crystal structure was solved by X-ray diffraction. The stability studies in different media revealed that 1 and both isomers 2a/2b are stable under biological conditions. For 1, microsomal stability with human liver microsomes/NADPH revealed three metabolites, containing oxidized dppen and/or bipy moieties. The Ru(II) complexes were found to be more cytotoxic than cisplatin, and 1 was 3-fold more selective against MDA-MB-231 cancer cells when compared to MCF-10A non-cancerous cells. Complex 1 was able to induce morphological alterations, inhibit the migration, and reduce the clonogenic survival in MDA-MB-231 cells, making it a promising cytotoxic agent against breast cancer.Experimental section
Materials and instruments
All chemicals were of either reagent or analytical grade and were used as purchased from commercial sources without additional purification. RuCl3·3H2O, 1,2-bis(diphenylphosphino)ethylene (dppen), 2-mercapto–pyridine (HL1) and 2-mercapto–pyrimidine (HL2) ligands were provided by Sigma Aldrich. All solvents were of analytical or HPLC grade. When necessary, solvents were degassed by purging with dry, oxygen-free nitrogen for at least 30 min before use. Microsomes were obtained from Gibco, NADPH tetrasodium salt from Sigma Aldrich, and caffeine from TCI Chemicals. 1H, 31P, and 13C NMR spectra were recorded on a Bruker DRX 400 MHz spectrometer using CH2Cl2/D2O or DMSO-d6, and using the signal of the deuterated solvent as an internal standard. The chemical shifts (δ) are reported in ppm (parts per million) and coupling constants J are given in hertz (Hz). High-resolution ESI mass spectrometry (HR ESI-MS) experiments were carried out using a LTQ-Orbitrap XL from Thermo Scientific (Thermo Fisher Scientific, Courtaboeuf, France) and operated in positive ionization mode. Infrared spectra were recorded in a SpectrumTwo FTIR spectrometer (Perkin–Elmer) equipped with a Specac Golden GateTM ATR (attenuated total reflection) accessory; applied as neat samples; 1/λ in cm−1. Elemental analyses were performed in the Microanalytical Laboratory at the Universidade Federal de São Carlos, São Carlos, Brazil, with an EA 1108 microanalyzer (Fisons Instruments) configured for % CHN. Analytical HPLC measurement was performed using the following system: 2xAgilent G1361 1260 Prep Pump system with an Agilent G7115 A 1260 DAD WR Detector equipped with an Agilent Pursuit XRs 5 C18 (100 Å, C18 5 μm 250 × 4.6 mm) Column and an Agilent G1364B 1260-FC fraction collector. The solvents (HPLC grade) were Millipore water (0.1% TFA, solvent A) and acetonitrile (0.1% TFA, solvent B). The HPLC gradients used are as follows: 0–1 min: isocratic 95% A (5% B); 1–12 min: linear gradient from 95% A (5% B) to 0% A (100% B); 12–14 min: isocratic 0% A (100% B); 14–15 min: linear gradient from 0% A (100% B) to 95% A (5% B). The flow rate was 1 mL min−1. Detection was performed at 250 nm with a slit of 4 nm. The UV–Vis spectra were recorded on a Hewlett-Packard 8452A diode array or in a Varian Cary 8454” spectrophotometer using a 1 cm path length quartz cuvette. Conductivity values were obtained, at room temperature, using 1.0 mM solutions of the complexes in DCM in a Meter Lab CDM2300 instrument.Synthesis of complexes
The metal complexes 1 and 2a/2b were obtained from the cis-[RuCl2(bipy)(dppen)] precursor. In a Schlenk flask containing 20 mL of methanol and 10 mL of DCM previously degassed, 11 mg (0.10 mmol) of respective mercapto ligand and 50 μL of Et3N were added. After 30 min, 75 mg of precursor cis-[RuCl2(bipy)(dppen)] (0.10 mmol) and 37 mg of KPF6 were added. The mixture was refluxed for 24 h. After this period, the final volume was reduced to 3 mL approximately and water was added to induce the precipitation. The orange solid obtained was washed with water, diethyl ether, and dried under vacuum.[Ru(L1)(bipy)(dppen)]PF6 (1): yield (52 mg, 62%), 31P{1H} NMR (162 MHz, DMSO) δ 77.08 (d, J = 11.4 Hz), 74.16 (d, J = 11.5 Hz). 1H NMR (400 MHz, DMSO) δ 9.64 (d, J = 3.2 Hz, 1H), 8.72 (t, J = 9.0 Hz, 1H), 8.58 (t, J = 9.1 Hz, 1H), 8.40 (dd, J = 16.7, 8.5 Hz, 2H), 8.26 (dd, J = 17.6, 8.6 Hz, 2H), 8.12 (t, J = 7.4 Hz, 1H), 7.79 (dd, J = 19.5, 8.3 Hz, 3H), 7.73–7.69 (m, 1H), 7.63 (d, J = 4.6 Hz, 1H), 7.56 (d, J = 7.1 Hz, 1H), 7.52–7.44 (m, 7H), 7.31 (s, 2H), 7.24 (t, J = 7.1 Hz, 1H), 7.16–7.10 (m, 2H), 7.08 (d, J = 7.1 Hz, 1H), 6.96–6.91 (m, 1H), 6.82 (t, J = 6.7 Hz, 2H), 6.70 (t, J = 7.3 Hz, 3H), 6.54 (d, J = 8.1 Hz, 1H), 6.29 (t, J = 8.6 Hz, 2H). 13C NMR (101 MHz, DMSO) δ 181.40, 157.45, 155.85, 155.06, 151.62, 151.54, 151.62, 150.79, 150.60, 149.96, 149.38, 147.82, 138.95, 137.79, 136.24, 135.86, 134.29, 134.26, 134.14, 132.31, 132.06, 131.70, 130.60, 130.31, 129.25, 129.25, 127.84, 127.11, 126.03, 125.75, 124.68, 124.39, 124.06, 122.67, 117.75, 46.17. ESI-HRMS (positive detection mode): calculated for C41H34N3P2RuS [M]+m/z 764.0987; Found 764.0969. Elemental analysis calculated for C41H34F6N3P3RuS·0.2CH3OH (%): C, 54.07; H, 3.83; N, 4.59; Found: C, 54.35; H, 4.22; N, 5.00. UV-Vis (DMSO): λmax (ε × 10−3 M−1 cm−1): 298 nm (32.46), 402 nm (5.48). IR: ν (cm−1): 3672.34, 3053.73, 1966.26, 1601.75, 1544.88, 1579.52, 1482.80, 1434.90, 1469.48, 1420.72, 1444.11, 1275.91, 1311.04, 1244.33, 1158.66, 1138.27, 1097.62, 1071.04, 998.72, 840.85, 760.13, 698.36. The solvents (HPLC grade) were Millipore water (0.1% TFA, solvent A) and acetonitrile (0.1% TFA, solvent B). The HPLC gradients used are as follows: 0–1 min: isocratic 95% A (5% B); 1–12 min: linear gradient from 95% A (5% B) to 0% A (100% B); 12–14 min: isocratic 0% A (100% B); 14–15 min: linear gradient from 0% A (100% B) to 95% A (5% B). TR = 12.471 min. Molar conductance (μS cm−1, CH2Cl2): 42.19.
[Ru(L2)(bipy)(dppen)]PF6 (2a/2b): yield (60 mg, 66%). 31P{1H} NMR (162 MHz, DMSO) δ 79.70 (d, J = 6.0 Hz), 77.39 (d, J = 11.6 Hz), 74.97 (d, J = 11.6 Hz), 67.62 (d, J = 6.3 Hz). 1H NMR (400 MHz, DMSO) δ 9.55 (s, 1H), 8.96–8.75 (m, 1H), 8.72 (t, J = 9.4 Hz, 1H), 8.59 (dd, J = 15.1, 8.2 Hz, 1H), 8.46 (t, J = 7.2 Hz, 2H), 8.36–8.12 (m, 6H), 7.94 (t, J = 2.9 Hz, 1H), 7.91–7.71 (m, 7H), 7.67 (d, J = 6.1 Hz, 2H), 7.64–7.47 (m, 12H), 7.26 (t, J = 7.1 Hz, 1H), 7.16 (t, J = 6.9 Hz, 2H), 7.12–7.04 (m, 2H), 7.03–6.94 (m, 2H), 6.90–6.77 (m, 6H), 6.69–6.62 (m, 2H), 6.49 (t, J = 8.8 Hz, 1H), 6.29 (t, J = 8.6 Hz, 2H), 6.04 (d, J = 3.3 Hz, 1H). 13C NMR (101 MHz, DMSO) δ 156.11, 155.31, 133.68, 133.55, 132.39, 132.39, 131.41, 131.32, 130.14, 130.39, 129.28, 129.17, 127.79, 124.10, 40.57, 40.55, 39.78, 39.74, 39.53, 39.32. ESI-HRMS (positive detection mode): calculated for C40H33N4P2RuS [M]+m/z 765.0939; found 765.0953. Elemental analysis calculated for C40H33F6N4P3RuS·0.3H2O (%): C, 52.50; H, 3.70; N, 6.12; found: C, 52.12; H, 3.36; N, 5.91. UV-Vis (DMSO): λmax (ε × 10−3 M−1 cm−1): 298 nm (17.07), 400 nm (2.91). IR: ν (cm−1): 3667.03, 3054.27, 1966.77, 1602.18, 1562.57, 1540.24, 1469.93, 1482.65, 1434.72, 1375.10, 1311.40, 1249.45, 1187.90, 1161.39, 1070.67, 1097.21, 999.28, 841.72, 761.30, 698.60, 657.59. The solvents (HPLC grade) were Millipore water (0.1% TFA, solvent A) and acetonitrile (0.1% TFA, solvent B). The HPLC gradients used are as follows: 0–1 min: isocratic 95% A (5% B); 1–12 min: linear gradient from 95% A (5% B) to 0% A (100% B); 12–14 min: isocratic 0% A (100% B); 14–15 min: linear gradient from 0% A (100% B) to 95% A (5% B). TR = 11.554 and 11.190 min. Molar conductance (μS cm−1, CH2Cl2): 39.54.
X-ray crystallography
Single crystal X-ray diffraction data was collected at 160.0(1) K on a Rigaku OD Synergy/Hypix diffractometer using the copper X-ray radiation (λ = 1.54184 Å) from a dual wavelength X-ray source and an Oxford Instruments Cryojet XL cooler. The selected suitable single crystal was mounted using polybutene oil on a flexible loop fixed on a goniometer head and immediately transferred to the diffractometer. Pre-experiment, data collection, data reduction and analytical absorption correction66 were performed with the program suite CrysAlisPro.67 Using Olex2,68 the structure was solved with the SHELXT69 small molecule structure solution program and refined with the SHELXL2018/3 program package70 by full-matrix least-squares minimization on F2. PLATON71 was used to check the result of the X-ray analysis. Supplementary crystallographic data for this paper have been deposited at the Cambridge Crystallographic Data Center, under the deposition numbers CCDC-2341519† (2).![[thin space (1/6-em)]](https://www.rsc.org/images/entities/char_2009.gif) Po/w) were determined using the shake-flask method. A total of 1 mg of each complex was solubilized in 1000 μL of DMSO and an aliquote of 50 μL was added to a mixture of equal volume of PBS (975 μL) and n-octanol (975 μL). The solutions were continuously shaken for 24 h at 1000 rpm and at 37 °C. Then, the samples were centrifuged for 5 min at 1000 rpm, and the organic and aqueous phases were separated. The organic phase was measured spectrophotometrically and the concentration was determined from a calibration curve (a linear regression) in order to obtain log
Po/w) were determined using the shake-flask method. A total of 1 mg of each complex was solubilized in 1000 μL of DMSO and an aliquote of 50 μL was added to a mixture of equal volume of PBS (975 μL) and n-octanol (975 μL). The solutions were continuously shaken for 24 h at 1000 rpm and at 37 °C. Then, the samples were centrifuged for 5 min at 1000 rpm, and the organic and aqueous phases were separated. The organic phase was measured spectrophotometrically and the concentration was determined from a calibration curve (a linear regression) in order to obtain log![[thin space (1/6-em)]](https://www.rsc.org/images/entities/char_2009.gif) P values = [complex(n-octanol)]/[complex(PBS)]. The experiments were carried out in triplicate.
P values = [complex(n-octanol)]/[complex(PBS)]. The experiments were carried out in triplicate.
| F0/F = 1 + kqτ0[Q] = 1 + KSV[Q] | (1) |
log[(F0 − F)/F] = log![[thin space (1/6-em)]](https://www.rsc.org/images/entities/char_2009.gif) Kb + n Kb + n![[thin space (1/6-em)]](https://www.rsc.org/images/entities/char_2009.gif) log[Q] log[Q] | (2) |
The thermodynamic parameters were derived from eqn (3) and (4):
| ln(Kb2/Kb1) = (1/T1 − 1/T2) × ΔH/R | (3) |
ΔG° = −RT![[thin space (1/6-em)]](https://www.rsc.org/images/entities/char_2009.gif) ln ln![[thin space (1/6-em)]](https://www.rsc.org/images/entities/char_2009.gif) Kb = ΔH° − TΔS° Kb = ΔH° − TΔS° | (4) |
Abbreviations
| ADME | Absorption, distribution, metabolism & elimination |
| ATP | Adenosine triphosphate |
| CV | Cyclic voltammetry |
| DCM | Dichloromethane |
| DLS | Dynamic light scattering |
| DMEM | Dulbecco's modified Eagle's medium |
| FBS | Fetal bovine serum |
| HLM | Human liver microsomes |
| MTT | 3-(4,5-Dimethylthiazol-2-yl)-2,5-diphenyltetrazolium bromide |
| NADPH | Nicotinamide adenine dinucleotide phosphate |
| PBS | Phosphate buffer saline |
| PDI | Polydispersity index |
| PK | Pharmacokinetic |
| RPMI | Roswell Park Memorial Institute 1640 medium |
| SI | Selectivity index |
| TBAP | Tetrabutylammonium phosphate |
Data availability
Supplementary data to this article can be found online at https://doi.org/DOI.Author contributions
Marcos V. Palmeira-Mello: investigation, methodology, validation, data curation and, writing – original draft. Analu R. Costa: investigation. Leticia P. de Oliveira: investigation. Olivier Blacque: investigation, resources and validation. Gilles Gasser: conceptualization, funding acquisition, supervision and writing – review & editing. Alzir A. Batista: conceptualization, funding acquisition, supervision and writing – review & editing.Conflicts of interest
There are no conflicts to declare.Acknowledgements
We thank FAPESP (process 2023/02475-8) and CNPq for financial support. M. V. P.-M. thanks the São Paulo State Research Support Foundation (FAPESP, processes 2021/01787-0 and 2022/09971-8). This work was financially supported by an ERC Consolidator Grant PhotoMedMet to G. G. (GA 681679) and has received support under the program “Investissements d'Avenir” launched by the French Government and implemented by the ANR with the reference ANR-10-IDEX-0001-02 PSL (G. G.).References
- D. Hanahan and R. A. Weinberg, Cell, 2000, 100, 57–70, DOI:10.1016/s0092-8674(00)81683-9.
- D. Hanahan and R. A. Weinberg, Cell, 2011, 144(4), 646–674, DOI:10.1016/j.cell.2011.02.013.
- IARC, International Agency for Research on Cancer, https://gco.iarc.fr/today/data/factsheets/cancers/20-Breast-fact-sheet.pdf, accessed on January, 2024.
- WHO, World Health Organization, https://www.who.int/news-room/fact-sheets/detail/breast-cancer, accessed on January, 2024.
- B. Rosenberg, L. VanCamp, J. Trosko and V. H. Mansour, Nature, 1969, 222, 385–386, DOI:10.1038/222385a0.
- E. Ortega, C. Pérez-Arnaiz, V. Rodríguez, C. Janiak, N. Busto, B. García and J. Ruiz, Eur. J. Med. Chem., 2021, 222, 113600, DOI:10.1016/j.ejmech.2021.113600.
- V. Censi, A. B. Caballero, M. Pérez-Hernández, V. Soto-Cerrato, L. Korrodi-Gregório, R. Pérez-Tomás, M. M. Dell'Anna, P. Mastrorilli and P. Gamez, J. Inorg. Biochem., 2019, 198, 110749, DOI:10.1016/j.jinorgbio.2019.110749.
- S. Dasari and P. B. Tchounwou, Eur. J. Pharmacol., 2014, 740, 364–378, DOI:10.1016/j.ejphar.2014.07.025.
- J. Zhou, Y. Kang, L. Chen, H. Wang, J. Liu, S. Zeng and L. Yu, Front. Pharmacol., 2020, 11, 343, DOI:10.3389/fphar.2020.00343.
- R. Paprocka, M. Wiese-Szadkowska, S. Janciauskiene, T. Kosmalski, M. Kulik and A. Helmin-Basa, Coord. Chem. Rev., 2022, 452, 214307, DOI:10.1016/j.ccr.2021.214307.
- N. Muhammad and Z. Guo, Curr. Opin. Chem. Biol., 2014, 19, 144–153, DOI:10.1016/j.cbpa.2014.02.003.
- E. Ortega, G. Vigueras, F. J. Ballester and J. Ruiz, Coord. Chem. Rev., 2021, 446, 214129, DOI:10.1016/j.ccr.2021.214129.
- M. V. P. Mello, G. Cebrian-Torrejon, J. R. Pereira, C. S. Moreira, C. B. S. M. R. Gomes, D. R. Rocha, E. M. S. Fagundes, G. B. Ferreira and M. Lanznaster, J. Inorg. Biochem., 2019, 199, 110756, DOI:10.1016/j.jinorgbio.2019.110756.
- G. Golbaghi, I. Pitard, M. Lucas, M. M. Haghdoost, Y. L. de los Santos, N. Doucet, S. A. Patten, J. T. Sanderson and A. Castonguay, Eur. J. Med. Chem., 2020, 188, 112030, DOI:10.1016/j.ejmech.2019.112030.
- M. M. Haghdoost, J. Guard, G. Golbaghi and A. Castonguay, Inorg. Chem., 2018, 57, 7558–7567, DOI:10.1021/acs.inorgchem.8b00346.
- J. Kasparkova, A. Hernández-García, H. Kostrhunova, M. Goicuría, V. Novohradsky, D. Bautista, L. Markova, M. D. Santana, V. Brabec and J. Ruiz, J. Med. Chem., 2024, 67, 691–708, DOI:10.1021/acs.jmedchem.3c01978.
- A. Marco, P. Ashoo, S. Hernández-García, P. Martínez-Rodríguez, N. Cutillas, A. Vollrath, D. Jordan, C. Janiak, F. Gandía-Herrero and J. Ruiz, J. Med. Chem., 2024, 67, 7891–7910, DOI:10.1021/acs.jmedchem.3c01869.
- J. Grau, A. Caubet, O. Roubeau, D. Montpeyó, J. Lorenzo and P. Gamez, ChemBioChem, 2020, 17, 2348–2355, DOI:10.1002/cbic.202000154.
- A. Notaro, M. Jakubaszek, N. Rotthowe, F. Maschietto, R. Vinck, P. S. Felder, B. Goud, M. Tharaud, I. Ciofini, F. Bedioui, R. F. Winter and G. Gasser, J. Am. Chem. Soc., 2020, 142, 6066–6084, DOI:10.1021/jacs.9b12464.
- S. Y. Lee, C. Y. Kim and T.-G. Nam, Drug Des., Dev. Ther., 2020, 14, 5375–5392, DOI:10.2147/DDDT.S275007.
- K. J. Franz and N. Metzler-Nolte, Chem. Rev., 2019, 119, 727–729, DOI:10.1021/acs.chemrev.8b00685.
- E. Boros, P. J. Dyson and G. Gasser, Chem, 2020, 6, 41–60, DOI:10.1016/j.chempr.2019.10.013.
- G. Golbaghi and A. Castonguay, Molecules, 2020, 25, 265, DOI:10.3390/molecules25020265.
- A. Notaro and G. Gasser, Chem. Soc. Rev., 2017, 46, 7317, 10.1039/c7cs00356k.
- C. G. Hartinger, M. A. Jakupec, S. Zorbas-Seifried, M. Groessl, A. Egger, W. Berger, H. Zorbas, P. J. Dyson and B. K. Keppler, Chem. Biodiversity, 2008, 5, 2140–2155, DOI:10.1002/cbdv.200890195.
- R. Trondl, P. Heffeter, C. R. Kowol, M. A. Jakupec, W. Berger and B. K. Keppler, Chem. Sci., 2014, 5, 2925–2932, 10.1039/C3SC53243G.
- E. Alessio, G. Mestroni, A. Bergamo and G. Sava, Curr. Top. Med. Chem., 2004, 4, 1525–1535, DOI:10.2174/1568026043387421.
- F. J. Ballester, A. Hernández-García, M. D. Santana, D. Bautista, P. Ashoo, E. Ortega-Forte, G. Barone and J. Ruiz, Inorg. Chem., 2024, 63(14), 6202–6216, DOI:10.1021/acs.inorgchem.3c04432.
- F. J. Ballester, E. Ortega, D. Bautista, M. D. Santana and J. Ruiz, Chem. Commun., 2020, 56, 10301, 10.1039/d0cc02417a.
- E. Ortega-Forte, A. Rovira, M. López-Corrales, A. Hernández-García, F. J. Ballester, E. Izquierdo-García, M. Jordà-Redondo, M. Bosch, S. Nonell, M. D. Santana, J. Ruiz, V. Marchán and G. Gasser, Chem. Sci., 2023, 14, 7170, 10.1039/d3sc01844j.
- A.-C. Munteanu, A. Notaro, M. Jakubaszek, J. Cowell, M. Tharaud, B. Goud, V. Uivarosi and G. Gasser, Inorg. Chem., 2020, 59, 4424–4434, DOI:10.1021/acs.inorgchem.9b03562.
- S. J. Steinke, S. Gupta, E. J. Piechota, C. E. Moore, J. J. Kodanko and C. Turro, Chem. Sci., 2022, 13, 1933–1945, 10.1039/d1sc05647f.
- A. P. Lanquist, S. Gupta, K. F. Al-Afyouni, M. Al-Afyouni, J. J. Kodanko and C. Turro, Chem. Sci., 2021, 12, 12056–12067, 10.1039/d1sc03213e.
- R. J. Mitchell, A. S. Gowda, A. G. Olivelli, A. J. Huckaba, S. Parkin, J. M. Unrine, V. Oza, J. S. Blackburn, F. Ladipo, D. K. Heidary and E. C. Glazer, Inorg. Chem., 2023, 62, 10940–10954, DOI:10.1021/acs.inorgchem.3c00736.
- G. F. Grawe, K. M. Oliveira, C. M. Leite, T. D. de Oliveira, A. R. Costa, C. A. F. Moraes, J. Honorato, M. R. Cominetti, E. E. Castellano, R. S. Correa, S. P. Machado and A. A. Batista, J. Inorg. Biochem., 2023, 244, 112204, DOI:10.1016/j.jinorgbio.2023.112204.
- G. F. Grawe, K. M. Oliveira, C. M. Leite, T. D. de Oliveira, J. Honorato, A. G. Ferreira, E. Castellano, M. R. Cominetti, R. S. Correa and A. A. Batista, Dalton Trans., 2022, 51, 1489–1501, 10.1039/D1DT02851K.
- A. Saha, I. Mondal, A. Kumari, A. K. Sonkar, R. Mishra, R. Kulshreshtha and A. K. Patra, Dalton Trans., 2024, 53, 1551–1567, 10.1039/D3DT02941G.
- L. Rafols, D. Josa, D. Aguilà, L. A. Barrios, O. Roubeau, J. Cirera, V. Soto-Cerrato, R. Pérez-Tomás, M. Martínez, A. Grabulosa and P. Gamez, Inorg. Chem., 2021, 60, 7974–7990, DOI:10.1021/acs.inorgchem.1c00507.
- M. M. da Silva, M. S. de Camargo, S. Castelli, R. A. de Grandis, E. E. Castellano, V. M. Deflon, M. R. Cominetti, A. Desideri and A. A. Batista, J. Braz. Chem. Soc., 2020, 31(3), 536–549, DOI:10.21577/0103-5053.20190214.
- G. H. Ribeiro, A. P. M. Guedes, T. D. de Oliveira, C. R. S. T. B. de Correia, L. Colina-Vegas, M. A. Lima, J. A. Nóbrega, M. R. Cominetti, F. V. Rocha, A. G. Ferreira, E. E. Castellano, F. R. Teixeira and A. A. Batista, Inorg. Chem., 2020, 59, 15004–15018, DOI:10.1021/acs.inorgchem.0c01835.
- M. M. da Silva, G. H. Ribeiro, M. S. de Camargo, A. G. Ferreira, L. Ribeiro, M. I. F. Barbosa, V. M. Deflon, S. Castelli, A. Desideri, R. S. Corrêa, A. B. Ribeiro, H. D. Nicolella, S. D. Ozelin, D. C. Tavares and A. A. Batista, Inorg. Chem., 2021, 60, 14174–14189, DOI:10.1021/acs.inorgchem.1c01539.
- A. Notaro, A. Frei, R. Rubbiani, M. Jakubaszek, U. Basu, S. Koch, C. Mari, M. Dotou, O. Blacque, J. Gouyon, F. Bedioui, N. Rotthowe, R. F. Winter, B. Goud, S. Ferrari, M. Tharaud, M. Řezáčová, J. Humajová, P. Tomšík and G. Gasser, J. Med. Chem., 2020, 63, 5568–5584, DOI:10.1021/acs.jmedchem.0c00431.
- K. Słoczyńska, A. Gunia-Krzyżak, P. Koczurkiewicz, K. Wójcik-Pszczoła, D. Żelaszczyk, J. Popiół and E. Pękala, Acta Pharm., 2019, 69, 345–361, DOI:10.2478/acph-2019-0024.
- E. Ortega-Forte, S. Hernández-García, G. Vigueras, P. Henarejos-Escudero, N. Cutillas, J. Ruiz and F. Gandía-Herrero, Cell. Mol. Life Sci., 2022, 79, 510, DOI:10.1007/s00018-022-04526-5.
- K. M. Oliveira, E. J. Peterson, M. C. Carroccia, M. R. Cominetti, V. M. Deflon, N. P. Farrell, A. A. Batista and R. S. Correa, Dalton Trans., 2020, 49, 16193, 10.1039/d0dt01091j.
- M. M. da Silva, M. S. de Camargo, R. S. Correa, S. Castelli, R. A. De Grandis, J. E. Takarada, E. A. Varanda, E. E. Castellano, V. M. Deflon, M. R. Cominetti, A. Desideri and A. A. Batista, Dalton Trans., 2019, 48, 14885, 10.1039/c9dt01905g.
- W. J. Geary, Coord. Chem. Rev., 1971, 7, 81–122, DOI:10.1016/S0010-8545(00)80009-0.
- V. D. S. Velozo-Sá, L. R. Pereira, A. P. D. Lima, F. Mello-Andrade, M. D. R. M. Rezende, R. M. Goveia, W. C. Pires, M. M. Silva, K. Oliveira, A. G. Ferreira, J. A. Ellena, V. M. Deflon, C. Grisolia, A. A. Batista and E. D. P. Silveira-Lacerda, Dalton Trans., 2019, 48, 6026–6039, 10.1039/C8DT03738H.
- M. V. Palmeira-Mello, A. B. Caballero, J. M. Ribeiro, E. M. Souza-Fagundes, P. Gamez and M. Lanznaster, J. Inorg. Biochem., 2020, 211, 111211, DOI:10.1016/j.jinorgbio.2020.111211.
- P. Zhang and P. J. Sadler, Eur. J. Inorg. Chem., 2017, 12, 1541–1548, DOI:10.1002/ejic.201600908.
- E. Baka, J. E. A. Comer and K. Takács-Novák, J. Pharm. Biomed. Anal., 2008, 46, 335–341, DOI:10.1016/j.jpba.2007.10.030.
- R. Vinck, A. Gandioso, P. Burckel, B. Saubamea, K. Cariou and G. Gasser, Inorg. Chem., 2022, 61, 13576–13585, DOI:10.1021/acs.inorgchem.2c02214.
- K. M. Knights, D. M. Stresser, J. O. Miners and C. L. Crespi, Curr. Protoc. Pharmacol., 2016, 74, 781, DOI:10.1002/cpph.9.
- M. Patra, K. Ingram, A. Leonidova, V. Pierroz, S. Ferrari, M. N. Robertson, M. H. Todd, J. Keiser and G. Gasser, J. Med. Chem., 2013, 56(22), 9192–9198, DOI:10.1021/jm401287m.
- A. Zamora, C. A. Denning, D. K. Heidary, E. Wachter, L. A. Nease, J. Ruiz and E. C. Glazer, Dalton Trans., 2017, 46, 2165, 10.1039/c6dt04405k.
- M. P. Felicissimo, A. A. Batista, A. G. Ferreira, J. Ellena and E. E. Castellano, Polyhedron, 2005, 24, 1063–1070, DOI:10.1016/j.poly.2005.02.026.
- A. Gallen, A. Riera, X. Verdaguer and A. Grabulosa, Catal. Sci. Technol., 2019, 9, 5504, 10.1039/c9cy01501a.
- I. Maximiano, C. Henriques, R. G. Teixeira, F. Marques, A. Valente and A. M. M. Antunes, J. Inorg. Biochem., 2024, 251, 112436, DOI:10.1016/j.jinorgbio.2023.112436.
- J. Shi, L. Xie, W. Gong, H. Bai, W. Wang, A. Wang, W. Cao, H. Tong and H. Wang, Metallomics, 2024, 16, mfae005, DOI:10.1093/mtomcs/mfae005.
- R. S. Correa, L. M. Bomfim, K. M. Oliveira, D. R. M. Moreira, M. B. P. Soares, J. Ellena, D. P. Bezerra and A. A. Batista, J. Inorg. Biochem., 2019, 198, 110751, DOI:10.1016/j.jinorgbio.2019.110751.
- K. M. Oliveira, J. Honorato, G. R. Gonçalves, M. R. Cominetti, A. A. Batista and R. S. Correa, Dalton Trans., 2020, 49(36), 1264312652, 10.1039/D0DT01591A.
- T. Lemma and J. Pawliszyn, J. Pharm. Biomed. Anal., 2009, 50, 570–575, DOI:10.1016/j.jpba.2008.10.028.
- S. A. Eccles and D. R. Welch, Lancet, 2007, 369, 1742–1757, DOI:10.1016/S0140-6736(07)60781-8.
- J. Fares, M. Y. Fares, H. H. Khachfe, H. A. Salhab and Y. Fares, Signal Transduction Targeted Ther., 2020, 5, 28, DOI:10.1038/s41392-020-0134-x.
- N. A. P. Franken, H. M. Rodermond, J. Stap, J. Haveman and C. van Bree, Nat. Protoc., 2006, 1, 2315–2319, DOI:10.1038/nprot.2006.339.
- R. C. Clark and J. S. Reid, Acta Crystallogr., Sect. A: Found. Crystallogr., 1995, 51, 887, DOI:10.1107/S0108767395007367.
- CrysAlisPro (version 1.171.42.75a), Rigaku Oxford Diffraction Ltd, Yarnton, Oxfordshire, England, 2022 Search PubMed.
- O. V. Dolomanov, L. J. Bourhis, R. J. Gildea, J. A. K. Howard and H. Puschmann, J. Appl. Crystallogr., 2009, 42, 339, DOI:10.1107/S0021889808042726.
- G. M. Sheldrick, Acta Crystallogr., Sect. A: Found. Adv., 2015, 71, 3–8, DOI:10.1107/S2053273314026370.
- G. M. Sheldrick, Acta Crystallogr., Sect. C: Struct. Chem., 2015, 71, 3–8, DOI:10.1107/S2053229614024218.
- A. L. Spek, Acta Crystallogr., Sect. D: Biol. Crystallogr., 2009, 65, 148, DOI:10.1107/S090744490804362X.
- S. Keller, Y. C. Ong, Y. Lin, K. Cariou and G. Gasser, J. Organomet. Chem., 2020, 906, 121059, DOI:10.1016/j.jorganchem.2019.121059.
- T. Mosmann, J. Immunol. Methods, 1983, 65, 55–63, DOI:10.1016/0022-1759(83)90303-4.
Footnote |
| † Electronic supplementary information (ESI) available. CCDC 2341519. For ESI and crystallographic data in CIF or other electronic format see DOI: https://doi.org/10.1039/d4dt01191k |
| This journal is © The Royal Society of Chemistry 2024 |

