
Near-infrared absorption and radiative cooling of naphthalene dimers (C10H8)2
Jérôme
Bernard
 *a,
Serge
Martin
a,
Abdulaziz
Al-Mogeeth
a,
Christine
Joblin
b,
MingChao
Ji
c,
Henning
Zettergren
c,
Henrik
Cederquist
c,
Mark H.
Stockett
c,
Suvasthika
Indrajith
ac,
Léo
Dontot
e,
Fernand
Spiegelman
d,
Dominique
Toublanc
f and
Mathias
Rapacioli
d
*a,
Serge
Martin
a,
Abdulaziz
Al-Mogeeth
a,
Christine
Joblin
b,
MingChao
Ji
c,
Henning
Zettergren
c,
Henrik
Cederquist
c,
Mark H.
Stockett
c,
Suvasthika
Indrajith
ac,
Léo
Dontot
e,
Fernand
Spiegelman
d,
Dominique
Toublanc
f and
Mathias
Rapacioli
d
aInstitut Lumière Matière (iLM), UMR5306 Université Lyon 1-CNRS, Université de Lyon, 69622 Villeurbanne, France. E-mail: jerome.bernard@univ-lyon1.fr
bInstitut de Recherche en Astrophysique et Planétologie (IRAP), UMR5277, Université Toulouse III – Paul Sabatier, CNRS, CNES, 9 Av. du Colonel Roche, 31028 Toulouse Cedex 4, France
cDepartment of Physics, Stockholm University, Roslagstullsbacken 21, SE-106 91, Stockholm, Sweden
dLaboratoire de Chimie et Physique Quantiques (LCPQ)/Institut FeRMI, UMR5626, Université Toulouse III – Paul Sabatier and CNRS, 118 Route de Narbonne, F-31062 Toulouse, France
eCIMAP, Unité Mixte CEA-CNRS-ENSICAEN-UCBN 6252, BP 5133, F-14070 Caen, Cedex 05, France
fLaboratoire Collisions Agrégats Réactivité (LCAR)/Institut FeRMI, UMR5589, Université Toulouse III – Paul Sabatier and CNRS, 118 Route de Narbonne, F-31062 Toulouse, France
First published on 24th June 2024
Abstract
The radiative cooling of naphthalene dimer cations, (C10H8)2+ was studied experimentally through action spectroscopy using two different electrostatic ion-beam storage rings, DESIREE in Stockholm and Mini-Ring in Lyon. The spectral characteristics of the charge resonance (CR) band were observed to vary significantly with a storage time of up to 30 seconds in DESIREE. In particular, the position of the CR band shifts to the blue, with specific times (inverse of rates) of 0.64 s and 8.0 s in the 0–5 s and 5–30 s storage time ranges, respectively. These long-time scales indicate that the internal energy distribution of the stored ions evolves by vibrational radiative cooling, which is consistent with the absence of fast radiative cooling via recurrent fluorescence for (C10H8)2+. Density functional based tight binding calculations with local excitations and configuration interactions (DFTB-EXCI) were used to simulate the absorption spectrum for ion temperatures between 10 and 500 K. The evolution of the bandwidth and position with temperature is in qualitative agreement with the experimental findings. Furthermore, these calculations yielded linear temperature dependencies for both the shift and the broadening. Combining the relationship between the CR band position and the ion temperature with the results of the statistical model, we demonstrate that the observed blue shift can be used to determine the radiative cooling rate of (C10H8)2+.
1 Introduction
Spectroscopic investigations of the interstellar medium (ISM) in the mid-infrared range (MIR) have revealed the presence of polycyclic aromatic hydrocarbons (PAHs), which are abundant and widespread molecules playing crucial roles in the physics and chemistry of numerous astrophysical environments.1,2 The MIR bands attributed to PAHs, the so-called aromatic infrared bands (AIBs), are seen in emission spectra following excitation by UV photons. This leads to selection effects on the species that can survive, in general assumed to be large PAHs containing more than 50 carbon atoms.3 On the other hand, small cyclic molecules, namely, cyclopentadiene (C5H6) and indene (C9H8),4,5 as well as cyano-naphthalene (C10H7CN, belonging to the nitrogen-substituted PANH family)6 have been identified in the TMC-1 dark cloud, in regions shielded from UV irradiation. Small PAHs are also major constituents of meteorites (carbonaceous chondrites).7,8Several studies have suggested the presence of PAH clusters, either to account for specific signatures in the infrared9,10 or as precursors for free PAHs in UV-irradiated environments.11,12 Ionized dimers of PAHs have also been shown to be attractive candidates to carry the extended red emission in photodissociation regions.13 PAH clusters have larger heat capacities and lower ionization energies than isolated PAH molecules14 and ionized clusters are predicted to be more stable than the corresponding neutral clusters.15 This could make them attractive candidates for survival in specific astrophysical environments.
Similarly to PAHs, the survival of PAH clusters in astrophysical environments is governed by the competition between dissociation and radiative cooling.16 Radiative cooling of several PAHs has been shown to consist of two regimes, a faster one attributed to recurrent fluorescence17–21 and a slower one associated with IR emission. Recently, Stockett et al. reported on fast cooling through recurrent fluorescence of cyanonaphthalene,22 which could contribute to explaining its unexpectedly high abundance in the Taurus molecular cloud, TMC-1.6 PAH clusters contain both intramolecular and intermolecular modes and the way the energy is partitioned between them is critical for the dissociation of these species.23 The competition between dissociation and radiative cooling for ionized PAH dimers has been the subject of previous experiments at ms timescales using the Mini-Ring electrostatic ring.24,25 No quenching was observed in the spontaneous dissociation decays or in the laser-induced delayed dissociation. Therefore, no significant radiative cooling could be evidenced in the ms timescale, indicating that recurrent fluorescence is not an efficient radiative cooling process for these dimers. Furthermore, a recent investigation of the dissociation of small pyrene clusters following ionization and excitation by VUV synchrotron radiation revealed a significant deviation from conventional statistical models. Theoretical investigation showed that this deviation may be explained by the potential energy surface topology of the excited states.26
In the present study, our aim is to investigate the radiative cooling of naphthalene dimer cations, (C10H8)2+ denoted hereafter as (Np)2+, on long timescales up to 30 s by recording the evolution of the action electronic spectrum with time as was first performed on C24H12+.27 Cationic dimers exhibit several absorption features as illustrated in Fig. 1. The charge resonance (CR) pattern stems from the interaction between resonant (equivalent) configurations, here NpNp+/Np+Np, coupled by the charge transfer interaction resulting in an energy splitting Δ0 of the states at compact (equilibrium) geometry, together with a global energy lowering due to polarization and dispersion interactions. Note that this kind of resonance pattern can also exist in the case of dimer states correlated with excited states of the monomer cation (local excited states labelled LE).
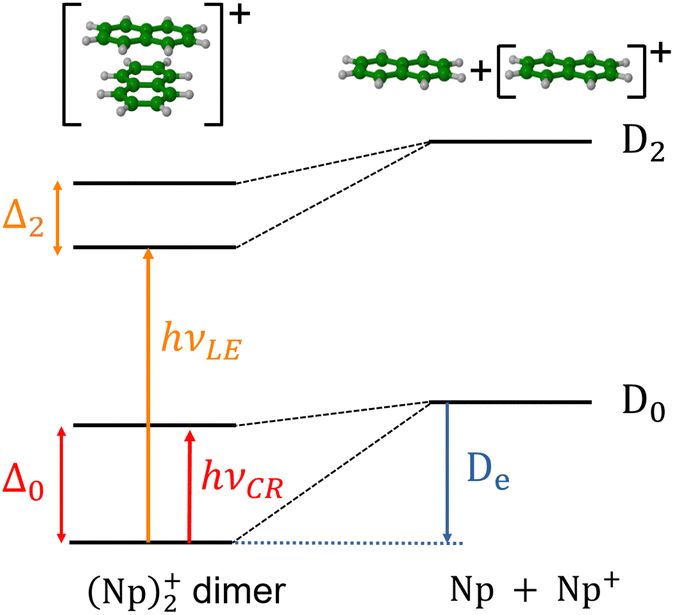 | ||
| Fig. 1 Schematic diagram for first charge resonance (CR) and local excitation (LE) absorption patterns in the naphthalene dimer cation. Δ0 and Δ2 indicate the splitting induced by charge resonance between states dissociating into Np + Np+(D0) or Np + Np+(D2), respectively. D0 and D2 are the ground state and the lowest dipole allowed excited state of the Np monomer. (Np)2+ states correlated with the dipole forbidden state D1 are not shown here. De is the ground state dissociation energy. | ||
The measurements were performed using the cryogenic Double ElectroStatic Ion Ring ExpEriment (DESIREE) facility28,29 in Stockholm and the room-temperature Mini-Ring30 in Lyon.24 In DESIREE, we recorded the action spectrum of (Np)2+ in the range of the CR band to study the evolution of the band position and width with storage time. We also compared the recorded band profile with previous measurements31 and performed additional experiments with Mini-Ring under different ion source conditions, which led to lower internal energies of the (Np)2+ ions injected in Mini-Ring in comparison to those injected in DESIREE.
The evolution of the CR band position with storage time was analyzed by performing simulations of the electronic absorption spectra at different temperatures using the density functional based tight binding scheme (DFTB) in combination with valence bond configuration interaction including local excitations (DFTB-EXCI).15,32 This allowed us to derive a relationship between the position of the CR band and the vibrational temperature of (Np)2+. Combining these results with the measured shift in the CR band position with time should therefore provide information on the radiative cooling rate. We have used a statistical model to describe the IR cooling of (Np)2+ and shown that the time evolution of the CR band position can indeed be used to trace the infrared (vibrational) cooling of (Np)2+ as a function of time.
2 Experimental methods
Since both DESIREE28,29 and Mini-Ring30 facilities have been extensively documented in previous publications, we only provide here brief overviews of the procedures used in the present experiments.2.1 DESIREE
In DESIREE, two ion-beam storage rings sharing a common straight section, are housed in an ultra-high vacuum chamber cooled to 13 K. The cryogenic temperature and the extremely low density of residual gas in DESIREE allow for very long storage times up to several tens of minutes33 and beyond. This enables studies on very slow molecular processes under conditions that are directly relevant to certain regions of the ISM. In the present experiment, only one of the two rings was used. We stored (Np)2+ in the 'asymmetric ring' of DESIREE (the label 'asymmetric' refers to the asymmetric placements of quadrople lenses shown in dark blue in Fig. 2) since only this ring is equipped with a charged-fragment detector (FD in Fig. 2). As a compromise between the conflicting needs for a long storage time and sufficient counting statistics, we chose to store dimer naphthalene cation beams for 30 seconds.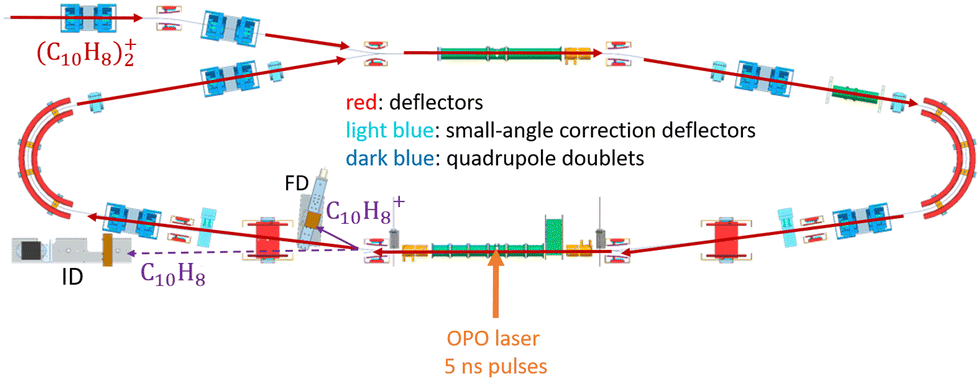 | ||
| Fig. 2 Schematic of the cryogenic asymmetric ring of DESIREE. Red arrows show the main path of the parent (C10H8)2+ dimer cations stored in DESIREE. The orange arrow symbolizes the perpendicular crossing of the laser beam with the stored ions. The neutral and charged fragments resulting from laser dissociation are detected by the imaging detector (ID) and the fragment detector (FD), respectively. Spontaneous dissociation of internally hot (C10H8)2+ dimer cations occurring in this straight section also contributes to events recorded by those detectors. | ||
We used the method described in ref. 24 to produce (Np)2+ ion beams with an ECR plasma ion source (Pantechnik Monogan 100). We introduced sublimated naphthalene powder (purchased from Sigma-Aldrich with >99% purity and used as received) into the source without the use of any carrier gas. Although the vapor pressure could not be precisely determined, it was maintained high enough to keep the plasma cold. The power of the 2.45 GHz microwave was set nearly to its minimum value (about 1 W) to ensure a stable ECR-plasma for several hours.
In Fig. 3, we show a typical mass spectrum obtained by scanning the beam-separation magnet in the DESIREE injection beam line while recording the beam current with a Faraday cup behind the exit aperture of the magnet. The dominant peak in this mass spectrum is attributed to intact (Np)2+ (m/z 256.2). The peaks at m/z 257.2 and 258.2 are due to the natural abundance of the 13C isotope. The small peaks at m/z 255.2, 254.2, and 253.2 are attributed to fragments where one, two, or three hydrogen atoms are missing, respectively.
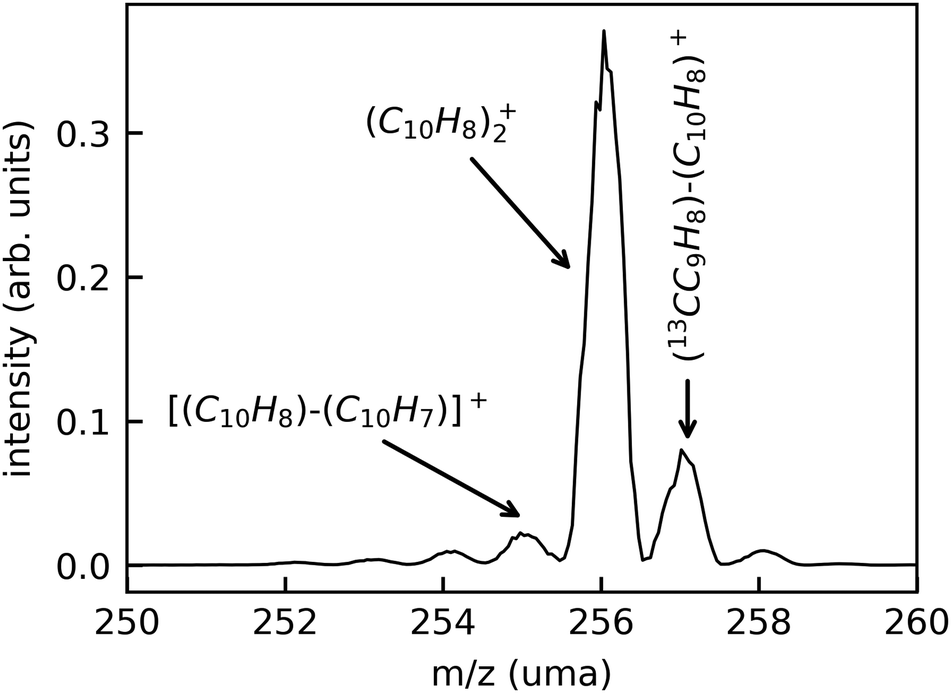 | ||
| Fig. 3 Typical mass spectrum recorded during (C10H8)2+ beam preparation in DESIREE. | ||
We injected mass-selected (Np)2+ ion bunches (m/z 256.2) into DESIREE's asymmetric ring at 20 keV kinetic energy. The bunch duration was adjusted to fill the ring almost completely. To perform action spectroscopy, the stored ions were irradiated with 5 ns long pulses from a 10 Hz repetition rate OPO laser (ESKPLA NT342C). The laser beam crossed the ion beam at an angle of 90 degrees in the straight section viewed by the FD and ID detectors as shown in Fig. 2. The laser wavelength was scanned over the 800–1600 nm range corresponding to the CR absorption band.31,34 As observed in previous investigations,31,34 photon absorption in the CR band range leads to dissociation of (Np)2+ into a naphthalene cation and a neutral naphthalene molecule. For each laser-induced dissociation event, the charged fragment, Np+, was deflected out of the stored beam path by twice the angle of the parent dimer cations in the direction of the FD. The undeflected neutral fragment, Np, was detected using the imaging detector (ID). We set up a coincidence time window to trace the correlated detection of a neutral and a charged fragment from the same dissociation event. The counts of charged fragments, neutral fragments, and coincidence events were accumulated over 1376 storage and measurement cycles. In Fig. 4a, we show the raw data counts as a function of storage time in the 0–1 second range. The continuously decreasing counts at short times (0–1 ms) are attributed to the spontaneous dissociation of internally hot (Np)2+ ions with total excitation energy exceeding the dissociation limit. The sharp peaks appearing every 100 ms are due to counts integrated over the scanned wavelength range, resulting from laser-induced dissociation.
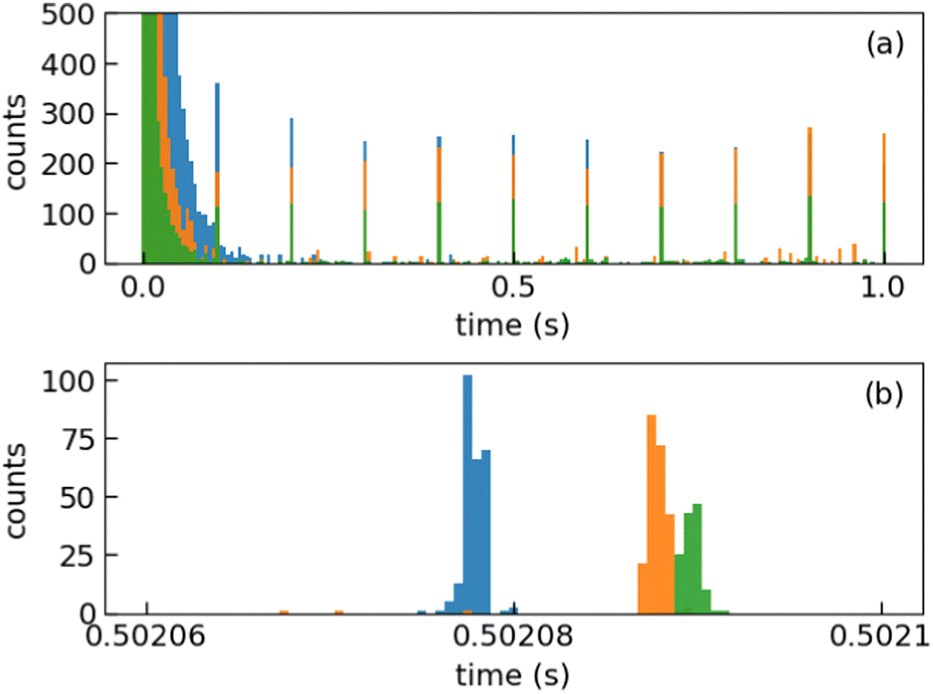 | ||
| Fig. 4 (a) Partial raw data accumulated during the experimental run (orange: neutral fragment counts; blue, barely visible behind the orange: charged fragment counts, green: coincidence counts). For clarity, the first second only of the 30 s total storage time is shown. In the 0–0.1 s time range, the counts are dominated by the spontaneous decay from internally hot (Np)2+. Sharp peaks every 0.1 s are due to prompt laser-induced dissociation. No delayed dissociation is observed after laser absorption. (b) Zoom in on the laser-induced peaks at 0.5 s using time bins of 0.5 μs (orange: neutral fragment counts; blue: charged fragment counts, and green: coincidence counts). The coincidence counts arrive slightly later than the corresponding neutral counts due to electronic delays. | ||
In Fig. 4b, we present a detailed view of the counts recorded after the 5th laser pulse at approximately 500 ms of storage time, showing the times for the detection of charged and neutral fragments, reflecting their different trajectory lengths between the crossing with the laser and the FD and ID detectors (see Fig. 2). The laser-induced counts on the FD and ID detectors and the coincidence counts (integrated over the entire storage time) have been used to determine the collection-detection efficiencies, resulting in εID = (55.3 ± 0.5)% for neutral fragments and εFD = (50.1 ± 0.4)% for charged fragments, respectively. The dimer ions, [(C10H8)–(C10H7)]+, with one H atom missing from one of the molecules, have been stored in DESIREE and Mini-Ring. They present significantly different behaviors compared to the intact (Np)2+ ions. Unlike the latter, the dimer ions missing one H atom do not photo-dissociate in the near-infrared range corresponding to the CR band. Moreover, they undergo delayed dissociation upon excitation in the visible range at wavelengths corresponding approximately to the LE band whereas (Np)2+ only undergo prompt dissociation in that case. These observations indicate that these [(C10H8)–(C10H7)]+ ions are more strongly bound than (Np)2+. At this stage, one might speculate that these molecules are covalently bound whereas the (Np)2+ ions are bound via charge resonance between the two monomers. We also suspect that the [(C10H8)–(C10H7)]+ ions are formed in the ion source by the association of a fragmented and an intact monomer. We note that similar findings were reported by Zhen et al.35 for the dehydrogenated pyrene dimer cation C32H19+.
2.2 Mini-Ring
Mini-Ring is a compact room-temperature electrostatic ion-beam storage ring consisting of only ten electrodes including four parallel-plate deflectors and two conical-shaped mirrors (Fig. 5). The injection beam-line is equipped with a NanoGan 1 ECR ion source (provided by Pantechnik SAS). Compared to previous work,31 we maintained a relatively high vapor pressure of naphthalene within the ion source by reducing the aperture of the extraction electrode to a diameter of 1 mm. We estimated the pressure to be in the 0.01 to 0.1 mbar range, which is close to the Np vapor pressure at room temperature. At these pressures, along with a typical 1 W power of the injected 10 GHz microwaves, beams of (Np)2+ were generated with significantly lower internal energy compared to the experiment reported in ref. 31. Since not much radiative cooling is expected in the Mini-Ring at room temperature, we stored the (Np)2+ beam for a rather short duration of 2 ms to obtain a higher repetition rate for the measurements. The (Np)2+ ions were irradiated once per storage cycle after a storage time of 1.8 ms, using 5 ns long laser pulses from an OPO laser (EKSPLA NT 220) operating at a repetition rate of 500 Hz. The laser beam crossed the ion beam perpendicularly at the midpoint of the straight section located between deflectors D3 and D4 (see Fig. 5). Neutral fragments resulting from prompt dissociation of the excited (Np)2+ ions were detected by a position-sensitive, microchannel-plates-based detector. A precise time window was set to exclusively count dissociation events that occurred within a 1 μs interval following the laser pulse in order to minimize background counts. The laser wavelength was scanned over the 740–2000 nm range, slightly broader than the one used at DESIREE, to record the action spectrum of the CR band. | ||
| Fig. 5 Schematic of the room-temperature Mini-Ring in Lyon. Red arrows show the main path of the stored (C10H8)2+ dimer cations. The green arrow symbolizes the perpendicular crossing of the laser beam with the stored ions. Note that due to well-controlled time matching between the ion bunch and the laser nanosecond pulses, the crossing only occurs between deflectors D3 and D4. The neutral fragments resulting from prompt laser dissociation are detected by the position-sensitive detector, PSD. | ||
3 Experimental results
In Fig. 6, the FD counts recorded at DESIREE are plotted in a 2D map as a function of the photon energy hν and the storage time, i.e., the time during which the ions are stored before the laser is fired. Action spectra were recorded for a large number of storage times with separations of 0.1 s. These spectra correspond to horizontal lines in Fig. 6. The CR band position, defined as the photon energy corresponding to the maximum intensity of the CR band, and the bandwidth were determined by Gaussian fits. The CR band was found to become narrower and to shift towards higher energies (shorter wavelengths) as a function of storage time. In order to determine an experimental characteristic shift time, the CR band position is plotted as a function of storage time in Fig. 7. It was attempted to fit the CR band position as a function of storage time in Fig. 7 using a single exponential function, but the resulting fit curve did then not agree with the data at short storage times (not shown in Fig. 7). However, this first attempt clearly suggested the presence of two exponential components. Therefore, we used a double exponential fit to characterize the time evolution of the CR band position, as defined in eqn (1),| hνc(t) = hν∞(1 − δ1 × e−t/τ1 − δ2 × e−t/τ2) | (1) |
 | ||
| Fig. 6 Action spectra of laser-induced naphthalene-dimer dissociation, (C10H8)2+ → C10H8+ + C10H8. The intensity, as a function of the storage time before the firing of the laser and the laser photon energy, is shown through the color scale shown to the right. The red line is an exponential fit of the CR band position determined at maximum intensity, showing the shift of the CR band position with storage time. | ||
 | ||
| Fig. 7 Black dots: centers of the CR band in the action spectra of (C10H8)2+ dimer cations recorded at different storage times in DESIREE. Red curve: fit with an expression including two exponential functions as defined in eqn (1). | ||
We attribute the shift and narrowing of the CR band with time to radiative cooling.
As will be shown in Section 4, unlike the PAH monomer cations (naphthalene, anthracene, tetracene, pentacene, etc.), and similarly to pyrene dimer cations,25 (Np)2+ do not have low-lying electronic excitations to mediate recurrent fluorescence processes efficiently. Therefore, when the internal energy is low enough to prevent dissociation processes, (Np)2+ may only cool by mid-IR vibrational emissions, or still slower through rotational transitions in the far-IR.
In Fig. 8, we compare the spectra recorded at DESIREE at short and long storage times (summed over the ranges 0–5 s in Fig. 8a and 20–30 s in Fig. 8b) with the spectrum recorded with Mini-Ring from ref. 24 (Fig. 8a), and a spectrum recently recorded with colder (Np)2+ ion source conditions (Fig. 8b), respectively. The (Np)2+ ions probed in Mini-Ring after only 1.8 ms had internal energies close to those they had in the ion source both with the hotter and the colder ions from the source. In Fig. 8a, we observe an overall agreement between the spectra recorded at short times at DESIREE and with the hotter source conditions from Mini-Ring. The high-pressure conditions needed to produce colder dimers in the source were only realized at the Mini-Ring set-up.
 | ||
| Fig. 8 (a) Action spectrum of the CR band recorded at DESIREE integrated over the storage time range of 0–5 s (blue squares) and at Mini-Ring for ‘hot’ ion source conditions (red dots) from ref. 24 (storage time of 1.8 ms). (b) Action spectrum of the CR band recorded at DESIREE integrated over the storage time range of 20–30 s (blue squares) and at Mini-Ring using ‘colder’ ion source conditions and a storage time of 1.8 ms (red dots). | ||
Although the “colder source condition” spectrum was recorded after 1.8 ms storage time only (much too short a time for efficient radiative cooling) and despite Mini-Ring being operated at room temperature (about 293 K), it is close to the spectrum recorded at DESIREE with orders of magnitude longer storage times (Fig. 8). Therefore, we may conclude that even in the cryogenic environment of DESIREE, the IR radiative cooling rate of (Np)2+ is much lower after about 10 seconds of storage and that reaching thermal equilibrium with the surroundings would take very much longer than 30 s. Inokuchi et al.34 produced internally very cold (Np)2+ by introducing naphthalene molecules into a supersonic Ar expansion within a region where a plasma was induced by a Nd:YAG pulsed laser irradiating a stainless steel disk. They recorded a much narrower spectrum compared to the ones displayed in Fig. 8. However, the CR band position of 1.05 eV reported Inokuchi et al.34 matches rather well with the ones of Fig. 8b, i.e. when the (Np)2+ had time to cool down in DESIREE or when they were produced under the ‘colder’ plasma conditions in Mini-Ring.
4 Simulation of the absorption spectra
The electronic structure of the naphthalene dimer cation was determined using the DFTB-EXCI framework,36 initially inspired by the DFT formulation of Wu and Van Vorhis,37 and found to be successful in several studies on PAH cluster cations,14,32,38 including the study of photodissociation of pyrene dimer cations.25 Briefly, the ground and excited states of the cluster are expressed as linear combinations of valence-bond type configurations | (2) |
| (HDFTB + λAPA)ϕAi = εiϕAi | (3) |
 | (4) |
The method provides potential energy surfaces for dimer cations displaying an overall agreement with higher level calculations of the ground and excited state potential energy curves, in particular concerning the long-distance limits of the dissociation channels. In a previous related study,36 the lowest energy arrangement of the two molecules was found to correspond to parallel molecular planes twisted around the perpendicular axis with an angle of 90 degrees, as shown in Fig. 9a. Nevertheless, deviations from reference CASPT2 calculations or experimental results were reported in ref. 36, when using the DFTB-EXCI model with mat-sci Slater Koster parameters,36 CM3 charges42 and dispersion corrections. The first difference concerns the energies of the lowest electronically excited states of the naphthalene monomer cation namely 0.90 eV and 1.65 eV with DFTB vs. 0.77 and 1.90 eV with the CASPT2 calculations. Those positions determine not only the precise positions of the dissociative channels but also the locations of the state crossings in the dimer. The second error affects the intra-monomer cation dipole transition moment and the oscillator strength towards the second electronic state, which is strongly overestimated in the DFTB calculation at 0.237, while the CASPT2 calculation gives 0.052. The third point concerns the inter-monomer distance: the DFTB minimum-energy distance along the dissociation path for two superimposed parallel naphthalene monomers was significantly shorter than the one obtained from the CASPT2 reference, namely 3.06 Å compared to 3.21 Å, and the stabilization energy was underestimated, 0.90 eV vs. 1.265 eV from CASPT2. The precise location of the equilibrium distance is particularly important because excited state crossings between the repulsive CR state and attractive LE states do occur around that distance and the inner slope of the excited states becomes steep, significantly affecting the transitions from the ground state. Since the Hamiltonian is expressed in a local picture, the two first errors were easy to correct (i) by shifting the diagonal elements of the Hamiltonian 〈ΦAh|H|ΦAk〉 with k < h corresponding to LE asymptotes by −0.0048487 Hartree for the lowest one (non-allowed) and 0.0091274 Hartree for the second one and (ii) multiplying the corresponding value of the allowed LE intra-monomer contribution to the dipole transition moment 〈ΦAh|D|ΦAh−2〉 by a correcting factor of 0.235297. Since the Hamiltonian is expressed in a diabatic-like picture, the above corrections should be transferable, whatever the dimer geometry. The third correction consists of adding atom–atom inter-monomer additive corrections so that the energy along the above-mentioned dissociation path matches the CASPT2 reference. The ad-hoc pair potential correction ΔV(Rab) was taken as a unique Morse expression for all types of atoms a ∈ A and b ∈ B:
| ΔV(Rab) = v(1 − exp(−b(Rab − c)))2 − v | (5) |
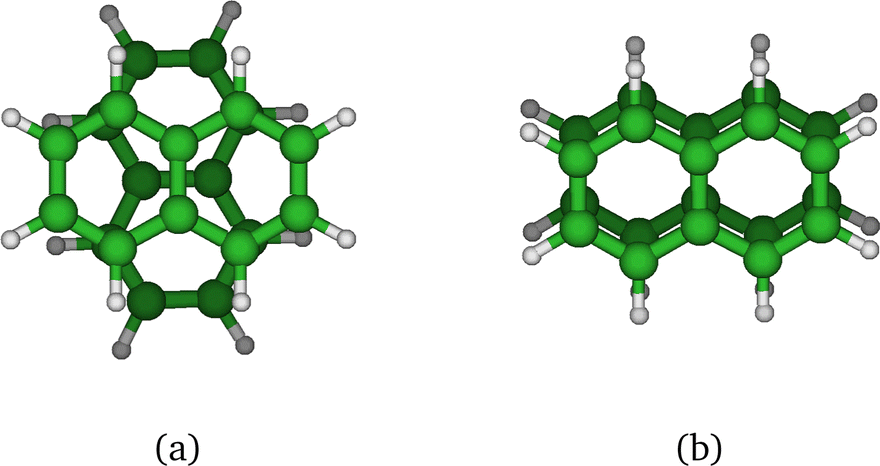 | ||
| Fig. 9 Parallel-twisted (a) and parallel-superposed (b) isomers. | ||
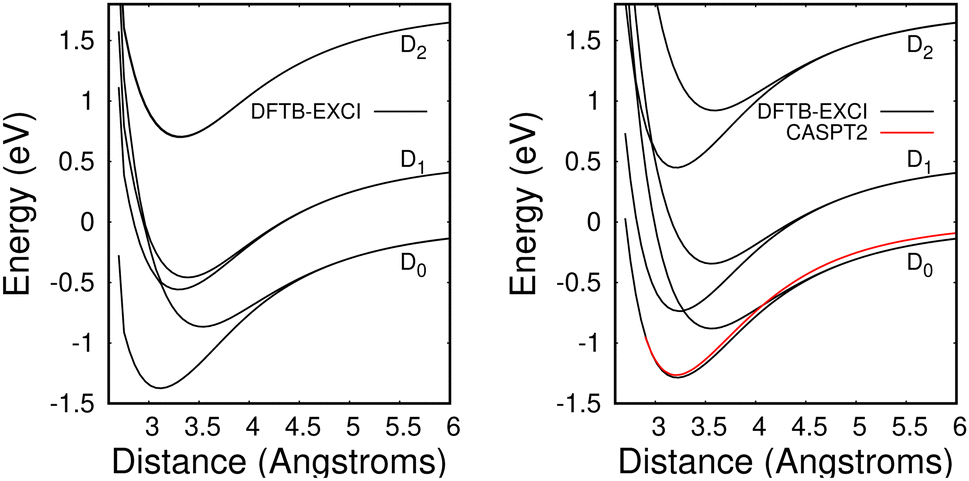 | ||
| Fig. 10 Potential energies for the ground state and the two lowest electronically excited states of the naphthalene dimer cation in twisted (left) and superimposed (right) geometries as a function of the distance between the two molecules dissociating into Np + Np+(D0, D1, D2). Black curves: DFTB-EXCI calculations with corrections from comparisons with CASPT2 calculations from ref. 36 (see the text). Red curve: CASPT2 results36 for the ground state of the superimposed geometry. Note that the two upper DFTB-EXCI states correlated with Np + Np+(D2) are degenerate for the twisted geometry (see the text). | ||
Using this corrected DFTB-EXCI scheme for electronic structure calculations, the absorption spectra were determined using a parallel tempering Monte Carlo (PTMC) scheme for a panel of temperatures ranging from T = 10 K to T = 500 K to describe the geometrical landscapes visited at various temperatures. The simulation included all intra- and inter-monomer motions.
The PTMC simulation on the ground state potential energy surface was run for 150![[thin space (1/6-em)]](https://www.rsc.org/images/entities/char_2009.gif) 000 steps with exchanges attempted every 10 steps. In addition, configurations were retained every 10 steps (15000 in total) to compute the absorption spectra. The theoretical spectrum at a given temperature was built through energy histograms compiling the transitions at a given energy weighted by their oscillator strengths.
000 steps with exchanges attempted every 10 steps. In addition, configurations were retained every 10 steps (15000 in total) to compute the absorption spectra. The theoretical spectrum at a given temperature was built through energy histograms compiling the transitions at a given energy weighted by their oscillator strengths.
 | (6) |
We first comment on the configurational evolution on the ground state potential surface at various temperatures. Up to T = 200 K, the cluster remains in its lowest energy basin around the parallel twisted isomer of Fig. 9a with increasing fluctuations as the temperature is raised.
At T = 300 K, the PTMC simulation also explores the parallel superposed structure basin including, for instance, the structure labeled 300K (a) in Fig. 11. Additionally, other transient structures such as those labeled 300 K (b) and 300 K (c) in Fig. 11 also contribute to the simulation. At T = 400 K and even more at T = 500 K, a larger diversity of geometries is explored, and some examples are given in Fig. 11. Note that the PTMC snapshots shown here have no statistical significance, but only illustrate the PTMC excursion from the equilibrium isomer topology at the given temperature. Also note that at T = 500 K, the monomers become slightly curved, while the dihedral angle between the two monomer planes hardly exceeds 25 degrees.
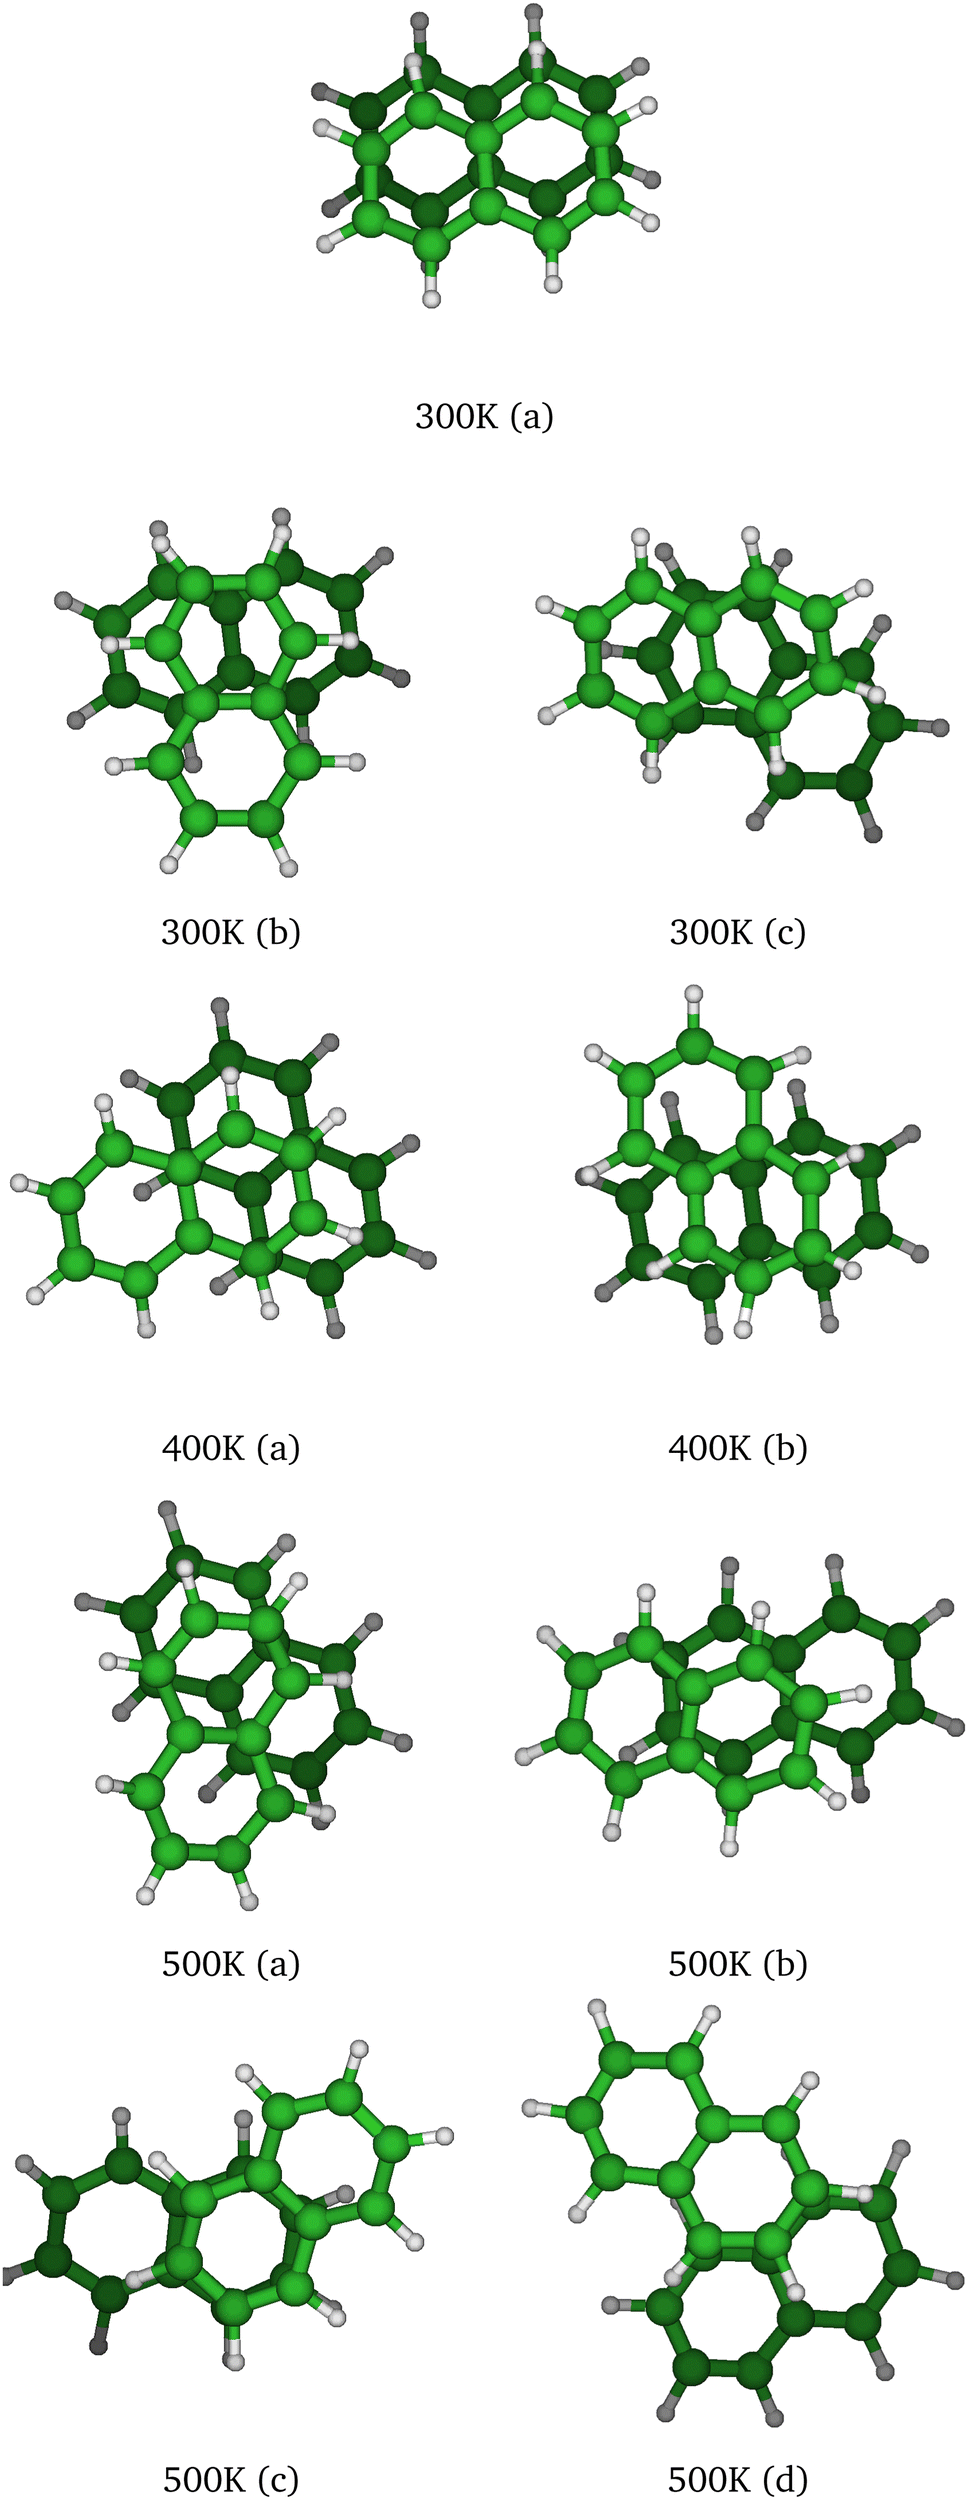 | ||
| Fig. 11 Selected structural snapshots extracted from the PTMC exploration at various temperatures. | ||
In the electronic spectra computed for the monomer cation at various temperatures, a single band corresponding to D0–D2 excitation is observed slightly below 2 eV. This band exhibits a weak shift and broadening with increasing temperature.
The evolution of the CR bands is shown in Fig. 12. At T = 10 K, the calculated CR band of the naphthalene dimer cation has a peak just below 1 eV, which is correlated with that of the parallel-twisted configuration. When the temperature is increased, the CR band undergoes both strong red-shifting and broadening. At T = 500 K, the CR maximum intensity is at around 0.65 eV, and the band extends over a wide energy range between 0 and 1.5 eV. At high temperatures, the energy shift and broadening are due to increasing geometrical fluctuations. Conversely, above T = 300 K, isomerization is a determining factor, which can be inferred from the bottom subplot of Fig. 12 showing the vertical CR absorption band of the parallel-superposed geometry at 0.66 eV (red line on left side of the bottom panel of Fig. 12). The LE part of the spectrum exhibits a 2.25 eV peak at low temperatures. The position of this peak is in good agreement with the peak around 2.2 eV reported in previous experimental studies.24,34 In the present simulations, this peak also strongly broadens with increasing temperature. One can notice the rise of a peak around 1.7 eV above T = 300 K. This peak is due to the contribution of geometries close to the superposed structure, the vertical spectrum of which exhibits a distinct band at 1.72 eV. This peak contributes finally to the extension of the LE absorption range between 1.6 and 3 eV at T = 500 K. Despite their broadening, the CR and LE bands remain well separated up to 500 K.
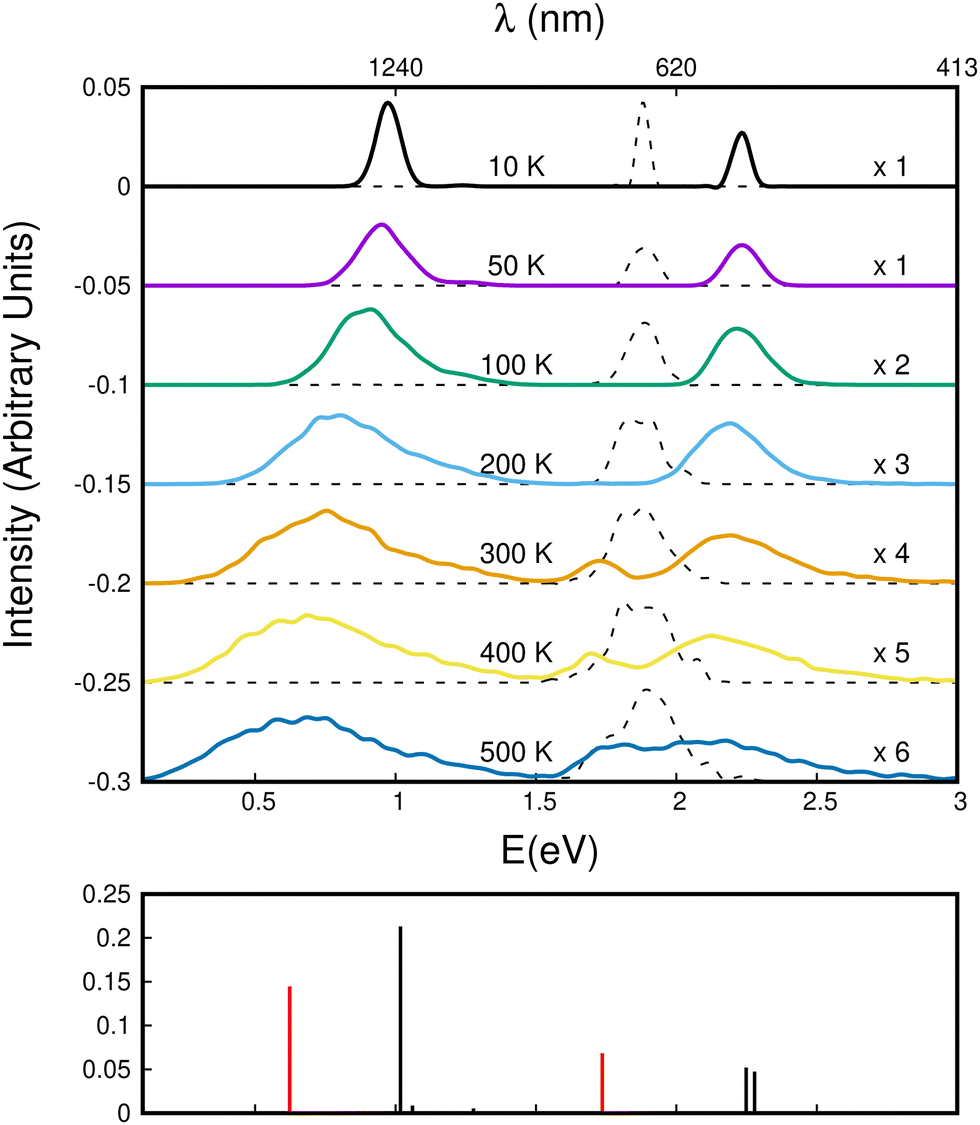 | ||
| Fig. 12 Top panel: Theoretical absorption spectra as a function of the temperature for the naphthalene dimer (color lines) and monomer (dashed lines) cations. The bottom panel indicates the energies of the vertical absorption bands of the parallel-twisted (black) and parallel-superposed (red) geometries. | ||
In Fig. 13, we show the evolution of the CR band position (top panel) and width (full width at half maximum in the bottom panel) as functions of temperature. The shift in the CR band position is roughly linear with temperature. A linear regression on the calculated data points gives for the peak position:
| hν (eV) ≈ hν0 − 0.685 × 10⁻³ × T (K) | (7) |
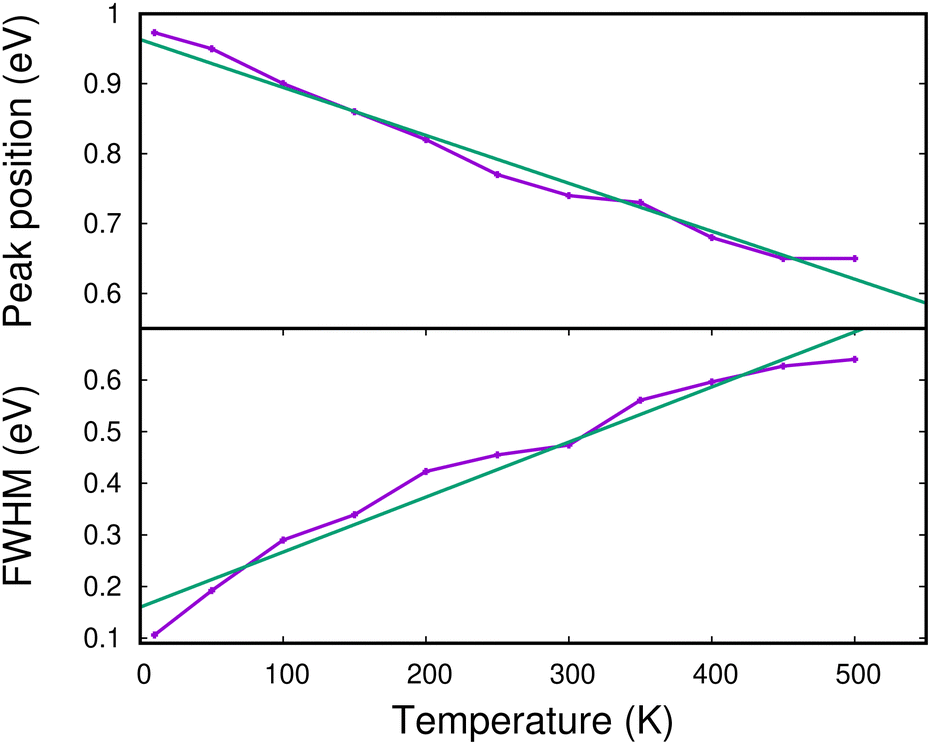 | ||
| Fig. 13 Theoretical energy position of the maximum (upper panel) and width (lower panel) of the CR band as functions of temperature. The green lines are linear fits to the calculated data (see the text). | ||
5 Radiative cooling model
The physics of the IR emission of PAHs has been described since the early days of the PAH model.9 The main concepts are (i) the energy absorbed is redistributed by internal vibration redistribution (IVR) over all the vibrational modes and (ii) the emission proceeds according to mode population and associated Einstein coefficients. While a thermal model proves to be a good approximation for relatively high values of the internal energy, this is not the case for low energies. The absorption and emission of photons is, therefore, best described using microcanonical statistics.44 This is very critical when one wants to describe the emission of the low-frequency flopping modes in the far IR.45 Another critical aspect is that, at low energy, the vibrational energy is no longer redistributed statistically. This is expected to happen at a mode decoupling energy, Edec. As the DESIREE storage ring is operated at a nominal temperature of 13 K, we can therefore expect to reach quite low temperatures and even to reach a regime of decoupling beyond which it is not possible to define a temperature anymore. Although experimental measurements for Edec are very scarce, Felker & Zewail46 have shown that, for anthracene, C14H10, intramolecular vibrational redistribution is efficient at a vibrational energy of 1792cm−1 and negligible at 1420cm−1. Based on these values, a reference value of Edec = 1700cm−1 was therefore used in emission models for interstellar PAHs.44,45
The IR cooling of neutral PAH clusters has been modeled previously to study the competition between fragmentation and IR cooling.16,23 Within a somewhat simplified description, these studies assumed that the IR cooling was driven by intramolecular modes and therefore neglected the role of intermolecular modes. Here, we consider both intramolecular and intermolecular modes. The list of vibrational frequencies and associated IR intensities were obtained by combining DFT results on neutral Np and cationic Np+ from the spectral PAH database (https://astrochemistry.oa-cagliari.inaf.it/database/)47 to describe the intramolecular modes, with data on the intermolecular modes given by the DFTB-EXCI calculation on (Np)2+. The six intermolecular modes were calculated at 28.4, 59.4, 59.7, 112.4, 113.0 and 126.3 cm−1 with IR intensities of 0.0, 0.1, 0.0, 0.3, 0.3 and 8.8 km mol−1, respectively. The reason for using both sets of data is that the calculated frequencies and IR intensities for intramolecular modes are less precise in DFTB compared to DFT. On the other hand, DFTB-EXCI provides a better description of charge resonance and, therefore, of the characteristics of the intermolecular modes.
We calculated the IR emission rates using microcanonical statistics following Allamandola et al.9 The rate of spontaneous emission for a νi IR mode in the (v − 1) ← v transition is given by:
| kv,v−1IR(νi) = Av,v−1iPvi | (8) |
| Pvi = ρr(U − vhνi)/ρ(U) | (9) |
| Av,v−1i = vA1,0i | (10) |
The cooling curve of (Np)2+ was simulated using a kinetic Monte Carlo model in which only the IR cooling is taken into account as described in ref. 45. The Monte Carlo model provides the evolution of the internal energy with time, from which the evolution of the micro-canonical temperature can be derived (see Fig. 14 as an example). The parameters of the Monte Carlo model are U(0), the initial internal energy, and Edec, the decoupling energy. The dissociation energy of (Np)2+ was calculated to be around 1.4 eV (see Fig. 10). Consequently, in the IR cooling simulations, we have considered U(0) values of the order of 1 eV corresponding to the part of the internal energy distribution that is sufficiently cold for (Np)2+ to survive on long time scales. From the temperature, we derived the CR band position of (Np)2+ using eqn (7) in which the value hν0 (T = 0 K) is kept as a free parameter. A very good agreement between the model results and the experimental data is obtained for a value hν0 = 1.19 eV (see Fig. 15), which differs from the DFTB-EXCI value of 0.96 eV. Changing the initial internal energy in the Monte Carlo simulations from 1.0 eV to 1.4 eV results in slightly different curves for t ≲ 10 s, as can be seen in the inset of Fig. 15. At longer times, the differences are mostly due to differences in the decoupling energy (Fig. 15). With Edec = 1700 cm−1 (0.21 eV), the energy (and therefore the temperature) changes very slightly between 15 and 30 s (red curves in Fig. 15). With Edec = 1200 cm−1 (0.15 eV), the simulation curve shows a steeper slope, which is in better agreement with the experiment (green curves in Fig. 15). However, the best agreement is obtained for a model with a low or no decoupling energy (Fig. 15), which leads to a drop of the internal excitation energy down to 0.08 eV after 30 s (black curve in Fig. 14a). This corresponds to a microcanonical temperature of 114 K as can be seen in Fig. 14b. More precisely, in the studied time range up to 30 s, the two curves with Edec = 650 cm−1 and no decoupling are almost identical. It is only at times longer than 30 s that a clear difference can be seen between these curves. The value of Edec = 650 cm−1 was not selected randomly. It corresponds to the internal energy at which (Np)2+ has the same density of states (117 cm−1) as anthracene with an internal vibrational energy of 1700 cm−1. Therefore, the fact that our model at low decoupling energy (i.e. 650 cm−1) is in good agreement with the experimental curve appears consistent with the fact that vibrational decoupling is a matter of density of states.
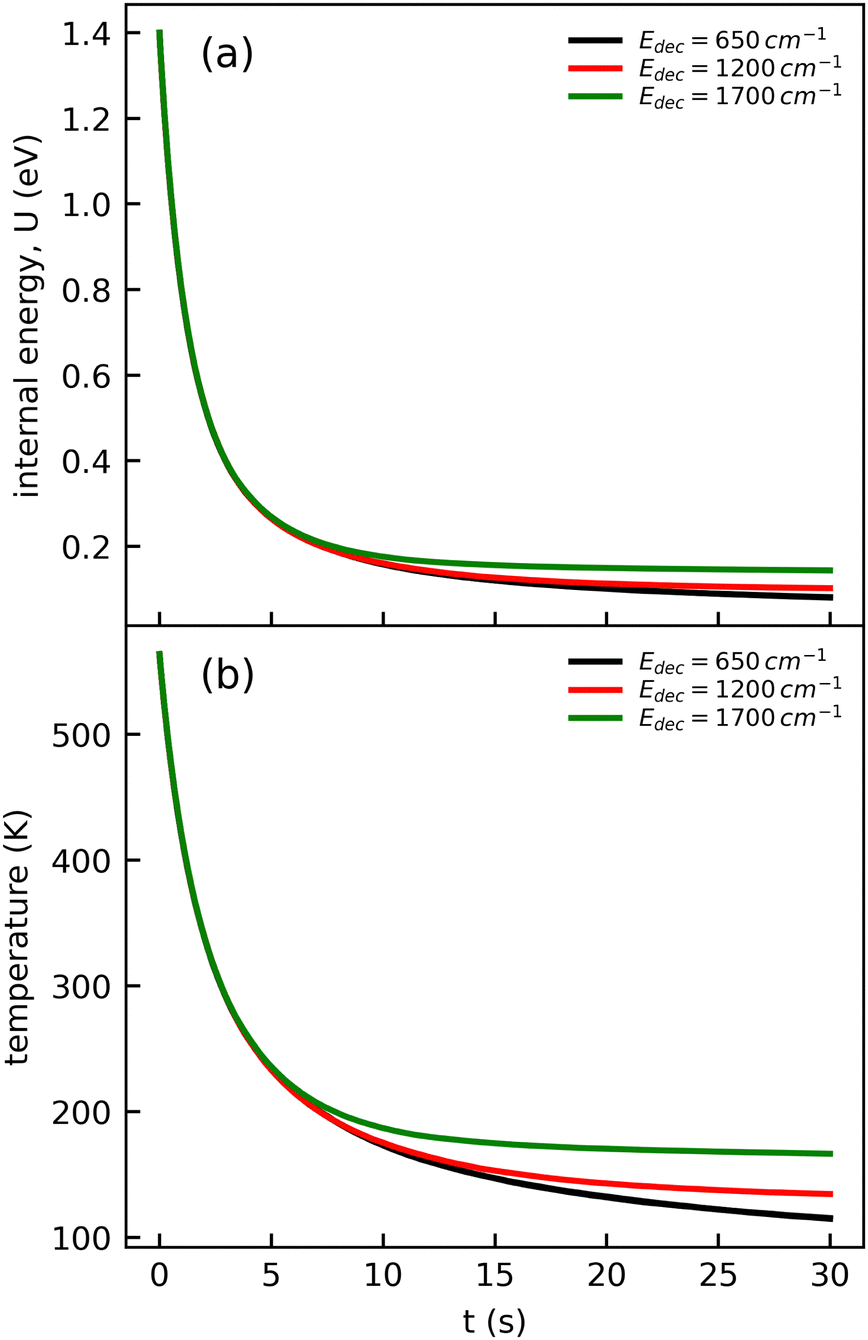 | ||
| Fig. 14 Time evolution of (a) the internal energy U and (b) the corresponding microcanonical temperature of (Np)2+ computed from the Monte-Carlo model for an initial internal energy U(0) = 1.4 eV and different values of the decoupling energy, Edec. | ||
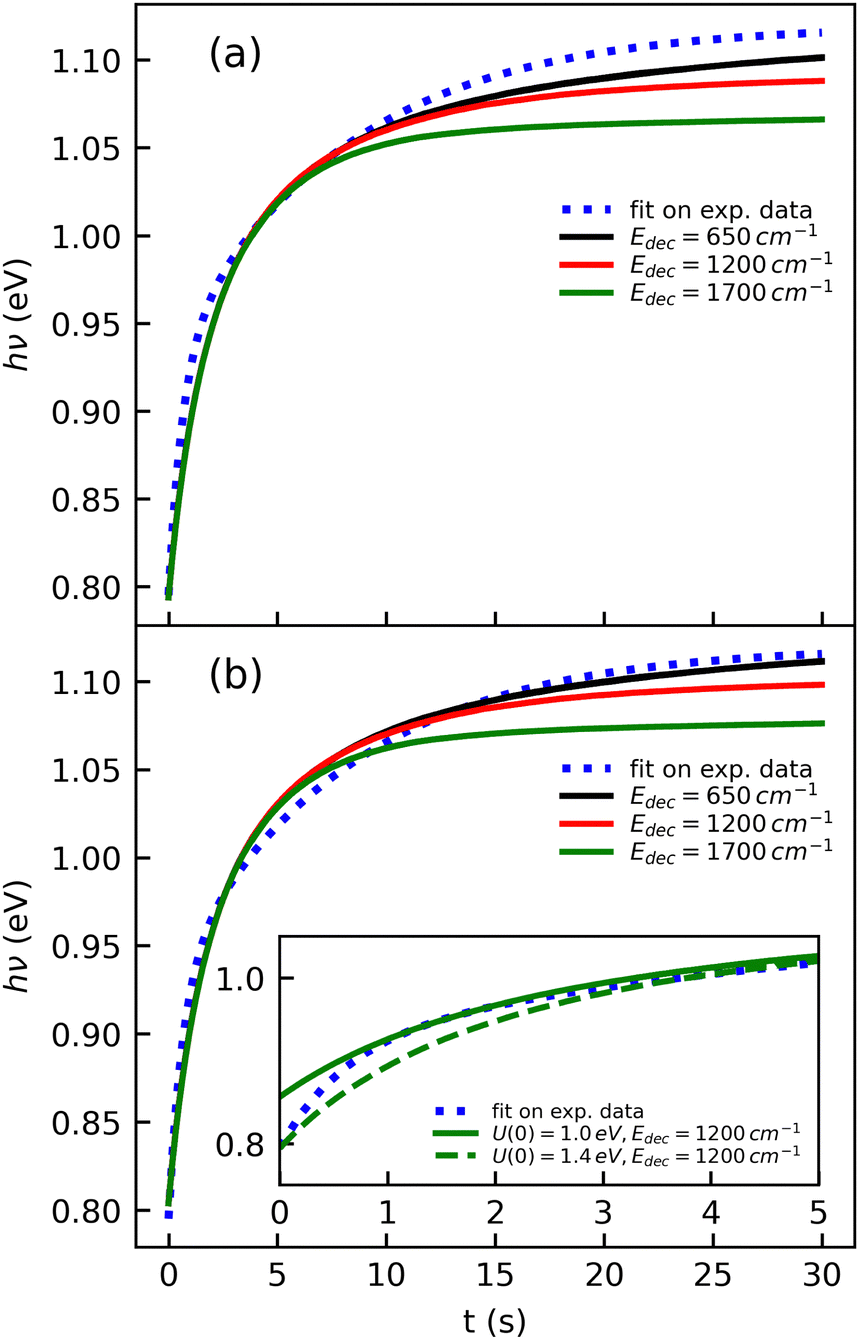 | ||
| Fig. 15 Simulations of the time evolution of the CR band position of (Np)2+ and comparison with the fitted experimental curve (eqn (1)). The simulated curves were obtained by combining the results from a kinetic Monte Carlo radiative cooling model with the temperature dependence of the position of the CR band using eqn (7). The parameters in the model are U(0), the initial internal energy, Edec, the decoupling energy, and the reference position hν0 in eqn (7). The simulated curves shown correspond to (a) U(0) = 1.4 eV, hν0 = 1.18 eV for different values of Edec, and (b) similar to case (a) but with U(0) = 1.0 eV and hν0 = 1.19 eV. The inset illustrates the effect of U(0) in the short time range. | ||
There are a number of uncertainties and approximations both in the analysis of the experimental data and in the simulations (quantum chemistry model and statistical cooling model) that can affect the coldest temperature derived in this study. The CR band is quite asymmetric and deriving its position has an average 5% relative uncertainty depending on the method used for its evaluation.
Moreover, we have assumed that any absorbed photon in the considered energy range would lead to a dissociation of the naphthalene dimer cation. This assumption seems reasonable for short timescales when the sum of the internal energy (Fig. 14) and the photon energy exceeds the expected binding energy (lowest minimum in DFTB-CI at 1.4 eV and 1.26 eV for the geometry-constrained parallel form estimated from CASPT2). At longer timescales, however, the estimated internal energy plus the absorbed photon energy do not reach the computed dissociation energy, which appears difficult to reconcile. Nonetheless, one should remain cautious with the theoretically estimated binding energy since one cannot exclude that it might be overestimated at the CASPT2 level (and consequently at the DFTB-CI level which has been reparameterized from CASPT2 in the present work). This would be consistent with previous studies on the pyrene dimer cation where the CASPT2 binding energy was calculated around 1.5 eV whereas a value of 1.07 eV appeared to be in better agreement with the experimental results.38 On the other hand, one cannot rule out a possible contribution of two-photon absorption mechanisms that would lower the energy onset of the CR band in the experimental photo-dissociation spectrum.
The contribution of different isomers at temperatures above 300 K is expected to affect the CR band position as shown in Fig. 12. This limits the comparison we can make on the 0–5 s storage time range between the fitted experimental curve and the simulated curves taking into account only infrared cooling. This also implies that the derived characteristic time of 0.64 s cannot be strictly analyzed in terms of radiative cooling.
As an additional source of error, one should also mention that the expression (eqn (7)) relating the CR band position to the temperature was derived in the canonical ensemble, whereas the Monte Carlo model is used for simulations at a given internal energy from which a microcanonical temperature is derived. Furthermore, the canonical and microcanonical temperatures differ for a finite system.49,50
6 Conclusion
We have investigated the infrared radiative cooling of (Np)2+ experimentally and theoretically. In DESIREE, (Np)2+ ions were produced with some vibrational excitation in the plasma of an ECR ion source and stored in a cryogenic environment for 30 s. Using action spectroscopy, we recorded the evolution of the charge resonance band with time. The position for the maximum intensity of this band was found to shift to higher frequencies as the ions cool down, suggesting that the CR band position can be used as a marker of radiative cooling.The experimental results were compared with simulations of the absorption spectrum in the range of 0–2.5 eV including both the charge resonance (CR) and local excitation (LE, local excitation in one of the Np molecules) bands and their evolutions with temperature. In the simulations, the CR band was found to be increasingly red-shifted and broadened with increasing temperatures between 10 and 500 K, most likely due to higher excitation energies and a larger number of degrees of vibrational fluctuations and rotational isomerization at higher temperatures. In particular, transitions between twisted and superposed structures can be seen around T = 300 K in the structural evolution of the parallel tempering Monte Carlo (PTMC) simulations.
The importance of the parallel-superposed structure at 300 K and above is reflected in the CR red-shift and the appearance of a transition at 1.7 eV, which is characteristic of this geometry. We have presented simple expressions describing the temperature dependencies of the position and width of the charge resonance (CR) band. By combining the expression for the CR-band position with a Monte Carlo simulation of the temporal evolution of IR cooling, we have estimated the initial internal energy of the (Np)2+ system and a decoupling energy that is lower than what has been assumed for PAHs so far. These results indicate that the CR-band red-shift, which we observe in the experiments – both at DESIREE and at Mini-Ring, is due to temperature evolution, associated with fluctuations and migrations out of the global minimum basin of the naphthalene-dimer cation system.
This work also calls for perspectives and further studies such as an extension of the wavelength domain to investigate the influence of the local excitation (LE) bands experimentally. On the theoretical side, it would be interesting to implement the post-absorption non-adiabatic molecular dynamics using DFTB-EXCI, which would open up for simulations of photo-fragmentation processes in full detail. Finally, since larger-size ionized molecular clusters often have a dimer or trimer core (e.g., see Table 1 in Joblin et al.14), the present study is a step toward a better understanding of elementary processes in PAH-cluster fragmentation via excited states. Such processes need to be considered while evaluating the survival of these species in astrophysical environments.
Author contributions
J. B.: conceptualization, methodology, investigation, formal analysis, data curation, supervision, funding acquisition, project administration, writing – original draft, writing – review & editing. S. M.: conceptualization, methodology, investigation. A. A. M: investigation, formal analysis. C. J.: conceptualization, methodology, investigation, formal analysis, resources, writing – original draft, writing – review and editing, supervision. M. C. J.: resources. H. Z.: formal analysis, funding acquisition, supervision, writing – review & editing. H. C.: formal analysis, funding acquisition, supervision, writing – review & editing. M. H. S.: resources, writing – review & editing. S. I.: resources, writing – review & editing. L. D.: conceptualization, methodology, formal analysis, investigation, software. F. S.: conceptualization, methodology, formal analysis, investigation, software, writing – original draft, writing – review and editing. D. T.: formal analysis, software, investigation M. R.: conceptualization, methodology, formal analysis, funding acquisition, investigation, software, writing – original draft, writing – review and editing.Data availability
Data presented in this paper are available from the corresponding author upon reasonable request.Conflicts of interest
There are no conflicts to declare.Acknowledgements
Some experiments were performed at the Mini-Ring ion storage ring in Lyon (FRANCE). JB, SM, CJ, and SI thank G. Montagne for technical support and acknowledge funding from the Agence Nationale pour la Recherche, ANR grant No ANR-21-CE30-0010, SynPAHcool. Some experiments were performed at the Swedish National Infrastructure, DESIREE (Swedish Research Council Contracts No. 2017-00621 and 2021-00155), and the authors gratefully acknowledge the staff of DESIREE for their contributions to the running of the DESIREE facility. The project was also granted access to the HPC resources at the CALMIP supercomputing centre (UMS CNRS 3667) under projects P0059 and P18009. CJ, JB, SM, MR, LD, and FS acknowledge funding from the European Research Council under the European Unions Seventh Framework Programme ERC-2013-SyG (G. A. 610256, NANOCOSMOS) and from the GDR EMIE 3533. HC, HTS, and HZ acknowledge funding from the Swedish Research Council (contract Nos 2023-03833, 2018-04092 and 2020-03437). MHS, HC, HTS, and HZ acknowledge support from the project grant “Probing charge – and mass-transfer reactions on the atomic level” (2018.0028) from the Knut and Alice Wallenberg Foundation. The present work is based upon work from COST Action (CA18212) – Molecular Dynamics in the GAS phase (MD-GAS), supported by COST (European Cooperation in Science and Technology).Notes and references
- A. Li, Nat. Astronomy, 2020, 4, 339–351 CrossRef.
- A. G. G. M. Tielens, Rev. Mod. Phys., 2013, 85, 1021–1081 CrossRef CAS.
- J. Montillaud, C. Joblin and D. Toublanc, Astron. Astrophys., 2013, 552, A15 CrossRef.
- J. Cernicharo, M. Agúndez, C. Cabezas, B. Tercero, N. Marcelino, J. R. Pardo and P. D. Vicente, Astron. Astrophys., 2021, 649, L15 CrossRef CAS PubMed.
- A. M. Burkhardt, K. L. K. Lee, P. B. Changala, C. N. Shingledecker, I. R. Cooke, R. A. Loomis, H. Wei, S. B. Charnley, E. Herbst, M. C. McCarthy and B. A. McGuire, Astrophys. J. Lett., 2021, 913, L18 CrossRef CAS.
- B. A. McGuire, R. A. Loomis, A. M. Burkhardt, K. L. K. Lee, C. N. Shingledecker, S. B. Charnley, I. R. Cooke, M. A. Cordiner, E. Herbst, S. Kalenskii, M. A. Siebert, E. R. Willis, C. Xue, A. J. Remijan and M. C. McCarthy, Science, 2021, 371, 1265–1269 CrossRef CAS PubMed.
- F. Mullie and J. Reisse, Organic Geo- and Cosmochemistry, Berlin, Heidelberg, 1987, pp. 83–117 Search PubMed.
- M. A. Sephton, Nat. Prod. Rep., 2002, 19, 292–311 RSC.
- L. J. Allamandola, A. G. G. M. Tielens and J. R. Barker, Astrophys. J. Suppl., 1989, 71(,), 733 CrossRef CAS PubMed.
- J. E. Roser and A. Ricca, Proc. Int. Astron. Union, 2019, 15, 415–416 CrossRef CAS.
- M. Rapacioli, C. Joblin and P. Boissel, Astron. Astrophys., 2005, 429, 193–204 CrossRef CAS.
- P. Pilleri, J. Montillaud, O. Berné and C. Joblin, Astron. Astrophys., 2012, 542, A69 CrossRef.
- Y. M. Rhee, T. J. Lee, M. S. Gudipati, L. J. Allamandola and M. Head-Gordon, Proc. Natl. Acad. Sci. U. S. A., 2007, 104, 5274–5278 CrossRef CAS PubMed.
- C. Joblin, L. Dontot, G. A. Garcia, F. Spiegelman, M. Rapacioli, L. Nahon, P. Parneix, T. Pino and P. Bréchignac, J. Phys. Chem. Lett., 2017, 8, 3697–3702 CrossRef CAS PubMed.
- M. Rapacioli, F. Spiegelman, A. Scemama and A. Mirtschink, J. Chem. Theory Comput., 2011, 7, 44–55 CrossRef CAS PubMed.
- M. Rapacioli, F. Calvo, C. Joblin, P. Parneix, D. Toublanc and F. Spiegelman, Astron. Astrophys., 2006, 460, 519–531 CrossRef CAS.
- S. Martin, M. Ji, J. Bernard, R. Brédy, B. Concina, A. R. Allouche, C. Joblin, C. Ortega, G. Montagne, A. Cassimi, Y. Ngono-Ravache and L. Chen, Phys. Rev. A: At., Mol., Opt. Phys., 2015, 92, 053425 CrossRef.
- J. W. L. Lee, M. H. Stockett, E. K. Ashworth, J. E. Navarro Navarrete, E. Gougoula, D. Garg, M. Ji, B. Zhu, S. Indrajith, H. Zettergren, H. T. Schmidt and J. N. Bull, J. Chem. Phys., 2023, 158, 174305 CrossRef CAS PubMed.
- S. Martin, L. Chen, A. Al-Mogeeth and J. Bernard, Phys. Rev. A, 2019, 99, 012712 CrossRef CAS.
- J. Bernard, M. Ji, S. Indrajith, M. H. Stockett, J. E. Navarro Navarrete, N. Kono, H. Cederquist, S. Martin, H. T. Schmidt and H. Zettergren, Phys. Chem. Chem. Phys., 2023, 25, 10726–10740 RSC.
- Y. Ebara, T. Furukawa, J. Matsumoto, H. Tanuma, T. Azuma, H. Shiromaru and K. Hansen, Phys. Rev. Lett., 2016, 117, 133004 CrossRef PubMed.
- M. H. Stockett, J. N. Bull, H. Cederquist, S. Indrajith, M. Ji, J. E. Navarro Navarrete, H. T. Schmidt, H. Zettergren and B. Zhu, Nat. Commun., 2023, 14, 395 CrossRef CAS PubMed.
- J. Montillaud and C. Joblin, Astron. Astrophys., 2014, 567, A45 CrossRef.
- J. Bernard, A. Al-Mogeeth, A.-R. Allouche, L. Chen, G. Montagne and S. Martin, J. Chem. Phys., 2019, 150, 054303 CrossRef CAS PubMed.
- J. Bernard, A. Al-Mogeeth, S. Martin, G. Montagne, C. Joblin, L. Dontot, F. Spiegelman and M. Rapacioli, Phys. Chem. Chem. Phys., 2021, 23, 6017–6028 RSC.
- G. A. Garcia, L. Dontot, M. Rapacioli, F. Spiegelman, P. Bréchignac, L. Nahon and C. Joblin, Phys. Chem. Chem. Phys., 2023, 25, 4501–4510 RSC.
- M. H. Stockett, M. Björkhage, H. Cederquist, H. T. Schmidt and H. Zettergren, Faraday Discuss., 2019, 217, 126–137 RSC.
- R. D. Thomas, H. T. Schmidt, G. Andler, M. Björkhage, M. Blom, L. Brännholm, E. Bäckström, H. Danared, S. Das, N. Haag, P. Halldén, F. Hellberg, A. I. S. Holm, H. A. B. Johansson, A. Källberg, G. Källersjö, M. Larsson, S. Leontein, L. Liljeby, P. Löfgren, B. Malm, S. Mannervik, M. Masuda, D. Misra, A. Orbán, A. Paál, P. Reinhed, K.-G. Rensfelt, S. Rosén, K. Schmidt, F. Seitz, A. Simonsson, J. Weimer, H. Zettergren and H. Cederquist, Rev. Sci. Instrum., 2011, 82, 065112 CrossRef CAS PubMed.
- H. T. Schmidt, R. D. Thomas, M. Gatchell, S. Rosén, P. Reinhed, P. Löfgren, L. Brännholm, M. Blom, M. Björkhage, E. Bäckström, J. D. Alexander, S. Leontein, D. Hanstorp, H. Zettergren, L. Liljeby, A. Källberg, A. Simonsson, F. Hellberg, S. Mannervik, M. Larsson, W. D. Geppert, K. G. Rensfelt, H. Danared, A. Paál, M. Masuda, P. Halldén, G. Andler, M. H. Stockett, T. Chen, G. Källersjö, J. Weimer, K. Hansen, H. Hartman and H. Cederquist, Rev. Sci. Instrum., 2013, 84, 055115 CrossRef CAS PubMed.
- J. Bernard, G. Montagne, R. Brédy, B. Terpend-Ordacière, A. Bourgey, M. Kerleroux, L. Chen, H. T. Schmidt, H. Cederquist and S. Martin, Rev. Sci. Instrum., 2008, 79, 075109 CrossRef CAS PubMed.
- J. Bernard, A. Al-Mogeeth, A.-R. Allouche, L. Chen, G. Montagne and S. Martin, J. Chem. Phys., 2019, 150, 054303 CrossRef CAS PubMed.
- L. Dontot, F. Spiegelman and M. Rapacioli, J. Phys. Chem. A, 2019, 123, 9531–9543 CrossRef CAS PubMed.
- E. Bäckström, D. Hanstorp, O. M. Hole, M. Kaminska, R. F. Nascimento, M. Blom, M. Björkhage, A. Källberg, P. Löfgren, P. Reinhed, S. Rosén, A. Simonsson, R. D. Thomas, S. Mannervik, H. T. Schmidt and H. Cederquist, Phys. Rev. Lett., 2015, 114, 143003 CrossRef PubMed.
- Y. Inokuchi, K. Ohashi, M. Matsumoto and N. Nishi, J. Phys. Chem., 1995, 99, 3416–3418 CrossRef CAS.
- J. Zhen, T. Chen and A. G. G. M. Tielens, Astrophys. J., 2018, 863, 128 CrossRef.
- L. Dontot, N. Suaud, M. Rapacioli and F. Spiegelman, Phys. Chem. Chem. Phys., 2016, 18, 3545–3557 RSC.
- Q. Wu and T. Van Voorhis, J. Chem. Theory Comput., 2006, 2, 765–774 CrossRef CAS PubMed.
- S. Zamith, J.-M. L'Hermite, L. Dontot, L. Zheng, M. Rapacioli, F. Spiegelman and C. Joblin, J. Chem. Phys., 2020, 153, 054311 CrossRef CAS PubMed.
- G. Seifert, D. Porezag and T. Frauenheim, Int. J. Quantum Chem., 1996, 58, 185–192 CrossRef CAS.
- G. Seifert and J.-O. Joswig, Wiley Interdiscip. Rev.: Comput. Mol. Sci., 2012, 2, 456–465 CAS.
- F. Spiegelman, N. Tarrat, J. Cuny, L. Dontot, E. Posenitskiy, C. Martí, A. Simon and M. Rapacioli, Adv. Phys.: X, 2020, 5, 1710252 CAS.
- C. Kelly, C. Cramer and D. Truhlar, Theo. Chem. Acc., 2005, 113, 133–151 CrossRef CAS.
- M. Rapacioli, T. Heine, L. Dontot, M. Yusef Buey, E. Posenitskiy, N. Tarrat, F. Spiegelman, F. Louisnard, C. Marti, J. Cuny, M. Morinière, C. Dubosq, S. Patchkovskii, J. Frenzel, E. Michoulier, H. Duarte, L. Zchekhov and D. Salahub, deMonNano, 2024, https://demon-nano.ups-tlse.fr/ Search PubMed.
- G. Mulas, G. Malloci, C. Joblin and D. Toublanc, Astron. Astrophys., 2006, 460, 93–104 CrossRef CAS.
- C. Joblin, D. Toublanc, P. Boissel and A. G. G. M. Tielens, Mol. Phys., 2002, 100, 3595–3600 CrossRef CAS.
- P. M. Felker and A. H. Zewail, Chem. Phys. Lett., 1984, 108, 303–310 CrossRef CAS.
- G. Malloci, C. Joblin and G. Mulas, Chem. Phys., 2007, 332, 353–359 CrossRef CAS.
- T. Beyer and D. Swinehart, Commun. ACM, 1973, 16, 379 CrossRef.
- J. Andersen, E. Bonderup and K. Hansen, J. Chem. Phys., 2001, 114, 6518–6525 CrossRef CAS.
- P. Hänggi, S. Hilbert and J. Dunkel, Philos. Trans. R. Soc., A, 2016, 374, 20150039 CrossRef PubMed.
| This journal is © the Owner Societies 2024 |