 Open Access Article
Creative Commons Attribution 3.0 Unported Licence
Molecular field analysis for data-driven molecular design in asymmetric catalysis
Shigeru
Yamaguchi

RIKEN Center for Sustainable Resource Science, 2-1 Hirosawa, Wako, Saitama 351-0198, Japan. E-mail: shigeru.yamaguchi.hw@a.riken.jp
First published on 6th July 2022
Abstract
This review highlights the recent advances (2019–present) in the use of MFA (molecular field analysis) for data-driven catalyst design, enabling to improve selectivities/reaction outcomes in asymmetric catalysis. Successful examples of MFA-based molecular design and how to design molecules by MFA are described, including how to generate and evaluate MFA-based regression models, and future challenges in MFA-based molecular design in molecular catalysis.
1. Introduction
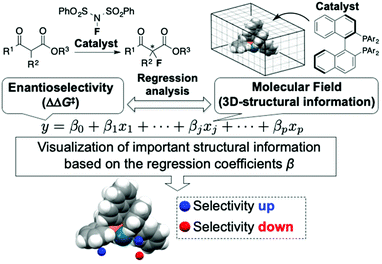
The use of molecular catalysis, such as asymmetric catalysis, metathesis, cross-coupling, and organocatalysis, is essential for modern organic synthesis. Currently, the development and optimization of catalytic reactions highly rely on the time and labor-intensive trial-and-error approach. Machine learning-based data-driven approaches have attracted tremendous interest recently due to their potential to change the conventional reaction development processes.1 Although classification2 and clustering3 techniques have been applied to analyze molecular catalysis/reactivities of transition metal complexes, regression analysis between reaction outcomes (e.g., enantioselectivity) and molecular descriptors is one of the central foci in data-driven approaches for the design and optimization of molecular catalysis. Among the regression-based data-driven approaches, this review focuses on MFA (molecular field analysis). MFA in asymmetric catalysis is regression analysis between enantioselectivity and molecular fields calculated by 3D (3-dimensional)-molecular structures placed in a grid space (Fig. 1).1 The fascinating characteristic of MFA is that we can visualize important structural information about enantioselectivity. The structural information seems to be useful for molecular design in asymmetric catalysis. However, there were no examples of the design of molecules showing improved enantioselectivity based on the visualized information until our report in 2019.4 Although excellent reviews about data science in molecular catalysis including MFA in asymmetric catalysis have been reported,1 MFA-based molecular design to improve enantioselectivities has not been summarized to date. Therefore, the purpose of this review article is to highlight the recent advances (2019–present) in the use of MFA (molecular field analysis) in asymmetric catalysis for data-driven catalyst design to improve selectivities, in particular, molecular design based on the visualized structural information. Before introducing the successful examples of MFA-based data-driven molecular design, we present a brief background of regression analysis in organic chemistry as well as in molecular catalysis.2. Overview of regression analysis in molecular catalysis
2.1. A brief background of regression analysis in organic chemistry
In the 1930s, Hammett reported that there are correlations between reaction rates in the hydrolysis of a series of substituted benzoates and equilibrium constants of the corresponding benzoic acids,5 which is one of the most important works in regression-based data science in organic chemistry. The Hammett σ calculated from acid dissociation constants of a series of meta- and para-substituted benzoic acids is a useful electronic descriptor, which is still being frequently used for mechanistic study in organic reactions including molecular catalysis. These relationships are called (linear) free energy relationships since logarithms of reaction rate constants and acid dissociation constants correspond to the activation free energies of the reactions and free energy differences before and after acid dissociations, respectively. The extension of the Hammett rule has been actively investigated in physical organic chemistry,6 and the development of useful descriptors including steric descriptors such as Taft Es has been reported in this context.7In the 1960s, Hansch and Fujita et al. applied the extended Hammett rule to predict biological activities of molecules,8 which led to the construction of the QSAR (quantitative structure–activity relationships) field6,9 and the Hansch–Fujita method is called classical QSAR. QSAR employs biological activities as the target variables. In this review, the target variables are product selectivity. Such regression analysis can be called QSSR (quantitative structure–selectivity relationship) or QSPR (quantitative structure–property relationship) modelling. According to the perspective paper ‘Understanding the roles of the “two QSARs”’10 published by Fujita and Winkler, QSAR/QSPR models can be roughly divided into two types:
Type I: Models for mechanistic interpretations by analysis of small sets of chemically similar molecules.
Type II: Models for predicted purposes relying on machine learning techniques using large and chemically diverse datasets.
The free energy relationships represented by the Hammett rule are classified as Type I because the main purpose of free energy relationships/the Hammett rule is an interpretation of reaction mechanisms through the data analysis of chemically similar datasets. This review article focuses on regression analysis in asymmetric catalysis. The target variables in asymmetric catalysis are logarithms of enantiomeric ratios, which correspond to free energy differences (ΔΔG‡) between the pathways that lead to major and minor enantiomers (Curtin–Hammett principle11). Thus, linear regression analysis in asymmetric catalysis can be regarded as free energy relationships. Free energy relationships in asymmetric catalysis have been investigated by the Sigman group.1 In 2008, Sigman and co-workers reported free-energy relationships/univariate regression analysis in asymmetric Nozaki–Hiyama–Kishi reactions using a classical steric descriptor, Taft–Charton parameters.12,13 Since then, the Sigman group has examined various descriptors, in particular descriptors that can be calculated on computers, such as Sterimol parameters,14 computed IR frequencies,15 and so on. They performed mechanistic interpretation and molecular design in molecular catalysis including asymmetric catalysis based on their modern physical organic chemistry framework.1
In contrast to the above Type I QSPR that mainly aims for mechanistic interpretation, the purpose of Type II QSPR is prediction. Although Type II usually employs large and chemically diverse datasets according to the aforementioned perspective paper,10 we call the regression models that aim to quantitatively predict reaction outcomes as Type II in this article. For example, the Doyle group constructed the regression model to predict reaction yields in Buchwald–Hartwig reactions using Random Forests.16 While the authors collected test and training samples by a systematic combinatorial screening of similar catalysts, substrates, and reagents (i.e., analysis of a chemically similar dataset), the main purpose of their regression analysis was the quantitative prediction of reaction yields. Thus, we classify the above example as Type II QSPR. Denmark and co-workers reported another representative example of Type II QSPR/QSSR. They demonstrated the prediction of higher selectivity catalysts using molecular fields as descriptors and non-linear regression techniques such as support vector machines and neural networks.17 While they also employed the framework of MFA (i.e., the main topic of this review), their purpose is prediction and thus, the analysis is classified as Type II QSSR in this article. The Glorius group reported Type II QSPR/QSSR modeling using Denmark's and Doyle's datasets along with molecular fingerprint descriptors (bit strings that represent molecular structures).18 The aforementioned perspective paper by Fujita and Winkler described “One of the major drivers for the emergence of two main “camps” of QSAR researchers has been the increasingly arcane nature of the descriptors used in QSAR models generated by nonclassical (e.g., machine learning-based) methods that have become popular”.10 Thus, it should be noted that descriptors are important for judging the types of models. In our opinion, however, the types of QSAR/QSPR models can be classified by purpose as described above (Type I: models for mechanistic interpretation, Type II: models for prediction), although further discussions regarding this classification will be required. As the Denmark and Doyle groups employed nonclassical machine learning-based methods such as neural networks and their purposes are prediction, we classify their models as Type II, although they employed highly interpretable and physically meaningful descriptors. This review mainly focuses on the MFA classified as Type I that provides mechanistic insights leading to molecular design with improved enantioselectivity in asymmetric catalysis.
2.2. Molecular field analysis in asymmetric catalysis
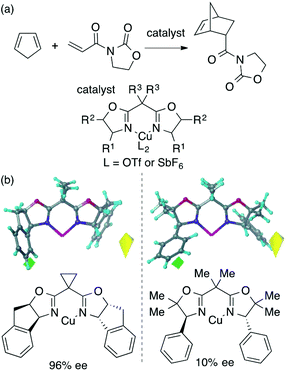
The main topic of this review, i.e., MFA (molecular field analysis), has been originally developed in the QSAR field in 1988, which has been called CoMFA (comparative molecular field analysis).19 Various 3D-QSAR methods related to CoMFA have been developed such as CoMSIA,20 4D-QSAR,21 GRIND,22 and so forth. Therefore, in order to avoid confusion, we employ the term MFA to call the CoMFA-related 3D-QSAR/QSPR methods. MFA was introduced into the field of asymmetric catalysis in 2003 by the Lipkowitz23 and Kozlowski24 groups. The result of MFA reported by the Lipkowitz group is shown in Fig. 2 and the procedure by which the authors performed MFA is as follows:23 a set of molecular structures is optimized using a molecular mechanics method. The set of the obtained coordinates is aligned based on the common catalyst skeleton, and the structures are placed into a grid space as shown in Fig. 1. Probe atoms that have the van der Waals properties of sp3 carbon and a charge of +1.0 are placed at each intersection of the grid space (grid spacing 1–2 Å). The Lennard-Jones (LJ) and coulombic potentials between the molecules and the probe atoms at each intersection are calculated to obtain the molecular interaction fields. The molecular fields are then correlated with the logarithms of product enantiomeric ratios (ΔΔG‡ = −RT log(enantiomeric ratio)). In MFA, the number of descriptors usually exceeds the number of samples. In such a case, the ordinary least squares method cannot be used to generate regression models, and thus, MFA typically employs PLS (partial least squares) regression. PLS regression analysis allows for the use of a large number of descriptors25 as PLS employs a set of linear combinations of variables, reducing the dimension of descriptors. MFAs in asymmetric catalysis summarized in this section also employ PLS regression unless otherwise noted.Since the Lipkowitz and Kozlowski reports, MFA was used for the analysis of asymmetric catalysis.26 In 2004, the Hirst group reported MFA in phase transfer asymmetric catalysis (Scheme 1a), in which the authors calculated descriptors from substituents R1 and R2 without considering catalyst structures (topomer CoMFA27).28 Denmark et al. also reported MFA in similar reactions29 (Scheme 1b), in which they employed an indicator field (vide infra) instead of the typical molecular field described above. Lei et al. reported MFA in Ru-catalyzed asymmetric hydrogenation of acetophenones30 (Scheme 1c).
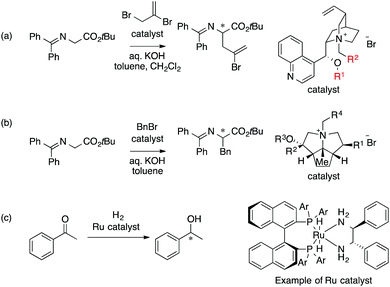 | ||
| Scheme 1 (a) Asymmetric phase transfer catalysts analyzed by Hirst et al. (ref. 28) (88 samples [training set: 70 samples, test set: 18 samples], data range: 16% ee–93% ee, R2 = 0.82, q2 = 0.72, R2pred = 0.69). (b) Asymmetric phase transfer catalysts analyzed by Denmark et al. (ref. 29) (data range: −28% ee–62% ee, R2 = 0.94, q2 = 0.79 (0.76*)) *leave 20% cross validation over 100 runs. (c) Ru-Catalyzed ketone hydrogenation reactions analysed by Lei et al. (ref. 30) (25 samples [training set: 20 samples, test set: 5 samples], data range: −99% ee–99% ee, R2 > 0.99, q2 = 0.80, R2pred = 0.97). Schemes 1–4 were adapted and modified with permission from CICSJ Bull., 2017, 35, 133. Copyright 2017 the Chemical Society of Japan. | ||
The examples shown above employed LJ and coulombic potentials between probe atoms and molecules as molecular fields.
The Kozlowski group reported MFA that employed the quantum-mechanics (QM)-based interaction energy between probe atoms and molecules (QM-QSAR31).24,32,33 The target reaction was enantioselective addition of diethyl zinc reagents to aldehydes using chiral amino alcohols. The authors used transition-state structures that lead to major enantiomers (Scheme 2a(I)) for the calculation of molecular fields.24 The authors performed linear regression with two descriptors selected from the molecular fields by a simulated annealing method. They also employed catalyst structures32 (Scheme 2a(II)) and substrate structures33 for calculations of the molecular fields. The authors performed QM-based MFA in asymmetric lithiation–substitution of N-Boc–pyrrolidine as well.34
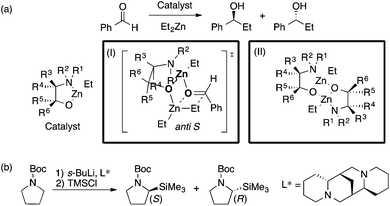 | ||
| Scheme 2 (a) Asymmetric alkylation of aldehyde using β-amino alcohols analyzed by Kozlowski et al. (I) Analysis using molecular fields calculated from transition state structures (ref. 24) (18 samples [training set: 14 samples, test set: 4 samples], data range: 0% ee–98% ee, R2 = 0.90, R2pred = 0.92). (II) Analysis using molecular fields calculated from catalyst structures (ref. 32) (31 samples [training set: 18 samples, test set: 13 samples], q2 = 0.85 [leave-two-out cross validation], R2pred = 0.87). (b) The asymmetric lithiation–substitution of N-Boc–pyrrolidine analyzed by Kozlowski et al. (ref. 34) (16 samples, data range: 0% ee–97% ee, R2 = 0.82, q2 = 0.67). | ||
MFA requires alignment based on, for example, a common catalyst skeleton for the calculations of molecular fields. An alignment independent 3D-QSAR method, GRIND (GRid Independent Descriptor),22 has been applied to MFA in asymmetric catalysis by the Morao group35 using Kozlowski's and Lipkowitz's datasets (Fig. 2 and Scheme 1a). Bo et al. reported combinations of a QM-based method and GRIND for the calculations of molecular fields in asymmetric catalysis.36 Carbó et al. applied the GRIND-based MFA to the analysis of Rh-catalyzed asymmetric hydroformylation of styrenes37 (Scheme 3).
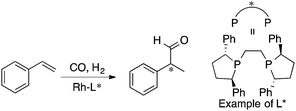 | ||
| Scheme 3 Rh-Catalyzed asymmetric hydroformylation of styrenes analyzed by Carbó et al. (ref. 37) (21 samples, data range: 2% ee–94% ee, R2 = 0.99, q2 = 0.74). Quantum mechanical method is used for calculations of molecular fields. | ||
The MFA described above employed one of the conformers (e.g., the most stable conformers) for the calculations of molecular fields. MFAs using molecular fields calculated from the structures obtained from a trajectory of MD simulations (4D-QSAR21) and Boltzmann-weighted conformers (3.5D-QSAR) have been reported by the Hirst group.38 The target was asymmetric phase transfer catalysis shown in Scheme 4.
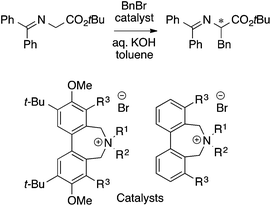 | ||
| Scheme 4 Asymmetric phase transfer catalysts analyzed by Hirst et al. (ref. 38) (40 samples, data range: 30% ee–91% ee, CoMFA R2 = 0.94, q2 = 0.78, 3.5D-QSAR R2 = 0.95, q2 = 0.82, 4D-QSAR R2 = 0.86, q2 = 0.76). | ||
2.3. Trials for the molecular design based on MFA
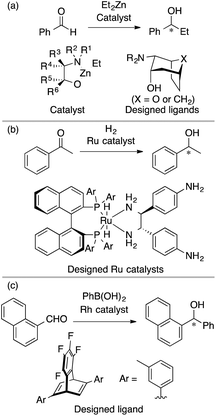
As described in the introduction and as shown in Fig. 2, MFA enables the extraction and visualization of important structural information for enantioselectivity, which can provide insights into asymmetric induction mechanisms. Thus, MFA can be classified as Type I QSPR/QSSR (models for mechanistic interpretation). The visualized information seems to be useful for molecular design. Among the MFAs described above, in this section, we pick up examples of molecular design. In 2006, Kozlowski et al. reported a seminal report on the design of chiral catalysts using MFA in asymmetric carbonyl addition reactions of a diethyl zinc reagent (Fig. 3a).32 In 2016, Lei et al. reported the design of a chiral ligand in Ru-catalyzed asymmetric hydrogenation of acetophenone (Fig. 3b).30 In 2017, we reported the design of a chiral diene ligand in Rh-catalyzed asymmetric carbonyl addition reactions of Ar–boronic acids (Fig. 3c)39 during the research on introducing LASSO40/Elastic Net41 into MFA in asymmetric catalysis. Despite the efforts, there were no examples of the successful design of molecules showing improved selectivities. This is not surprising because the prediction of higher performance catalysts typically corresponds to extrapolation. Although the data-driven approach can accurately predict reaction outcomes in the reactions using similar molecules to those included in training samples, it is difficult to predict the properties/catalytic activities of molecules outside the range of training samples.3. Successful examples of MFA-based data-driven molecular design
There were no successful examples of molecular design to improve enantioselectivity based on the structural information visualized by MFA despite researchers’ trials as described in the last section. During our research, however, we noticed that almost all the previous MFA employed molecular structures without complexation to substrates4,26 except for the MFA reported by the Kozlowski group24 (Scheme 2a(I)). Asymmetric reactions proceed stereoselectively via catalyst–substrate complexes. We envisioned that the use of intermediate structures or transition-state structures in enantio-determining steps composed of catalysts and substrates for the calculations of molecular fields would enable the extraction and visualization of more detailed information on asymmetric induction mechanisms, and the information would lead to a molecular design with improved enantioselectivity.3.1. Molecular field analysis using intermediate structures4
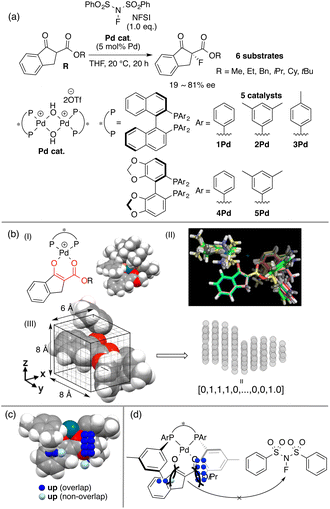
BINAP is one of the most representative chiral ligands for asymmetric catalysis. We selected a target asymmetric reaction that includes BINAP–metal complex catalysts to examine the presented concept. The reaction that we analyzed is shown in Fig. 4a; it proceeds as follows: the BINAP–Pd catalysts react with substrates (β-ketoesters) to form Pd-enolate complexes (Fig. 4b(I)), followed by an enantioselective nucleophilic attack on an electrophile (NFSI: N-fluorobenzenesulfonimide) affording products.42 The Pd-enolate complexes are the intermediates in the enantio-determining step and therefore, we employed the structures for the calculation of molecular fields.As molecular fields, we used steric indicator fields, which are composed of indicator variables (0,1 values) and calculated as follows (Fig. 4b): (I) a set of Pd-enolate structures was optimized using the DFT method. (II) The coordinates of the set of molecules obtained in step I were aligned based on the common reactive site of the intermediates, which is shown in red in Fig. 4b(I). Atoms except for the β-ketoester and equatorial Ar groups on the ligands were removed. (III) The structures were placed in a grid space. The unit cell size is 1 Å per side. The enolate α-carbon was set as the origin, and the xy plane was defined based on the enolate mean plane. The size of the grid space, which is centered at the origin, is 6 × 8 × 8 Å3. Each unit cell is regarded as an element of the descriptor vectors. The unit cells that included the van der Waals radii of any atoms were counted as 1, or were otherwise counted as 0. Columns in the descriptor matrix that exhibited small deviations were removed. The calculations of the molecular fields are further discussed in section 4.2 “How to calculate descriptors”. MFA described in sections 3.2 and 3.3 also employed the steric indicator fields. MFA in this section employed LASSO or Elastic Net regression39–41 instead of PLS regression, which is typically employed in MFA.
The indicator fields and enantioselectivity values were correlated to generate regression models. The structural information extracted by regression analysis is shown in Fig. 4c along with an intermediate structure. The definition of important structural information shown in sections 3 and 4 is summarized below.
Blue/red points correspond to molecular fields (i.e., unit cells shown in Fig. 4b(III)) with positive/negative regression coefficients, respectively. If molecular structures are on the blue/red points, enantioselectivity increases/decreases. Blue (red)/light blue (light red) points indicate that molecular structures overlap/do not overlap with the points.
We can obtain insights into asymmetric induction mechanisms based on the visualized information as the MFA is Type I QSPR. In this case, the blue points mainly exist on the Si-face and were observed around the aryl group on the ligands and the ester substituents on the substrates (Fig. 4c). This means the substituents formed a pocket around the reaction centre, hindering the reaction from the Si-face (Fig. 4d). On the other hand, the aryl group of the ligands and the ester-substituents on the Re-face were on the same side, indicating that the nucleophilic attack of the Pd-enolate on the fluorinating reagent (i.e., NFSI) proceeds smoothly from the Re-face.
Further comparison between visualized structural information and intermediate structures showed us that light blue points visualized on some intermediate structures would lead to the design of molecules as shown in Fig. 5a(I) and b(I) (yellow arrows). We designed a ligand and a substrate by introducing substituents to overlap with the light blue points. Both intermediates composed of a designed ligand (6Pd) and substrate (Bzh) overlap with the blue points as shown in Fig. 5a(II) and b(II) (green arrows), and both the intermediate structures make the pocket on the Si-face narrow. The calculated ΔΔG‡ values in the reactions using the designed molecules showed excellent values (Fig. 5c). The reaction using the designed substrate exhibited significantly improved enantioselectivity in comparison with those in the training samples (94% ee vs. up to 81% ee, Fig. 5c).
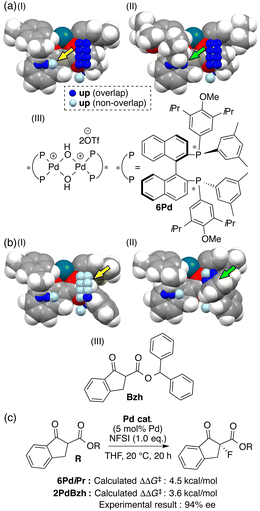 | ||
| Fig. 5 Molecular design of (a) chiral ligand 6Pd and (b) substrate Bzh based on the MFA using intermediate structures and (c) the reaction using the substrate. | ||
3.2. Molecular field analysis using computational screening data43
MFA using the intermediate structures enables the visualization of highly interpretable structural information that leads to the design of molecules with improved selectivity. This methodology is useful when high-quality experimental data are available. Such high-quality data are, however, not always available. In some cases, experimental data include non-negligible noise derived from various factors, such as side reactions and experimental errors. In such cases, it should be useful to employ enantioselectivity data obtained by transition-state (TS) calculations based on DFT methods. While there is an example of the use of computational screening in asymmetric catalysis obtained by TS calculations for regression analysis, the number of training samples are more than 600.44 As the cost of TS calculations is high, it may be desirable to develop the data-driven catalyst design method based on a small number of computational screening data. A combination of MFA and transition-state calculations will fulfill this demand. Thus, we performed MFA using computational screening data. We selected N-heterocyclic carbene (NHC)–Cu-catalyzed asymmetric carbonyl additions of a silylboronate to aldehydes as a target reaction (Fig. 6).45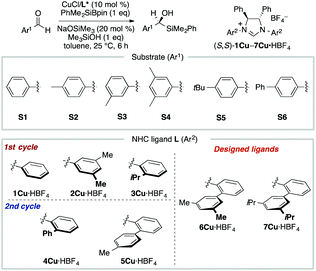 | ||
| Fig. 6 Dataset for the MFA using computational screening data. Reprinted with permission from Bull. Chem. Soc. Jpn., 2022, 95, 271. Copyright, The Chemical Society of Japan. | ||
To collect samples, TS calculations were performed using a combination of three NHC ligands (1Cu–3Cu) and six substrates (S1–S6). The range of the experimental ee (enantiomeric excess) was 18–73% ee. The MFA was performed using the calculated ΔΔG‡ values and corresponding transition-state structures. The extracted and visualized structural information provided an insight into the asymmetric induction mechanism (see section 4.3, Fig. 14). Based on the obtained insight, chiral ligands 4Cu and 5Cu were designed by introducing substituents into the template molecules to overlap the light blue point designated by yellow and green arrows shown in Fig. 7a and b, which exhibit improved calculated ΔΔG‡ values in comparison with the design template. The experimental enantioselectivity values in the reactions using the designed NHC ligands were higher in comparison with those in the training samples (87% ee vs. up to 73% ee). The MFA using computational screening data including the designed NHC ligands (30 training samples calculated from the combination of five ligands and six substrates) was performed and based on the visualized information, NHC ligands were designed again, which showed improved experimental enantioselectivity (96% ee vs. up to 89% ee) as shown in Fig. 7c and d. While 6Cu was an already examined optimum ligand in the related catalytic systems, and 7Cu is the ligand that would not be examined without the information obtained by the MFA using computational screening data.
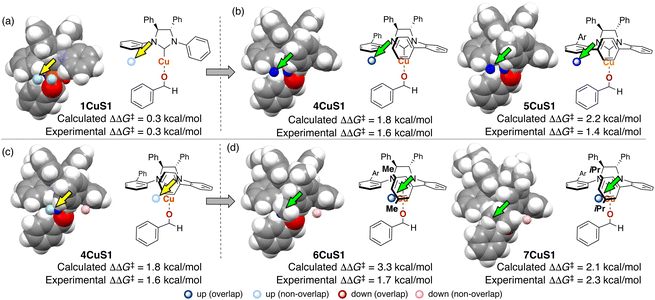 | ||
| Fig. 7 Molecular design based on the MFA using computational screening data and the experimental results. The results of MFA using (a), (b) 18 samples and (c), and (d) 30 samples. As molecular fields, the indicator fields are calculated by a similar procedure shown in Fig. 4. The sizes of the grid spaces (unit cell size: 1 Å per side) were 6 × 6 × 6 Å3 for the 1st MFA (18 training samples) and 6 × 8 × 8 Å3 for the 2nd MFA (30 training samples). | ||
Both the MFAs using computational and experimental screening data described in the previous section have particular strengths and these are usually complementary. The characteristics of the MFA using computational screening data are listed below.43
• We can collect training samples without experiments.
• High calculation cost (transition-state calculations)
• The calculated ΔΔG‡ values include less information in comparison with the experimental ΔΔG‡ values.
• Reaction mechanism must be to some extent known.
On the other hand, the MFA using experimental screening data and intermediate structures4 described in section 3.1 has the following characteristics:
• High-quality experimental data are required.
• Reasonable calculation cost (ground-state calculations)
• The experimental ΔΔG‡ values provide a lot of information including solvent effects etc.
• This method is applicable even when reaction partner structures are unclear (we did not calculate descriptors from the reaction partner, i.e., NFSI as shown in section 3.1).
In summary, as experimental data includes a lot of information that is difficult to reproduce by DFT calculations such as solvent effects, the MFA using intermediate structures and experimental data can extract more information in comparison with the MFA using computational screening data. In some cases, however, it is not easy to collect high-quality data due to, for example, the use of expensive and synthetically difficult catalysts. In such cases, the MFA using computational screening data are useful.
3.3. Molecular field analysis for stereodivergent asymmetric synthesis46
As we have emphasized in this review, MFA is Type I QSPR and can be regarded as an analytical method. Analytical methods enabling investigation of the details of molecular structures/properties (e.g., NMR and single-crystal X-ray diffraction analysis) accelerate molecular science research including organic synthesis. To check the potential of the MFA framework, we have tried data-driven catalyst design for stereodivergent asymmetric synthesis. For the development of catalytic asymmetric reactions that afford products bearing continuous stereocentres, at least four reaction outcomes (enantio- and diastereoselectivity in each diastereomer) should be controlled through catalyst structure optimization. Catalyst design to access all possible stereoisomers in such reactions (i.e., catalytic stereodivergent asymmetric synthesis) remains a formidable challenge in organic synthesis.47 Our group has revealed that the MFA-based data-driven catalyst design can control such complicated reactions.46A specific target is an asymmetric two-component iridium/boron dual catalyst system for α-C-allylation of carboxylic acids48 (Fig. 8). The target reaction proceeds as follows: Ir-catalyst activates the substrate to afford the Ir–π-allyl intermediate and the chiral Boron species activates the remaining carboxylate moiety to generate chiral B-enolate species. The chiral B-enolate species attacks the chiral Ir–π-allyl complex to stereodivergently afford products (Fig. 8). Inversion of the absolute configuration of the chiral ligands on the B-catalyst shown in Fig. 9a changes the relative configuration of the products. Although the initial attempt of the reaction afforded products with excellent enantioselectivity, both the reactions using the S and R boron catalysts showed low diastereo- and regioselectivity (linear/branch selectivity; the structure of the linear product is shown in Fig. 9a). Thus, the purpose of the analysis is the improvement of regio- and stereoselectivities to selectively synthesize (2R,3R)- and (2S,3R)-products when using the S and R boron catalysts, respectively. Importantly, the Ir–π-allyl complexes are the well-established49 common intermediates in the diastereo- and regioselectivity determining step. Thus, molecular fields calculated from a set of Ir–π-allyl intermediate structures allow us to analyse four sets of reaction outcomes. While the boron enolate structures were not used for the calculation of the descriptors/molecular fields, the information about the boron catalysis is included in the experimental data. Thus, analysis using experimental ΔΔG‡ values and the molecular fields calculated from Ir–π-allyl complexes extracts and visualizes the information about how the Ir–π-allyl complex and the B-enolate interact with each other when the reaction proceeds. Important structural information about the four selectivity outcomes visualized on the identical intermediate structures enables facile comparison of their selectivity determining factors, thereby allowing to control the multiple reaction outcomes.
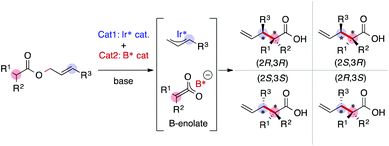 | ||
| Fig. 8 Asymmetric iridium/boron hybrid catalysis for stereodivergent synthesis of α-allyl carboxylic acids. | ||
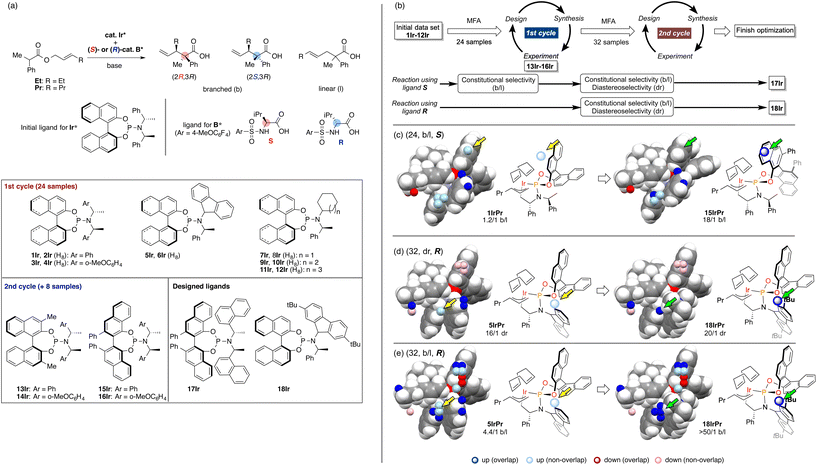 | ||
| Fig. 9 The result of the MFA and the molecular design in asymmetric Ir/B hybrid catalysis. (a) Dataset for the MFA in asymmetric Ir/B hybrid catalysis. (b) Overall design path. (c)–(e) Important structural information visualized on the Ir–p-allyl intermediates and the molecular design based on the structural information. The number in parenthesis is the number of reactions used for the MFA. As molecular fields, the indicator fields were calculated using a similar procedure shown in Fig. 4. The size of the grid space (unit cell size: 1 Å per side) is 10 × 12 × 6 Å3. Adapted with permission from Cell. Rep. Phys. Sci., 2021, 2, 100679. Copyright 2021 Cell Press. | ||
The overall design process is summarized in Fig. 9b. Using the training data (two sets of 24 reactions) collected by screening a combination of 12 phosphoramidite ligands and two substrates (Fig. 9a), the MFA was performed. The training samples are selected mainly based on availability (for more details about the selection of the training data, see section 4.1). As shown in Fig. 9b, among the four regression models, the model for the b/l ratios in the reactions using boron ligand S was employed for molecular design. The important structural information visualized on the Ir–π-allyl intermediate structures are shown in Fig. 9c. Light blue points are found around the 3,4-positions of the binaphthyl skeleton. Four ligands 13Ir–16Ir were designed by introducing substituents to overlap with the light blue points. The structure of 15IrPr (intermediate consisted of ligand 15Ir and substrate Pr) is shown in the right panel of Fig. 9c. The reactions using ligands 13Ir–16Ir showed improved regioselectivity. While regioselectivity improved, diastereoselectivity values were not satisfactory. Thus, we collected additional training samples using the designed ligands and again performed the MFA using the 32 training samples. As shown in Fig. 9b, MFA using 32 samples led to the design of optimum ligands Ir17 for the boron ligand S and Ir18 for the boron ligand R. Here, we show the molecular design based on the MFA using the data obtained from the reactions using boron ligand R as shown in Fig. 9d and e.. The structural information for the b/l ratios and dr visualized by MFA is shown in Fig. 9d and e. The light blue points are observed around the 2-position of the fluorene moiety of 5IrPr. Therefore, we introduced the tBu group to the position and the reaction using the designed ligand 18Ir showed excellent regio- and diastereoselectivity. In summary, the analysis of 32 molecular structures with the MFA framework enabled the control of complicated organic reactions, stereodivergent asymmetric synthesis, indicating the powerful potential of our data-driven approach. The overview of molecular design in this complicated reaction can be found as a movie in the original literature (https://ars.els-cdn.com/content/image/1-s2.0-S2666386421004045-mmc7.mp4).
4. The technical guideline for the data-driven molecular design in the MFA framework
4.1. How to select training samples and evaluate the generated regression models
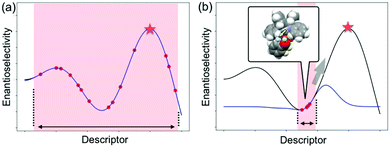
As described in the last section, the MFA using intermediate or transition-state structures enables highly interpretable structural information that leads to the design of molecules with improved selectivity. Generally, the selection of training samples is important for a molecular design using regression models. Our MFA framework, however, does not require careful selection of the training samples as the MFA belongs to Type I QSPR. In order to explain this point, a rough image of the difference between Type I and Type II QSPR is shown in Fig. 10. Y- and X-axes represent enantioselectivity (ΔΔG‡) and descriptor. The black and blue lines are a true function and regression model, respectively. Red dots and red stars are training samples and a target molecule, respectively. One of the purposes of regression analysis is the functional approximation of the true function using training samples. In the case of Type II QSPR, molecules are designed based on predicted values, meaning that the target sample should be included in the region in which the constructed regression model can accurately predict the enantioselectivity values as shown in Fig. 10a (such a region is known as an applicability domain). Thus, a large amount of training data and/or carefully selected training samples should be required, which was recently demonstrated by the Denmark group.17 As shown in Fig. 11, the Denmark group selected chiral catalysts for training samples from their virtual library using the Kennard–Stones algorithm. Then, they collected more than 700 training samples by screening catalysts and substrates combinations and performed machine learning analysis using deep feed-forward neural network regression. As shown in Fig. 11E, the authors succeeded in predicting higher selective catalysts based on the constructed regression model. In other words, the authors generated the regression model so that higher-selectivity catalysts have existed in the applicability domain of the constructed regression model. This is a situation shown in Fig. 10a (a target sample represented by the star mark exists in the applicability domain of the model shown in pale red). Later, the authors demonstrated the prediction of higher selective catalysts using a smaller size of training samples selected by k-means clustering.50 On the other hand, molecular design using the MFA that belongs to Type I QSPR is based on visualized structural information/mechanistic insights as shown in Fig. 10b. We can estimate the region where higher selective catalysts would exist based on the combination of extracted information and researchers’ intuition. As the design is not based on predicted values, the narrow region of the applicability domain (the pale red region in Fig. 10b) is not a problem, thus allowing rough sample selection with small sample sizes as long as we can extract the information that leads to the design of molecules and as long as the quality of the constructed regression models is high enough based on statistical metrics.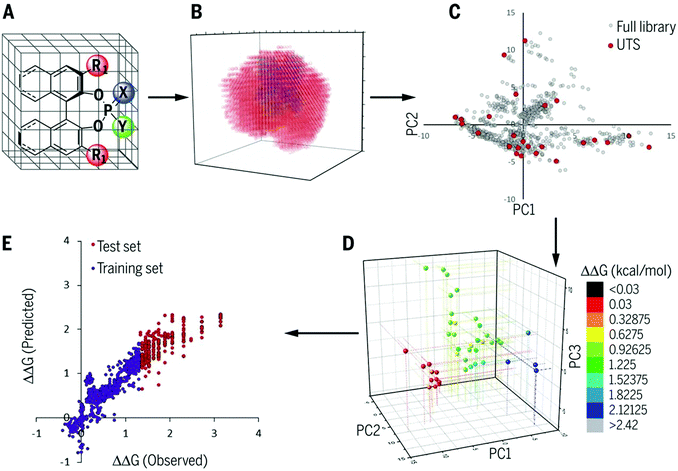 | ||
| Fig. 11 Chemoinformatics-guided optimization protocol. (A) Generation of a large in silico library of catalyst candidates. (B) Calculation of robust chemical descriptors. (C) Selection of a universal training set (UTS). (D) Acquisition of experimental selectivity data. (E) Application of ML to use moderate- to low-selectivity reactions to predict high-selectivity reactions. Reproduced with permission from ref. 17. Copyright 2019 American Association for the Advancement of Science. | ||
Regarding the statistical metrics, there have been long debates on the evaluation of regression models in QSAR/QSPR.51 One of the widely employed indices for the evaluation of the quality of QSAR/QSPR models is Golbraikh–Tropsha criteria.51 These criteria specify that leave-one-out cross-validated coefficient of determination q2, by itself, is insufficient for evaluating the model and that external validation is necessary. The following criteria must be satisfied to validate the model: (1) high q2 and R2pred (coefficient of determination calculated from a test set) values must be obtained; (2) one of the coefficients of determination for the regressions of a test set through the origin (either predicted vs. observed values R02pred or observed vs. predicted values R0′2pred) should be close to R2pred; (3) the slope of a regression line of the predicted vs. observed (k) or observed vs. predicted (k′) values of a test set through the origin should be close to 1. These are described in greater detail below and an example to explain condition 3 is shown in Fig. 12.
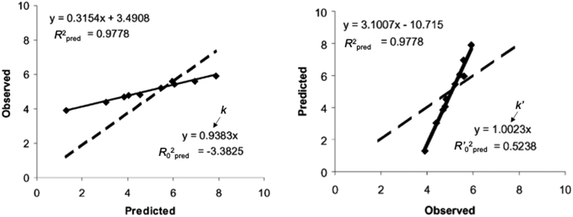 | ||
| Fig. 12 An example of regression between observed vs. predicted (a) and predicted vs. observed (b) activities for compounds from an external test set. Despite the high R2pred value and both k and k′ close to 1, the model is not highly predictive, because the regressions through the origin of the coordinate system are not close to the optimal regressions. Note that R02pred and R′02pred are substantially different from each other. Adapted with permission from ref. 51. Copyright 2002 ELSEVIER. | ||
1. Coefficient of determination for a test set R2pred > 0.6.
2. Leave-one-out cross-validated coefficient of determination q2 > 0.5.
3. (R2pred − R02pred)/R2pred or (R2pred − R′02pred)/R2pred < 0.1 and 0.85 < k or k′ < 1.15.
Our studies employed the above criteria to evaluate the regression models and test sets for the evaluations were selected based on PCA (principal component analysis) so that the test samples cover the entire descriptor space.43,46
We also employed k-fold cross-validation (k = 4 or 5 in our previous analysis) and y-randomization for the evaluation as well. In the case of the MFA in NHC–Cu catalysis (section 3.2), the regression models used for the design showed q2 > 0.5 for 18 training samples and R2, q2, Q2, >0.5, and R2yrandom < 0.1 for 30 training samples. In the case of the MFA in Ir/B dual catalysis (section 3.3), the regression models showed R2, q2, Q2 > 0.6, and R2yrandom < 0.2. Thus, at this stage, R2, q2, Q2, >0.5, and R2yrandom < 0.2 seems to be one of the useful criteria to evaluate the MFA-based regression models, while further accumulation and discussion of examples should be required regarding which criteria should be used to evaluate regression models in the MFA framework.
4.2. How to calculate descriptors
MFA has been originally developed for ligand-based drug design.19 MFA employs molecular (interaction) fields as descriptors instead of explicit consideration of protein structures. For calculations of molecular fields, a set of small molecules/ligands are placed into the grid space. Interaction energies such as Lennard-Jones and coulombic potentials between probe atoms placed at each intersection and the small molecules/ligands are calculated and used as molecular fields. Regression analysis between biological activities such as IC50 and molecular fields extracts and visualizes the important region around ligands for the biological activities.19 In the case of asymmetric catalysis, however, the molecular structures (i.e., sizes, shapes, and positions/geometries) of catalysts and substrates themselves are important for selectivity. Thus, we employ indicator fields composed of indicator variables, which can be regarded as digitized molecular structures (Fig. 4b). The MFA using indicator fields can extract and visualize which parts of the molecular structures are important for selectivity.We designed the molecules based on mechanistic insights obtained from the structural information visualized by MFA, meaning we utilize the researchers’ intuition as well. This MFA framework also uses the researchers’ intuition not only for the molecular design but also for the calculations of the descriptors/molecular fields. In all the cases that successfully designed the molecules showing improved selectivity, the molecular structures around the reaction centre were used for the calculation of the molecular fields. We explain the details regarding this point using the MFA described in section 3.1. In the MFA of section 3.1, molecular fields were calculated from the structure around the reaction centre as shown in Fig. 4b(III). The extracted structural information by the MFA is shown in Fig. 4c. The same intermediate structure shown in Fig. 4c is again shown in Fig. 13 along with the information visualized by MFA that employed the molecular field calculated from the whole Pd-enolate structures. The important structural information was observed far from the reactive site as marked by red arrows, which is not in accordance with our intuition. Moreover, it is difficult to understand the asymmetric induction mechanism, based on the structural information in contrast to the result of the MFA shown in Fig. 4c. Thus, dimension reduction of descriptors/molecular fields based on researchers’ intuition is required to extract meaningful information for mechanistic interpretation and molecular design.
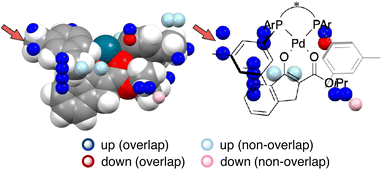 | ||
| Fig. 13 A result of the MFA using the whole structures of the Pd-enolate complexes for the calculations of molecular fields. | ||
4.3. Key points enabling extraction and visualization of the structural information that leads to the molecular design with improved selectivity
This section describes key points about why the MFA using intermediate and transition-state structures enables the extraction of the structural information that leads to the molecular design showing improved selectivity.The first key point is the reduction of conformational flexibility. The Pd-enolate structures shown in Fig. 4b(I) are composed of BINAP–Pd catalysts and β-ketoesters. Their structures themselves have conformational flexibility to some degree. For example, the ester moiety of the β-ketoesters can be freely rotated. The complexation of catalysts and substrates reduces this conformational flexibility. Steric interactions with the Ar-group of BINAP derivatives hinder the rotation of the ester moiety on the substrates. This facilitates the determination of conformers that could be employed for the calculations of molecular fields.
The second point is alignment. Alignment of the molecules is required for the calculations of molecular fields as shown in Fig. 4b. MFA in medicinal chemistry is a ligand-based drug design and thus protein structures are not considered explicitly. Which parts of molecular structures are used as the standard for the alignment is one of the biggest problems in evaluating biological activities using MFA. On the other hand, in the MFA of asymmetric catalysis, intermediate and transition-state structures usually involve reactive sites. Thus, molecules can be easily aligned based on the reactive sites. Even when the reactive sites are flexible and are not suitable for the standard of alignment, the molecular structures can be aligned based on the chiral catalyst skeleton. MFA using a set of molecular structures aligned based on the reactive sites or chiral catalyst skeleton allows for the comparison of subtle structural differences that are important for selectivity outcomes and are difficult to capture only by researchers’ intuition (vide infra).
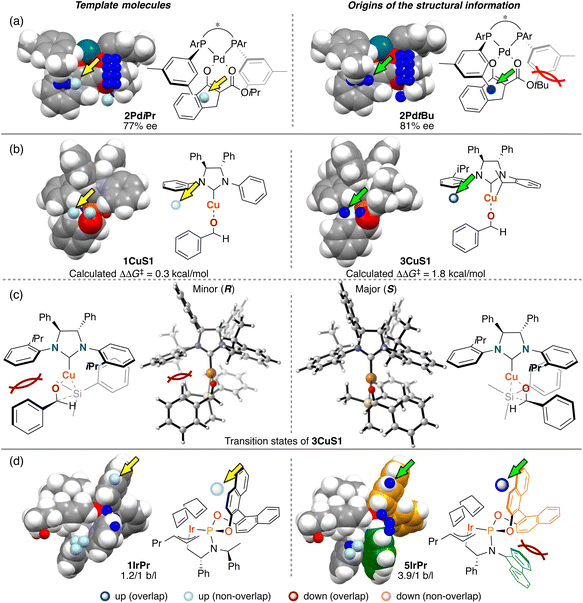
The third point is the structural change induced by interactions between catalysts and substrates. Most of the structural information used for the molecular design shown in section 3 is derived from the structural change. We explain the details about this point using Fig. 14. In Fig. 14, examples of the template molecules for the molecular design and the molecular structures that are the origins of the structural information used for the molecular design in the three MFAs described in section 3 are shown (origins of structural information means that the information disappears when removing the molecules from training samples).
In the case of the Pd-catalysed asymmetric fluorination reactions, the blue point used for the catalyst design is derived from the Pd-enolate structure bearing a tBu substituent on the β-ketoesters (e.g., 2PdtBu shown in Fig. 14a). Due to steric repulsion between the tBu group and the Ar group on the BINAP derivatives, the Ar group on the ligand in the Si face gets closer to the reactive site as shown in Fig. 14a (i.e., the pocket on the Si face explained in section 3.1 becomes narrow). On the other hand, the Pd-enolate structure bearing an iPr group instead of the tBu group does not overlap with the blue point. Thus, we can design the molecule based on Pd-enolate by introducing the substituents to overlap the blue point as shown in Fig. 5a.
In the case of the NHC–Cu-catalysed asymmetric carbonyl addition reactions, the blue point used for the catalyst design is derived from the transition-state structure bearing an iPr-substituent on the NHC ligand (e.g., 3CuS1 shown in Fig. 14b). Due to steric repulsion between the iPr group and the silyl substituent, the phenylene group on the ligand shows positional change, thereby inducting steric crush with the substrate in the transition-state of the minor pathway (Fig. 14c). On the other hand, the transition-state structures in the major pathway do not show such interactions between the NHC ligands and the substrate as shown in Fig. 14c. The visualized structural information provides this mechanistic insight. We can design molecules by introducing the substituents into the template molecules to overlap the blue point as shown in Fig. 7.
In the case of the Ir-catalysed reactions, the blue point used for the catalyst design to improve regioselectivity is derived from the Ir–π-allyl intermediate structures of 5IrPr bearing a fluorene moiety (Fig. 14d). Due to steric repulsion between the binaphthyl skeleton and the fluorene moiety, the binaphthyl skeleton gets closer to the terminal allyl carbon, hindering the reaction that affords the undesired linear products. Thus, we can design molecules based on the Ir–π-allyl intermediate structure 1IrPr by introducing the substituents to overlap the blue point as shown in Fig. 9c and 14d.
5. Outlook
Our MFA framework enables the design of molecules showing improved selectivity. The key point is the use of intermediate or transition-state structures in enantio-determining steps for the calculations of descriptors. Moreover, whole molecular structures have not been employed for the calculations of molecular fields. Instead, the structures around the reactive site are used for the calculations of descriptors to reduce descriptor dimensions and suppress overfitting. The molecular design is performed based on the combination of the visualized structural information and researchers’ intuition. The close collaboration between machine learning/data science and researchers’ intuition in the whole processes of MFA facilitates the molecular design in asymmetric catalysis.The research regarding the Type I MFA-based data-driven catalyst design enabling the improvement of reaction outcomes is just starting and there are many issues that should be tackled. Some of them are introduced below as outlook.
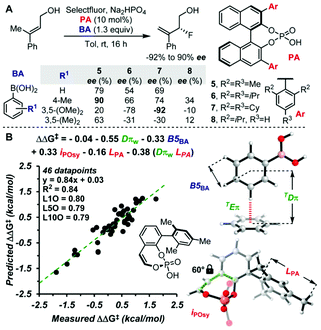
The molecular fields used for the molecular design so far are the steric indicator fields. It should be possible to extract further information by using, for example, molecular fields representing electronic effects such as hydrogen bonding interactions. It should also be interesting to evaluate weak attractive non-covalent interactions by MFA using the steric indicator fields described in this review article. The weak non-covalent interactions such as London dispersion effects have been recently recognized as important enantioselectivity-controlling factors in asymmetric catalysis.52 The Sigman group demonstrated that interatomic distances between probe molecules (benzene) and substrates can be used as descriptors that represent CH–π and π–π interactions in asymmetric catalysis as shown in Fig. 15 (Dπ is the distance between probe molecules and substrates).53 The indicator fields include positional information (3D coordinate), meaning the MFA using the indicator fields can consider interatomic distances. Therefore, it should be worth examining whether or not our MFA framework enables the analysis of asymmetric catalysis in which non-covalent weak attractive interactions significantly affect enantioselectivity.
Another important future task is the MFA in molecular catalysis using reaction rates (e.g., TOF [turnover frequency]) as target variables. As described in section 2.1, target variables for the regression analysis in asymmetric catalysis are the logarithms of enantiomeric ratios, which correspond to free energy differences in the pathways that lead to each isomer (Curtin–Hammett principle11). Therefore, the target variables in asymmetric catalysis are physically meaningful and high-quality values. Moreover, enantioselectivity values can be collected by single-point measurements using HPLC or GC. Thus, regression analysis in asymmetric catalysis has been recently actively investigated.1 In contrast, MFAs using reaction rates, which are important target variables for evaluating molecular catalysis, have been still scarce probably because of the difficulty of collecting training samples. To measure reaction rates such as TOF, reactions should be monitored periodically. This process is time-consuming. Moreover, catalytic reactions are typically composed of a combination of elementary reactions, such as oxidative addition and reductive elimination, while only one step (i.e., an enantio-determining step) is usually considered for the analysis in asymmetric catalysis. Although there are examples of the use of TOF/reaction rates as target variables for regression analysis in molecular catalysis,2,54 enhancing reaction rates by MFA-based data-driven catalyst design should be also tackled.
The MFA using intermediate or transition-state structures are useful analytical techniques that provide highly interpretable information on reactions, leading to the design of molecules showing improved selectivity. Analytical methods that enable the investigation of the details of molecular structures/properties (e.g., NMR and single crystal X-ray diffraction analysis) accelerate molecular science research. We have successfully controlled the complicated organic reactions, stereodivergent asymmetric synthesis, through MFA-based data-driven catalyst design as described in this review article. We expect that further trials to control challenging/complicated organic reactions by the MFA will open new avenues in the field of molecular catalysis/organic synthesis.
Conflicts of interest
There are no conflicts to declare.Acknowledgements
This work was supported by JSPS KAKENHI grants JP20H04831 (Hybrid Catalysis). The DFT calculations were performed on the RIKEN HOKUSAI supercomputer system.Notes and references
- M. S. Sigman, K. C. Harper, E. N. Bess and A. Milo, Acc. Chem. Res., 2016, 49, 1292 CrossRef CAS PubMed; C. B. Santiago, J.-Y. Guo and M. S. Sigman, Chem. Sci., 2018, 9, 2398 RSC; A. F. Zahrt, S. V. Athavale and S. E. Denmark, Chem. Rev., 2020, 120, 1620 CrossRef PubMed; T. Toyao, Z. Maeno, S. Takakusagi, T. Kamachi, I. Takigawa and K.-I. Shimizu, ACS Catal., 2020, 10, 2260 CrossRef; M. Foscato and V. R. Jensen, ACS Catal., 2020, 10, 2354 CrossRef; W. L. Williams, L. Zeng, T. Gensch, M. S. Sigman, A. G. Doyle and E. V. Anslyn, ACS Cent. Sci., 2021, 7, 1622 CrossRef PubMed.
- E. Burello, D. Farrusseng and G. Rothenberg, Adv. Synth. Catal., 2004, 346, 1844 CrossRef CAS; H. Gao, T. J. Struble, C. W. Coley, Y. Wang, W. H. Green and K. F. Jensen, ACS Cent. Sci., 2018, 4, 1465 CrossRef PubMed.
- J. A. Hueffel, T. Sperger, I. Funes-Ardoiz, J. S. Ward, K. Rissanen and F. Schoenebeck, Science, 2021, 374, 1134 CrossRef CAS PubMed.
- S. Yamaguchi and M. Sodeoka, Bull. Chem. Soc. Jpn., 2019, 92, 1701 CrossRef CAS.
- L. P. Hammett, J. Am. Chem. Soc., 1937, 59, 96 CrossRef CAS; L. P. Hammett, Chem. Rev., 1935, 17, 125 CrossRef.
- C. Hancsh, A. Leo and D. H. Hoekman, Exploring QSAR, Fundamentals and Application in Chemistry and Biology, American Chemcial Society, 1995 Search PubMed.
- R. W. Taft, J. Am. Chem. Soc., 1952, 74, 2729 CrossRef CAS; R. W. Taft, J. Am. Chem. Soc., 1952, 74, 3120 CrossRef; R. W. Taft, J. Am. Chem. Soc., 1953, 75, 4538 CrossRef.
- C. Hansch, P. P. Maloney, T. Fujita and R. M. Muir, Nature, 1962, 194, 178 CrossRef CAS; C. Hansch and T. Fujita, J. Am. Chem. Soc., 1964, 86, 1616 CrossRef.
- A. Cherkasov, E. N. Muratov, D. Fourches, A. Varnek, I. I. Baskin, M. Cronin, J. Dearden, P. Gramatica, Y. C. Martin, R. Todeschini, V. Consonni, V. E. Kuz'min, R. Cramer, R. Benigni, C. Yang, J. Rathman, L. Terfloth, J. Gasteiger, A. Richard and A. Tropsha, J. Med. Chem., 2014, 57, 4977 CrossRef CAS PubMed.
- T. Fujita and D. A. Winkler, J. Chem. Inf. Model., 2016, 56, 269 CrossRef CAS PubMed.
- J. I. Seeman, Chem. Rev., 1983, 83, 83 CrossRef CAS.
- J. J. Miller and M. S. Sigman, Angew. Chem., Int. Ed., 2008, 47, 771 CrossRef CAS PubMed.
- M. Charton, J. Am. Chem. Soc., 1969, 91, 615 CrossRef CAS; M. Charton, J. Am. Chem. Soc., 1975, 97, 1552 CrossRef; M. Charton, J. Am. Chem. Soc., 1975, 97, 3694 CrossRef.
- K. C. Harper, E. N. Bess and M. S. Sigman, Nat. Chem., 2012, 4, 366 CrossRef CAS PubMed; K. C. Harper, S. C. Vilardi and M. S. Sigman, J. Am. Chem. Soc., 2013, 135, 2482 CrossRef PubMed.
- A. Milo, E. N. Bess and M. S. Sigman, Nature, 2014, 507, 210 CrossRef CAS PubMed.
- D. T. Ahneman, J. G. Estrada, S. Lin, S. D. Dreher and A. G. Doyle, Science, 2018, 360, 186 CrossRef CAS PubMed.
- A. F. Zahrt, J. J. Henle, B. T. Rose, Y. Wang, W. T. Darrow and S. E. Denmark, Science, 2019, 363, eaau5631 CrossRef CAS PubMed.
- F. Sandfort, F. Strieth-Kalthoff, M. Kühnemund, C. Beecks and F. Glorius, Chem, 2020, 6, 1379 CAS.
- R. D. Cramer, D. E. Patterson and J. D. Bunce, J. Am. Chem. Soc., 1988, 110, 5959 CrossRef CAS PubMed.
- G. Klebe and U. Abraham, J. Comput. Aided Mol. Des., 1999, 13, 1 CrossRef CAS PubMed.
- A. J. Hopfinger, S. Wang, J. S. Tokarski, B. Jin, M. Albuquerque, P. J. Madhav and C. Duraiswami, J. Am. Chem. Soc., 1997, 119, 10509 CrossRef CAS.
- M. Pastor, G. Cruciani, I. McLay, S. Pickett and S. Clementi, J. Med. Chem., 2000, 43, 3233 CrossRef CAS PubMed.
- K. B. Lipkowitz and M. Pradhan, J. Org. Chem., 2003, 68, 4648 CrossRef CAS PubMed.
- M. C. Kozlowski, S. L. Dixon, M. Panda and G. Lauri, J. Am. Chem. Soc., 2003, 125, 6614 CrossRef CAS PubMed.
- S. Wold, M. Sjöström and L. Eriksson, Chemom. Intell. Lab., 2001, 58, 109 CrossRef CAS.
- S. Yamaguchi, CICSJ Bull., 2017, 35, 133 Search PubMed.
- R. D. Cramer, J. Med. Chem., 2003, 46, 374 CrossRef CAS PubMed.
- J. L. Melville, B. I. Andrews, B. Lygo and J. D. Hirst, Chem. Commun., 2004, 1410 RSC.
- S. E. Denmark, N. D. Gould and L. M. Wolf, J. Org. Chem., 2011, 76, 4337 CrossRef CAS PubMed.
- L. Li, Y. Pan and M. Lei, Catal. Sci. Technol., 2016, 6, 4450 RSC.
- S. Dixon Jr., K. M. Mertz Jr., G. Lauri and J. C. Ianni, J. Comput. Chem., 2005, 26, 23 CrossRef PubMed.
- J. C. Ianni, V. Annamalai, P.-W. Phuan, M. Panda and M. C. Kozlowski, Angew. Chem., Int. Ed., 2006, 45, 5502 CrossRef CAS PubMed; J. Huang, J. C. Ianni, J. E. Antoline, R. P. Hsung and M. C. Kozlowski, Org. Lett., 2006, 8, 1565 CrossRef PubMed.
- J. C. Ianni and M. C. Kozlowski, J. Mol. Catal. A: Chem., 2010, 324, 141 CrossRef PubMed.
- P. W. Phuan, J. C. Ianni and M. C. Kozlowski, J. Am. Chem. Soc., 2004, 126, 15473 CrossRef CAS PubMed.
- S. Sciabola, A. Alex, P. D. Higginson, J. C. Mitchell, M. J. Snowden and I. Morao, J. Org. Chem., 2005, 70, 9025 CrossRef CAS PubMed.
- M. Urbano-Cuadrado, J. J. Carbó, A. G. Maldonado and C. Bo, J. Chem. Inf. Model., 2007, 47, 2228 CrossRef CAS PubMed.
- S. Aguado-Ullate, L. Guasch, M. Urbano-Cuadrado, C. Bo and J. J. Carbó, Catal. Sci. Technol., 2012, 2, 1694 RSC.
- J. L. Melville, K. R. J. Lovelock, C. Wilson, B. Allbutt, E. K. Burke, B. Lygo and J. D. Hirst, J. Chem. Inf. Model., 2005, 45, 971 CrossRef CAS PubMed.
- S. Yamaguchi, T. Nishimura, Y. Hibe, M. Nagai, H. Sato and I. Johnston, J. Comput. Chem., 2017, 38, 1825 CrossRef CAS PubMed.
- R. Tibshirani, J. R. Stat. Soc. B, 1996, 58, 267 Search PubMed.
- H. Zou and T. Hastie, J. R. Stat. Soc. B, 2005, 67, 301 CrossRef.
- Y. Hamashima, K. Yagi, H. Takano, L. Tamás and M. Sodeoka, J. Am. Chem. Soc., 2002, 124, 14530 CrossRef CAS PubMed.
- M. Mukai, K. Nagao, S. Yamaguchi and H. Ohmiya, Bull. Chem. Soc. Jpn., 2022, 95, 271 CrossRef CAS.
- S. Gallarati, R. Fabregat, R. Laplaza, S. Bhattacharjee, M. D. Wodrich and C. Corminboeuf, Chem. Sci., 2021, 12, 6879 RSC.
- M. Takeda, K. Yabushita, S. Yasuda and H. Ohmiya, Chem. Commun., 2018, 54, 6776 RSC; K. Yabushita, A. Yuasa, K. Nagao and H. Ohmiya, J. Am. Chem. Soc., 2019, 141, 113 CrossRef CAS PubMed; M. Takeda, A. Mitsui, K. Nagao and H. Ohmiya, J. Am. Chem. Soc., 2019, 141, 3664 CrossRef PubMed; A. Mitsui, K. Nagao and H. Ohmiya, Org. Lett., 2020, 22, 800 CrossRef PubMed; A. Yuasa, K. Nagao and H. Ohmiya, Beilstein J. Org. Chem., 2020, 16, 185 CrossRef PubMed; Y. Kondo, K. Nagao and H. Ohmiya, Chem. Commun., 2020, 56, 7471 RSC.
- H. Chen, S. Yamaguchi, Y. Morita, H. Nakao, X. Zhai, Y. Shimizu, H. Mitsunuma and M. Kanai, Cell Rep. Phys. Sci., 2021, 2, 100679 CrossRef CAS.
- E. N. Jacobsen, A. Pfaltz and H. Yamamoto, Comprehensive Asymmetric Catalysis, Springer, 1999 CrossRef CAS PubMed; S. Krautwald and E. M. Carreira, J. Am. Chem. Soc., 2017, 139, 5627–5639 CrossRef CAS PubMed.
- The corresponding Pd/B hybrid catalysis that affords a linear product, see: T. Fujita, T. Yamamoto, Y. Morita, H. Chen, Y. Shimizu and M. Kanai, J. Am. Chem. Soc., 2018, 140, 5899 CrossRef CAS PubMed.
- J. F. Hartwig and L. M. Stanley, Acc. Chem. Res., 2010, 43, 1461 CrossRef CAS PubMed; T. Ohmura and J. F. Hartwig, J. Am. Chem. Soc., 2002, 124, 15164 CrossRef PubMed; B. Bartels, C. Garcia-Yebra and G. Helmchen, Eur. J. Org. Chem., 2003, 1097 CrossRef; Q. Cheng, H.-F. Tu, C. Zheng, J.-P. Qu, G. Helmchen and S.-L. You, Chem. Rev., 2019, 119, 1855 CrossRef PubMed.
- J. J. Henle, A. F. Zahrt, B. T. Rose, W. T. Darrow, Y. Wang and S. E. Denmark, J. Am. Chem. Soc., 2020, 142, 11578 CrossRef CAS PubMed.
- A. Golbraikh and A. Tropsha, J. Mol. Graphics Modell., 2002, 20, 269 CrossRef CAS PubMed; D. L. J. Alexander, A. Tropsha and D. A. Winkler, J. Chem. Inf. Model., 2015, 55, 1316 CrossRef PubMed.
- J. P. Wagner and P. R. Schreiner, Angew. Chem., Int. Ed., 2015, 54, 12274 CrossRef CAS PubMed; A. J. Neel, M. J. Hilton, M. S. Sigman and F. D. Toste, Nature, 2017, 543, 637 CrossRef PubMed.
- M. Orlandi, J. A. S. Coelho, M. J. Hilton, F. D. Toste and M. S. Sigman, J. Am. Chem. Soc., 2017, 139, 6803 CrossRef CAS PubMed.
- B. C. Haas, A. E. Goetz, A. Bahamonde, J. C. McWilliams and M. S. Sigman, Proc. Natl. Acad. Sci. U. S. A., 2022, 119, e2118451119 CrossRef CAS PubMed; M. A. B. Ferreira, J. D. J. Silva, S. Grosslight, A. Fedorov, M. S. Sigman and C. Copéret, J. Am. Chem. Soc., 2019, 141, 10788 CrossRef PubMed; V. Mougel, C. B. Santiago, P. A. Zhizhko, E. N. Bess, J. Varga, G. Frater, M. S. Sigman and C. Copeŕet, J. Am. Chem. Soc., 2015, 137, 6699 CrossRef PubMed.
| This journal is © The Royal Society of Chemistry 2022 |


