Dependence of electromagnetic interference shielding ability of conductive polymer composite foams with hydrophobic properties on cellular structure†
Biao
Zhao
 abc,
Ruoming
Wang
a,
Yang
Li
d,
Yumei
Ren
a,
Xiao
Li
b,
Xiaoqin
Guo
*a,
Rui
Zhang
 ad and
Chul B.
Park
 *c
*c
aHenan Key Laboratory of Aeronautical Materials and Application Technology, School of Material Science and Engineering, Zhengzhou University of Aeronautics, Zhengzhou, Henan 450046, P. R. China. E-mail: guoxq@zua.edu.cn
bLaboratory of Advanced Materials, Department of Materials Science, Collaborative Innovation Center of Chemistry for Energy Materials, Fudan University, Shanghai 200438, China
cMicrocellular Plastics Manufacturing Laboratory, Department of Mechanical and Industrial Engineering, University of Toronto, 5 King's College Road, Toronto M5S 3G8, Canada. E-mail: park@mie.utoronto.ca; Fax: +1-416-978-0947; Tel: +1-416-978-3053
dSchool of Material Science and Engineering, Zhengzhou University, Zhengzhou, Henan 450001, P. R. China
First published on 16th April 2020
Abstract
The introduction of a cellular structure in conductive polymer composites is supposed to be an effective way to ameliorate the electromagnetic interference (EMI) shielding properties. Moreover, the wetting behavior should be taken into consideration when exposed to a moist environment. Herein, oleophilic conductive poly(vinylidene fluoride) (PVDF)/multiwall nanotube (MWCNT) composite foams were successfully fabricated through a simple and effective batch foaming process. PVDF/MWCNT nanocomposite foams with various microcellular structures were obtained by controlling the foaming parameters (MWCNT content and impregnation temperature). The electrical conductivity (EC) and EMI shielding properties critically depended on their microcellular structure. Interestingly, the EC and EMI shielding properties declined with a higher degree of foaming in the range of 37–67% for PVDF/1 wt% MWCNT (FC1) and PVDF/2 wt% MWCNT (FC2) nanocomposite foams. Conversely, for the PVDF/5 wt% MWCNT (FC5) and PVDF/8 wt% MWCNT (FC8) nanocomposite foams, the EC and EMI shielding properties gradually increased with an increased degree of foaming in the range of 27–40 wt%. The optimal EMI shielding properties of PVDF-based nanocomposite foams containing MWCNT contents of 1 wt%, 2 wt%, 5 wt% and 8 wt% reached 18.6 dB, 31.5 dB, 88.3 dB and 132.6 dB, respectively, at a sample thickness of 4.0 mm. Analysis of the EMI shielding mechanism found that absorption resulting from multiple reflections and scattering, and strong conduction band polarization loss were the main contributing factors. Superior water repellency and high stability under wet conditions were also observed. For example, an FC5 foam sample with a void fraction of 39.4% displayed an average water contact angle of 113.6° and an average methyl-silicone oil contact angle of 10.5°. Thus, the PVDF/MWCNT foams could be a competitive candidate for EMI shielding and oil/water separation multi-functional applications.
1. Introduction
The electromagnetic wave facilitates our daily life, for example the Kα-band (26.5–40 GHz) with various strategic applications such as cellular and satellite communications, and antenna measurements, including everyday communication and sensing applications.1–4 However, due to the fast progress of electronic devices and communication equipment, serious EMI problems inevitably occur, which adversely affect the function of nearby precious electronic devices and cause the disclosure of information.5–8 Moreover, EM pollution inevitably has a negative effect on human beings.9,10 To address this issue, we need to explore advanced EMI shielding materials in order to eliminate or reduce EM pollution.11–13 In general, when an EM wave encounters a material, it will experience reflection, absorption and transmission. EMI shielding materials block EM waves through reflection or absorption. In a homogeneous system, through the interaction of the irradiation with dipoles, free carriers, defects or impurities, EM waves will be attenuated by means of the corresponding polarization, conductive losses and scattering. Furthermore, in heterostructure systems, the existence of interfaces between various phases would cause additional dissipation of the EM waves. Poor impedance matching between individual components accounts for such interfacial scattering. In multiple media, multiple scattering mechanisms are responsible for the EM shielding, resulting in the dissipation of EM waves.14–16In general, metals and graphite, as conventional EMI blocking materials, possess strong EMI blocking capability, but the EMI shielding mechanism is mainly dominated by reflection.17–19 However, the reflection would cause secondary EMI pollution, and absorption-dominant shielding materials are necessary. Carbonaceous media, such as graphene and carbon nanotubes (CNTs), possessing outstanding properties as a result of a high aspect ratio and a high specific surface area, are highly effective as conductive fillers to fabricate EMI blocking composites, and will generate an electric network in the polymer substrate. At the same time, high conductivity and strong interface polarization will promote the EMI blocking properties.20,21 In particular, CNTs have emerged as highly promising materials for EMI shielding applications due to their excellent corrosion resistance, EC and easy processability.22–24 Although such polymer/carbon nanotube composites with conductive filler dispersed in polymer particles play a role in absorbing and converting electromagnetic waves to heat, thus giving rise to mainly an absorption blocking mechanism, further opportunities to increase dissipation and reduce the weight of composites are very difficult to find.25
Porous conductive composite polymers could simultaneously have both stronger EM absorption and light weight. The result is that cellular structures offer an effective route to enhance EM wave shielding capability, owing to inner multiple scattering and EM field-induced currents that occur in walls and/or struts of pores.26,27 Additionally, the lightweight nature of the materials tallies with sustainable development on account of the savings of material and energy, and is especially favorable for practical EMI shielding application in aircraft and spacecraft fields.22,28,29 For example, Yang et al. first used chemical foaming to fabricate a CNT/polystyrene composite foam, and the resultant foam with a density of 0.56 g cm−3 displayed effective EMI shielding of 19 dB at 7 wt% CNT loading.30 Chen et al.25 reported that supercritical carbon dioxide foaming was utilized to prepare a polystyrene/MWCNT composite foam with segregated conductive networks. The composite foam exhibited an ultra-low percolation threshold of 0.07 vol%, excellent EC of 8.05 S m−1 and an EMI SE of 23.2 dB. Zhang et al.31 fabricated microcellular epoxy/MWCNT composite foams by a batch foaming process with supercritical carbon dioxide and investigated their EMI shielding performance. The results revealed that the absorption was increased from 59.5% for solid composites to 79.5% for composite foams at 3 wt% MWCNT content. Kuang et al.32 fabricated poly(L-lactic acid)-MWCNT nanocomposite foams using supercritical CO2 foaming. The nanocomposite foams had the features of low-density (∼0.3 g cm−3), low thickness (∼2.5 mm) and high conductivity (∼3.4 S m−1) as well as a high EMI shielding performance of ∼23 dB.
According to the mentioned literature, it can be deduced that the cellular structure significantly affected the EC, the EMI shielding properties and the shielding mechanism. Unfortunately, studies of the relationships amongst the EC, the EMI shielding properties and the degree of foaming of conductive polymer/MWCNT foams have rarely been reported. Particularly, the contradictory conclusions that the addition of a cellular structure could enhance or decrease the EC (and/or EMI shielding) have been reported, which would confuse the readers. For example, Shen et al.33 introduced a microcellular structure into a graphene system to improve the EMI shielding properties (∼26.3 dB), but a reduced electrical conductivity was observed. Ameli et al.34 injection molded polypropylene/carbon fiber composite foams to demonstrate the reduction of the percolation threshold from 8.5 to 7 vol% carbon fiber with foaming, while enhancing the through-plane conductivity and the specific EMI SE up to 65%. Zhang et al.35 prepared microcellular PMMA composite foams by supercritical fluid processing with two nanofillers, MWCNTs and GNPs, having different dimensions. An interesting bimodal cellular structure was found to yield enhanced electrical conductivity and EMI shielding performance. How to design materials with the target EC and EMI shielding properties through the degree of foaming is still an enormous challenge. Moreover, the surface wetting condition of EMI shielding materials should be considered when applied in a moist environment.
There have been numerous reports about the effect of wettability on the EMI shielding properties of materials. For instance, Liu et al.28 fabricated a freestanding, flexible and hydrophobic MXene foam, which can effectively retain the stability and reliability of the EMI shielding properties when applied in moist or wet environments. Choi et al.36 prepared Al (3 wt%)-doped ZnO (AZO)/Ag/AZO multilayer films with excellent EMI shielding ability, hydrophobicity and strong antibacterial activity against Escherichia coli and Staphylococcus aureus. Raagulan et al.37 fabricated a MXene-graphene foam material that showed hydrophobicity with a higher contact angle of 126°, an excellent conductivity of 13.68 S cm−1 and an EMI shielding of 53.8 dB. The wettability became a crucial issue for the EMI shielding materials.
In this work, a batch foaming approach is demonstrated for fabricating highly conductive and hydrophobic PVDF/MWCNT nanocomposite foams with exceptional EMI shielding behavior. The influence of the degree of foaming on the EC and EMI shielding properties of the PVDF/MWCNT (various MWCNT contents) nanocomposite foams was studied in detail. The results show that composite foams with the features of light weight (high degree of foaming), low EC and feeble EMI shielding properties at a low MWCNT content can be easily obtained. At high MWCNT loadings, the composite foams had the characteristics of superior EMI shielding properties, high EC and relatively high density (low degree of foaming). Furthermore, PVDF/MWCNT foams are hydrophobic with a water contact angle above 100°, which prevents the degradation of the composite foams in high humidity environments while retaining satisfactory EMI shielding.
2. Experimental section
Fabrication of the PVDF/MWCNT composite foams
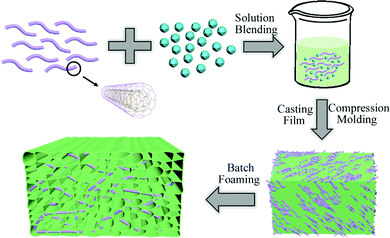
The information on the raw materials is provided in the ESI.†Fig. 1 shows a schematic illustration for the PVDF/MWCNT nanocomposite foam fabrication procedure. In order to prepare composite foams, a three-step approach was adopted composed of solvent blending, casting and compression molding, and batch foaming. First, the unfoamed PVDF/MWCNT nanocomposite was fabricated according to the previously reported fabrication procedure for PVDF-based nanocomposites.38,39 Typically, PVDF particles and MWCNT nanomaterial powder were added to DMF solvent. Secondly, the solid PVDF/MWCNT nanocomposite was obtained by film casting and compression molding. Subsequently, a self-regulating batch foaming equipment was used to investigate the PVDF/MWCNT nanocomposite samples’ foaming behavior. The foaming system (Fig. S1, ESI†) was composed of a syringe pump filled with CO2, a foaming cavity with thermocouples, along with a heater and a pressure reducing valve. The polymer matrix composite was positioned in the cavity, which was pressurized at 2000 psi (13.8 MPa) to impregnate CO2 for 1 h at the set temperature. The pressure was then quickly released and the chamber was cooled with ice water. Foaming temperatures were focused in the range from 169 °C to 172 °C.40,41 The mass fraction of MWCNTs contained in the foam, 1%, 2%, 5% and 8%, obtained at various impregnation temperatures (T/°C, from 169 °C to 172 °C) were denoted as FC1-1 to FC1-7, FC2-1 to FC2-7, FC5-1 to FC5-7 and FC8-1 to FC8-7, respectively, as shown in Table 1.| VF | T (°C) | ||||||
|---|---|---|---|---|---|---|---|
| MWCNT | 169 °C | 169.5 °C | 170 °C | 170.5 °C | 171 °C | 171.5 °C | 172 °C |
| 1 wt% MWCNT | FC1-1 37.9% | FC1-2 43.2% | FC1-3 56.7% | FC1-4 59.3% | FC1-5 64.7% | FC1-6 51.4% | FC1-7 47.6% |
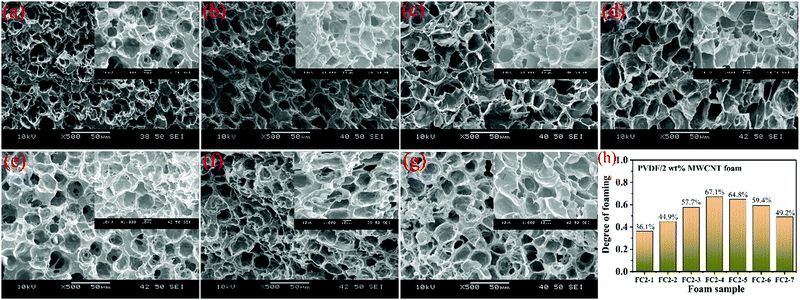
| 2 wt% MWCNT | FC2-1 36.1% | FC2-2 44.9% | FC2-3 57.7% | FC2-4 67.1% | FC2-5 64.8% | FC2-6 59.4% | FC2-7 49.2% |
| 5 wt% MWCNT | FC5-1 28.0% | FC5-2 28.4% | FC5-3 31.6% | FC5-4 33.4% | FC5-5 39.5% | FC5-6 34.4% | FC5-7 29.5% |
| 8 wt% MWCNT | FC8-1 27.2% | FC8-2 28.6% | FC8-3 34.0% | FC8-4 35.1% | FC8-5 38.4% | FC8-6 39.3% | FC8-7 31.5% |
Wetting behavior of the PVDF/MWCNT composite foams
Contact angle measurements were conducted directly on the PVDF/MWCNT composite foams at room temperature. The data were collected by using OCA20 (Dataphysics). First, the PVDF/MWCNT foams were cut into 1.5 cm × 1.5 cm × 10 mm pieces and immersed in methyl-silicone oil (5 mL) and deionized water (5 mL) for 30 min. Then, the samples were removed from the liquids and their wettability was determined by measuring the volume change of the liquid or the mass change of the sample.3. Results and discussion
3.1. Characterization of PVDF/MWCNT nanocomposite foams
To get information about how the MWCNT content and the impregnation temperature influence the cells’ morphological development, a series of control experiments was carried out. Fig. 2, 3 and Fig. S2 S3 (ESI†) display the microcellular shapes and the degree of foaming of various PVDF/MWCNT nanocomposite foams. For FC1 foams (Fig. S2, ESI†), FC2 foams (Fig. 2), FC5 foams (Fig. S3, ESI†) and FC8 foams (Fig. 3), the degree of foaming gradually increased and then deceased with gradually increasing impregnation temperature. Interestingly, at low MWCNT contents (1 wt% and 2 wt%), a uniform microcellular structure could be observed (Fig. 2 and Fig. S2, ESI†). However, the presence of non-uniform cells was evident in the PVDF composite foams with high MWCNT contents (5 wt% and 8 wt%, Fig. S3, ESI† and Fig. 3), which might result from the uneven distribution of MWCNTs in the polymer at high MWCNT content. It is believed that these changes in the cellular morphology with the foaming temperature resulted from the variations in the crystal structure of the PVDF matrix that had been treated at different impregnation temperatures.42,43 Expectedly, as the impregnation temperature increased, the polymer viscosity and the resistance to microcellular growth decreased. At the same time, the diffusivity of CO2 in the polymer was enhanced.44 Additionally, an increase in the temperature of foaming would reduce the solubility of CO2 in the polymer materials.45 Moreover, when the saturated temperature increased, it was advantageous to release CO2via the surface of the foam.46,47 As a result, the degree of foaming first increased and then decreased with increased impregnation temperature.47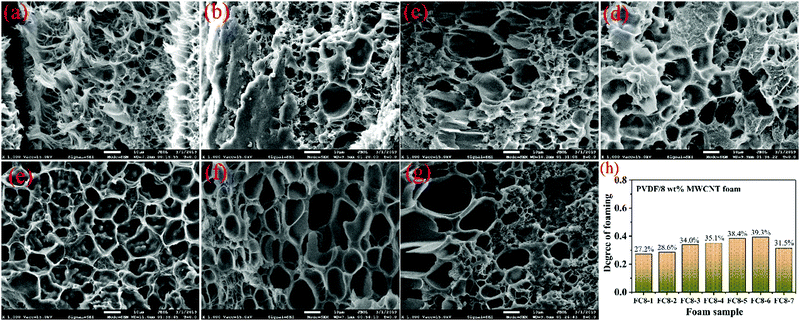 | ||
| Fig. 3 SEM images of the cryo-fractured FC8 nanocomposite foams: (a) FC8-1, (b) FC8-2, (c) FC8-3, (d) FC8-4, (e) FC8-5, (f) FC8-6 and (g) FC8-7 samples. (h) Various FC8 foams’ degree of foaming. | ||
To obtain more information about the microstructure of the PVDF/MWCNT foams, more characterization techniques were performed taking FC2 foams as an example. Fig. S4 (ESI†) shows the XRD curves of the FC2 nanocomposite foams that were prepared at various impregnation temperatures. The typical diffraction peaks were observed at 2θ ∼ 17.5°, ∼18.2°, ∼19.9° and ∼26.4°, which are attributed to the reflection planes of (100), (020), (110) and (021) that correspond to the non-polar α-phase polymorph,48 which is similar with our previous reports.39,40 Furthermore, the existence of another peak at 20.1° could be observed, which was associated with the β-crystalline phase of PVDF.49 According to the unusual spectrum, it can be easily seen that the crystal morphology of PVDF polymer was related to the addition of MWCNTs. The polar β phase was desirable because this phase would provide higher dielectric properties, which could improve the microwave dissipation properties.50 Fig. S5 (ESI†) shows the FTIR spectra of various PVDF/2 wt% MWCNT nanocomposite foams. It can be noted that the presence of both α-phase and β-phase could be found in the FC2 nanocomposite foams. The existence of peaks at 766 cm−1, 795 cm−1 and 975 cm−1 could be assigned to α-phase, and the peaks at 840 cm−1, 872 cm−1 and 1274 cm−1 were related to the β-phase.51 The band located at 1403 cm−1 was related to a deformation vibration of CH2, and the band positioned at 1070 cm−1 was the result of CF2 stretching vibration.52 Based on the FTIR spectra, it can be deduced that the introduction of MWCNT gave rise to PVDF's crystal transformation from the α-phase to the β-phase, which corresponded with the result of XRD measurement (Fig. S4, ESI†).
3.2. The EC properties of PVDF/MWCNT composites
In general, the EMI shielding properties of materials are closely associated with their EC, and the EC is related to the microstructure.53,54 Numerous studies have demonstrated that the introduction of a microcellular structure could influence the EC of polymer/CNT nanocomposites.32,55,56 Contradictory conclusions that the addition of a cellular structure could enhance or decrease the EC can be found, which would confuse readers. Fig. 4 displays the relation between the EC and the degree of foaming for various PVDF/MWCNT nanocomposite foams. Interestingly, the EC of FC1 and FC2 declined as the degree of foaming increased in the range of 37–67% (Fig. 4a). It is believed that the connections made by affinity of the MWCNT fillers may be broken with the foaming action, thus decreasing the EC, which results from the fact that the high cell-to-cell pressure force would cause adjacent MWCNTs to separate far away from each other.57 Conversely, the variation of EC was wide for FC5 and FC8 nanocomposite foams, and the tendency of EC variation was different. In the foaming degree range of 27–40 wt%, the EC gradually increased with an increased degree of foaming, which can be observed in Fig. 4b. The reason is that the feeble force between cells plays a negligible role in separating MWCNTs at a lower degree of foaming. Generally, EC in polymer nanocomposites can occur either via direct “contacts” between the conductive fillers or “tunneling” of electrons between sufficiently close conductive particles.58 In the former case, the conductive fillers physically connect with one another to produce a conductive network and the electrons can transport like in a typical inherently conducting material. However, in the “tunneling” model, the electrons can literally tunnel between two sufficiently close conductive fillers, which can be separated by a film of macromolecular polymer material.59 For the FC5 and FC8 nanocomposite foams with a relatively low degree of foaming, the very close distance between adjacent MWCNTs contributes to the EC. Based on the above results, it can be concluded that the EC increased with an increased degree of foaming below a critical value (40 wt%); whereas, when the degree of foaming was higher than 40%, the EC declined with an increased degree of foaming. Thus, the tendency of EC to decline would flatten, and it could be effectively tuned by controlling the degree of foaming. Decreasing the EC plays a negative role in EMI shielding properties because the performance is proportional to the EC.60 However, the uniquely porous structure of foams can neutralize the effects of the decreased EC.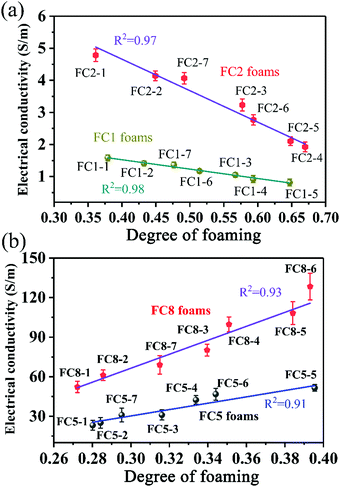 | ||
| Fig. 4 The relationship of EC and degree of foaming for (a) FC1 foams and FC2 foams, and for (b) FC5 foams and FC8 foams. | ||
3.3. EMI shielding performance of PVDF/MWCNT materials
The EMI shielding effectiveness (SE or SET) represents the capability to protect electronic devices from irradiation by EM waves. The EMI SE of various PVDF/MWCNT nanocomposite foams with a thickness of 4.0 mm and with varied degrees of foaming was measured in the frequency range of 26.5–40 GHz, as shown in Fig. 5. Notably, the EMI SE was independent of the frequency and decreased gradually with an increased degree of foaming for FC1 (Fig. 5a) and FC2 foams (Fig. 5b), whereas it increased slowly with an increased degree of foaming for FC5 (Fig. 5c) and FC8 foams (Fig. 5d). The optimal average EMI SE reached 18.6 dB, 31.5 dB, 88.3 dB and 132.6 dB as the MWCNT content rose to 1 wt%, 2 wt%, 5 wt% and 8 wt%, respectively, resulting from the fact that an enhanced conductive network makes a great contribution to enhancing microwave blocking capability. For FC8 foams, the SET of the FC8-2 composite foam had a higher value than that of the FC8-1 composite foam, and further reached a maximal value of 132.6 dB for FC8-6 composite foams, which clearly demonstrates that the optimal microcellular structure with a suitable degree of foaming could effectively boost EMI shielding properties.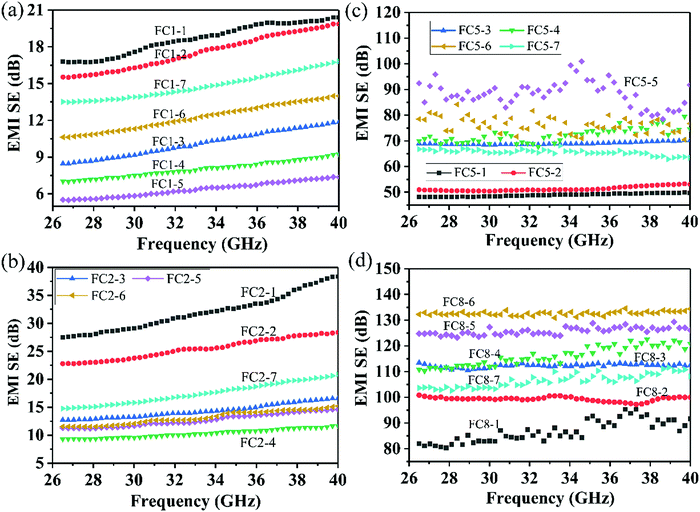 | ||
| Fig. 5 EMI blocking abilities of various PVDF/MWCNT nanocomposites: (a) FC1 foams, (b) FC2 foams, (c) FC5 foams, and (d) FC8 foams. | ||
Roughly, shielding mechanisms mainly consist of absorption, reflection and transmission, which are correlated to the mobile charge carriers, electric dipoles and surfaces/interfaces. Reflection, principally relying on the impedance mismatch between air and the shielding material, is the primary mechanism that takes place when EM waves encounter the top surface of a shielding material.61 When the mismatch of EC between air and shielding material is increased, the capacity to reflect EM waves increases. The remaining EM waves would penetrate into the blocking sample, and a small amount of the EM waves could be attenuated as thermal energy by the Joule effect. Furthermore, multiple reflections would also cause the dissipation of EM energy. Theoretically, multiple reflections can always be neglected when the total shielding is over 15 dB.20
To investigate the EMI blocking mechanism of the PVDF/MWCNT nanocomposite foams, their average reflection (SER) and absorption (SEA) were calculated, based on eqn (S3)–(S6) in the ESI† and they are plotted in Fig. 6. In general, the SER is determined by the EC and impedance mismatch between air and the material. The SEA is closely related to the dielectric constant, the sample thickness and magnetic performance.62,63 It can be noted that the SEA was greatly boosted with increasing EC tuned by the degree of foaming, while the SER remained nearly constant in the foamed composites. For instance, for PVDF/5 wt% MWCNT foams (Fig. 6c), the SER, SEA and SET values of the FC5-1 foam were 2.9 dB, 46.0 dB and 48.9 dB, respectively. With increasing degree of foaming (namely, increasing EC), both SET and SEA values significantly increased, and the FC5-5 foam exhibited the highest EMI shielding properties. The SEA and SER of the FC5-5 foam were 82.2 dB and 6.1 dB, respectively. The absorption value was much higher than the reflection value, which indicates that the nanocomposite foams possess an absorption-dominated EMI shielding feature. Intensive studies show that EMI shielding properties are associated with the material thickness.9 Taking PVDF/2 wt% MWCNT foams as an example, Fig. S6 (ESI†) displays the thickness dependence of the EMI shielding properties of the FC2-1 foam (28.0% degree of foaming). The total SET was boosted with an increased specimen thickness, and a noticeable increase in the EMI shielding property was found from 12.5 dB to 30.2 dB at 26.5 GHz and 13.2 dB to 39.6 dB at 40 GHz as the sample thickness increased from 3.0 mm to 6.0 mm. A detailed analysis of the contributions of the mean SEA and SER to the SET as a function of the sample thickness in Fig. S6b (ESI†) further indicates that absorption was the main contribution to the shielding mechanism. Notably, the SEA improved as the thickness increased, but the SER remained almost constant. In short, the increased EMI shielding property was primarily arising from the increased SEA.
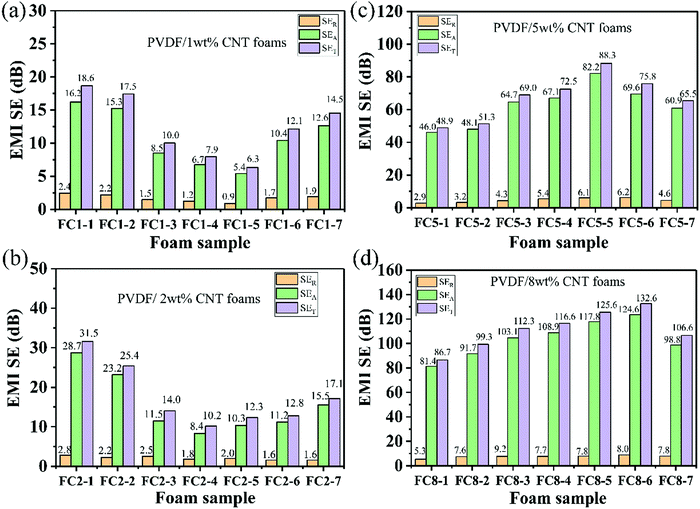 | ||
| Fig. 6 Average SER, SEA and SET values of various PVDF/MWCNT nanocomposite foams: (a) FC1 foams, (b) FC2 foams, (c) FC5 foams and (d) FC8 foams. | ||
From the above results, it can be noted that the cellular microstructure can effectively adjust the EC, further affecting the EMI shielding performance. To directly show the relationship between the degree of foaming and the EMI shielding properties, the average EMI SET values are plotted as a function of the degree of foaming in Fig. 7. It is well accepted that the EMI shielding properties are nearly linearly correlated to the EC.28,63,64 In Fig. 4, it can be noted that the EC was nearly linearly related to the degree of foaming. Expectedly, the EMI shielding properties are closely correlated to the degree of foaming. Similarly, for FC1 and FC2 foams with a relatively high foaming degree of 37–67%, the EMI shielding properties quickly declined with a large slope with an increased degree of foaming (Fig. 7a). When the degree of foaming was below the critical value (40%), the average EMI shielding properties of FC5 and FC8 foams slowly increased with a low slope (Fig. 7b) with an increasing degree of foaming. This phenomenon is in good accordance with the trend of variation of EC (Fig. 4). To give a guide for designing desired EC and EMI shielding properties by tuning the foaming degree of nanocomposite foams, the EC and EMI shielding properties were plotted as a function of the degree of foaming. The two-contour illustration of the relationship amongst the EC, the EMI SE and the degree of foaming is shown in Fig. 8. Based on this figure, the design of EMI shielding PVDF/MWCNT nanocomposite foams can be controlled by tuning the degree of foaming. At low MWCNT contents (Fig. 8a), composite foams with the features of light weight (a high degree of foaming), a low EC and feeble EMI shielding properties were obtained. At high MWCNT levels (Fig. 8b), composite foams possessing the characteristics of superior EMI shielding properties, a high EC and a relatively high density (a low degree of foaming) were easily obtained.
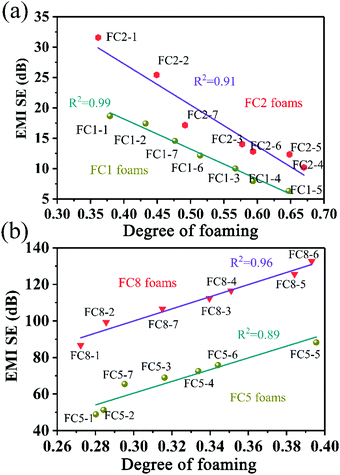 | ||
| Fig. 7 The correlation between the mean SET values and the degree of foaming for: (a) FC1 and FC2 foams, and (b) FC5 and FC8 foams. | ||
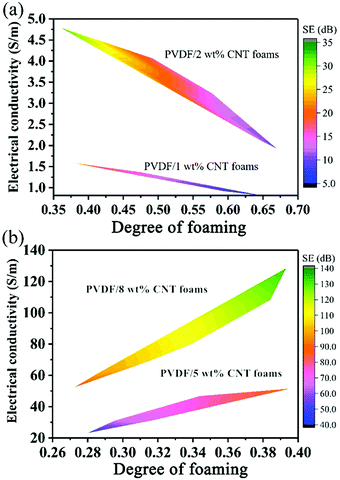 | ||
| Fig. 8 The relationship amongst the EC, the EMI shielding property and the degree of foaming for (a) FC1 and FC2 foams, and for (b) FC5 and FC8 foams. | ||
Fig. 9 schematically depicts the microwave propagation across the foamed PVDF/MWCNT composites and the corresponding main shielding mechanism. Briefly, when the incident EM microwaves strike the surface of the composite foam, less reflection occurs and most EM waves enter the composite foam. Then, when the EM waves strike the cells and CNT nanotubes, multi-reflections make it difficult for EMI waves to escape from the nanocomposite foams until dissipated and converted into thermal energy.29,65 Furthermore, the incident EM microwaves are scattered and reflected numerous times inside the foam to dissipate the EM energy because of the existence of the cells.66,67 The conductive MWCNTs acted as the backbone to offer migration and hopping paths and to ensure fast electron transportation. When the EM wave propagates into the absorber surface, numerous electrons in the MWCNT can migrate along the axial direction or hop. The special intertwined architecture could build up a 3D conductive network, favoring the formation of interfacial polarization and conduction loss.68 The Maxwell–Wagner effect refers to interfacial polarization, which is responsible for capturing movable charges between the interfaces of an insulator or a conductor.15,69 Because of the existence of numerous interphases involving the material, such as MWCNT–PVDF and MWCNT–air, the interface polarization caused by the EM waves plays an important role in EM dissipation. In brief, the microcellular structure in the PVDF foams is beneficial for EMI shielding.
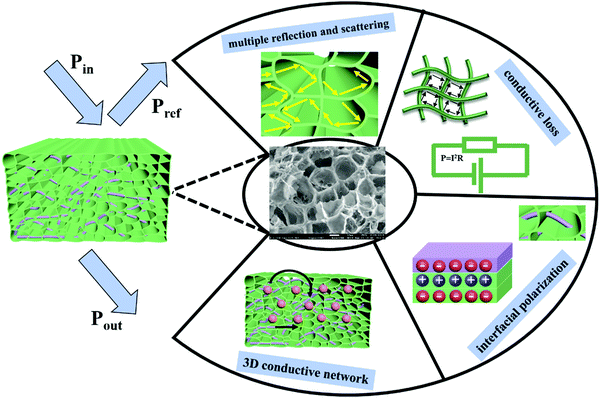 | ||
| Fig. 9 Schematic illustration of EM wave transmission across the PVDF/MWCNT nanocomposite foams and its related shielding mechanism. | ||
3.4. Wetting behavior of the PVDF/MWCNT nanocomposite foams
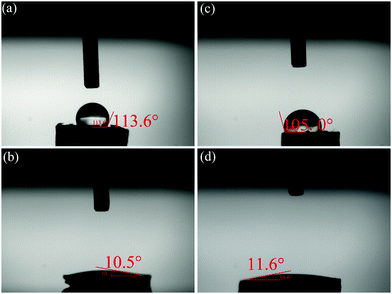
In practical applications, a hydrophobic characteristic is required for novel EMI shielding materials because it can protect the electronic devices from corrosion by moisture in a wet environment.53,70,71 Due to the naturally hydrophobic nature of pristine PVDF and CNTs, as well as the cellular structure, the PVDF/MWCNT nanocomposite foams are highly hydrophobic. Thus, the EC and EMI shielding properties can be retained under moist conditions. Expectedly, as displayed in Fig. 10a and c, the FC5-5 and FC8-6 nanocomposite foams have an average water contact angle of 113.6° and 105°, respectively, while the average methyl-silicone oil contact angles are 10.5° and 11.6° (Fig. 10b and d), respectively, revealing typical hydrophilic characteristics. The measured methyl-silicone oil contact angle of below 12° suggests superior water repellency and stability under wet conditions as well as oleophilic performance. Movie S1 (ESI†) shows the procedure of extraction of methyl-silicone oil on the surface of the FC5-5 foam used in water for oil adsorption. Thus, the EMI shielding PVDF/MWCNT foam is also a promising candidate for oil/water separation. These results indicate that the nanocomposite foams satisfy the requirement of EMI shielding materials in a moist environment.4. Conclusions
In summary, a simple batch foaming approach was used to successfully fabricate PVDF/WMCNT nanocomposite foams. The PVDF/MWCNT foams with various degrees of foaming were obtained by controlling the impregnation temperature and MWCNT content. The incorporation of a cellular structure into the PVDF/WMCNT composites could effectively tune their EC and EMI shielding properties. For FC1 and FC2 foams with a relatively high foaming degree of 37–67%, the EC and EMI shielding properties declined with a large slope with an increased degree of foaming. When the degree of foaming was below the critical value of 40%, the EC and EMI shielding properties of FC5 and FC8 foams slowly increased with a low slope. The strongest EMI shielding performance with the SET value of 132.6 dB was obtained for the FC8-6 composite foam with a sample thickness of 4.0 mm. In short, the outstanding result of EMI blocking was attributed to the absorption mechanisms, such as multiple reflections and scattering by the porous structure, interfacial polarization, conductive loss, etc. Moreover, the PVDF/MWCNT foams were hydrophobic, indicating that these PVDF/MWCNT foams can be expected to be used in multi-functional applications including EMI shielding and oil/water separation.Conflicts of interest
The authors declare no conflict of interest.Acknowledgements
The authors appreciate the financial support from the National Natural Science Foundation of China (51802289), Key Science and Technology Program of Henan Province (182102210108), and China Postdoctoral Science Foundation (2019M661352).References
- Q. Liu, Q. Cao, H. Bi, C. Liang, K. Yuan, W. She, Y. Yang and R. Che, Adv. Mater., 2016, 28, 486–490 CrossRef CAS PubMed.
- H. Lv, Z. Yang, P. L. Wang, G. Ji, J. Song, L. Zheng, H. Zeng and Z. J. Xu, Adv. Mater., 2018, 30, 1706343 CrossRef PubMed.
- X.-J. Zhang, J.-Q. Zhu, P.-G. Yin, A.-P. Guo, A.-P. Huang, L. Guo and G.-S. Wang, Adv. Funct. Mater., 2018, 28, 1800761 CrossRef.
- W. Xu, G.-S. Wang and P.-G. Yin, Carbon, 2018, 139, 759–767 CrossRef CAS.
- B. Zhao, G. Shao, B. Fan, W. Zhao, Y. Xie and R. Zhang, J. Mater. Chem. A, 2015, 3, 10345–10352 RSC.
- Z. Wu, K. Pei, L. Xing, X. Yu, W. You and R. Che, Adv. Funct. Mater., 2019, 29, 1901448 CrossRef.
- N. Gao, W.-P. Li, W.-S. Wang, D.-P. Liu, Y.-M. Cui, L. Guo and G.-S. Wang, ACS Appl. Mater. Interfaces, 2020, 12, 14416–14424 CrossRef CAS PubMed.
- S. Gao, S.-H. Yang, H.-Y. Wang, G.-S. Wang and P.-G. Yin, Carbon, 2020, 162, 438–444 CrossRef CAS.
- Q. Song, F. Ye, X. Yin, W. Li, H. Li, Y. Liu, K. Li, K. Xie, X. Li, Q. Fu, L. Cheng, L. Zhang and B. Wei, Adv. Mater., 2017, 29, 1701583 CrossRef PubMed.
- B. Zhao, X. Guo, W. Zhao, J. Deng, G. Shao, B. Fan, Z. Bai and R. Zhang, ACS Appl. Mater. Interfaces, 2016, 8, 28917–28925 CrossRef CAS PubMed.
- R. C. Che, L. M. Peng, X. F. Duan, Q. Chen and X. L. Liang, Adv. Mater., 2004, 16, 401–405 CrossRef CAS.
- H. Sun, R. Che, X. You, Y. Jiang, Z. Yang, J. Deng, L. Qiu and H. Peng, Adv. Mater., 2014, 26, 8120–8125 CrossRef CAS PubMed.
- J. Liu, R. Che, H. Chen, F. Zhang, F. Xia, Q. Wu and M. Wang, Small, 2012, 8, 1214–1221 CrossRef CAS PubMed.
- J.-Z. He, X.-X. Wang, Y.-L. Zhang and M.-S. Cao, J. Mater. Chem. C, 2016, 4, 7130–7140 RSC.
- H. Lv, Y. Guo, G. Wu, G. Ji, Y. Zhao and Z. J. Xu, ACS Appl. Mater. Interfaces, 2017, 9, 5660–5668 CrossRef CAS PubMed.
- F. Ye, Q. Song, Z. Zhang, W. Li, S. Zhang, X. Yin, Y. Zhou, H. Tao, Y. Liu, L. Cheng, L. Zhang and H. Li, Adv. Funct. Mater., 2018, 28, 1707205 CrossRef.
- M. H. Al-Saleh, W. H. Saadeh and U. Sundararaj, Carbon, 2013, 60, 146–156 CrossRef CAS.
- M. Han, X. Yin, K. Hantanasirisakul, X. Li, A. Iqbal, C. B. Hatter, B. Anasori, C. M. Koo, T. Torita, Y. Soda, L. Zhang, L. Cheng and Y. Gogotsi, Adv. Opt. Mater., 2019, 7, 1900267 CrossRef.
- D. D. L. Chung, Carbon, 2001, 39, 279–285 CrossRef CAS.
- D. X. Yan, H. Pang, B. Li, R. Vajtai, L. Xu, P. G. Ren, J. H. Wang and Z. M. Li, Adv. Funct. Mater., 2015, 25, 559–566 CrossRef CAS.
- G. Wang, Z. Gao, S. Tang, C. Chen, F. Duan, S. Zhao, S. Lin, Y. Feng, L. Zhou and Y. Qin, ACS Nano, 2012, 6, 11009–11017 CrossRef CAS PubMed.
- G. Wang, L. Wang, L. H. Mark, V. Shaayegan, G. Wang, H. Li, G. Zhao and C. B. Park, ACS Appl. Mater. Interfaces, 2018, 10, 1195–1203 CrossRef CAS PubMed.
- L.-C. Jia, D.-X. Yan, C.-H. Cui, X. Jiang, X. Ji and Z.-M. Li, J. Mater. Chem. C, 2015, 3, 9369–9378 RSC.
- H.-D. Huang, C.-Y. Liu, D. Zhou, X. Jiang, G.-J. Zhong, D.-X. Yan and Z.-M. Li, J. Mater. Chem. A, 2015, 3, 4983–4991 RSC.
- J. Chen, X. Liao, W. Xiao, J. Yang, Q. Jiang and G. Li, ACS Sustainable Chem. Eng., 2019, 7, 9904–9915 CrossRef CAS.
- Y.-J. Wan, P.-L. Zhu, S.-H. Yu, R. Sun, C.-P. Wong and W.-H. Liao, Small, 2018, 14, 1800534 CrossRef PubMed.
- L. Kong, X. Yin, M. Han, X. Yuan, Z. Hou, F. Ye, L. Zhang, L. Cheng, Z. Xu and J. Huang, Carbon, 2017, 111, 94–102 CrossRef CAS.
- J. Liu, H.-B. Zhang, R. Sun, Y. Liu, Z. Liu, A. Zhou and Z.-Z. Yu, Adv. Mater., 2017, 29, 1702367 CrossRef PubMed.
- Z. Zeng, H. Jin, M. Chen, W. Li, L. Zhou and Z. Zhang, Adv. Funct. Mater., 2016, 26, 303–310 CrossRef CAS.
- Y. Yang, M. C. Gupta, K. L. Dudley and R. W. Lawrence, Nano Lett., 2005, 5, 2131–2134 CrossRef CAS PubMed.
- J. Li, G. Zhang, Z. Ma, X. Fan, X. Fan, J. Qin and X. Shi, Compos. Sci. Technol., 2016, 129, 70–78 CrossRef CAS.
- T. K. Gupta, B. P. Singh, S. R. Dhakate, V. N. Singh and R. B. Mathur, J. Mater. Chem. A, 2013, 1, 9138–9149 RSC.
- B. Shen, Y. Li, D. Yi, W. Zhai, X. Wei and W. Zheng, Carbon, 2016, 102, 154–160 CrossRef CAS.
- A. Ameli, P. U. Jung and C. B. Park, Carbon, 2013, 60, 379–391 CrossRef CAS.
- H. Zhang, G. Zhang, M. Tang, L. Zhou, J. Li, X. Fan, X. Shi and J. Qin, Chem. Eng. J., 2018, 353, 381–393 CrossRef CAS.
- H.-J. Choi, B.-J. Park, J.-H. Eom and S.-G. Yoon, Curr. Appl. Phys., 2016, 16, 1642–1648 CrossRef.
- K. Raagulan, R. Braveenth, J. H. Jang, Y. Seon Lee, C.-M. Yang, B. Mi Kim, J. J. Moon and Y. K. Chai, Materials, 2018, 11, 1803 CrossRef PubMed.
- B. Zhao, C. Zhao, R. Li, S. M. Hamidinejad and C. B. Park, ACS Appl. Mater. Interfaces, 2017, 9, 20873–20884 CrossRef CAS PubMed.
- B. Zhao, S. Wang, C. Zhao, R. Li, S. M. Hamidinejad, Y. Kazemi and C. B. Park, Carbon, 2018, 127, 469–478 CrossRef CAS.
- B. Zhao, M. Hamidinejad, C. Zhao, R. Li, S. Wang, Y. Kazemi and C. B. Park, J. Mater. Chem. A, 2019, 7, 133–140 RSC.
- B. Zhao, C. Zhao, M. Hamidinejad, C. Wang, R. Li, S. Wang, K. Yasamin and C. B. Park, J. Mater. Chem. C, 2018, 6, 10292–10300 RSC.
- L.-C. Jia, L. Xu, F. Ren, P.-G. Ren, D.-X. Yan and Z.-M. Li, Carbon, 2019, 144, 101–108 CrossRef CAS.
- L. Wang, R. E. Lee, G. Wang, R. K. M. Chu, J. Zhao and C. B. Park, Chem. Eng. J., 2017, 327, 1151–1162 CrossRef CAS.
- N. Zhao, L. H. Mark, C. Zhu, C. B. Park, Q. Li, R. Glenn and T. R. Thompson, Ind. Eng. Chem. Res., 2014, 53, 11962–11972 CrossRef CAS.
- G. Li, J. Wang, C. B. Park and R. Simha, J. Polym. Sci., Part B: Polym. Phys., 2007, 45, 2497–2508 CrossRef CAS.
- C. B. Park, A. H. Behravesh and R. D. Venter, Polym. Eng. Sci., 1998, 38, 1812–1823 CrossRef CAS.
- E. Naguib Hani, B. Park Chul and N. Reichelt, J. Appl. Polym. Sci., 2004, 91, 2661–2668 CrossRef.
- P. Martins, A. C. Lopes and S. Lanceros-Mendez, Prog. Polym. Sci., 2014, 39, 683–706 CrossRef CAS.
- C. Wan and C. R. Bowen, J. Mater. Chem. A, 2017, 5, 3091–3128 RSC.
- Y.-F. Pan, G.-S. Wang, L. Liu, L. Guo and S.-H. Yu, Nano Res., 2017, 10, 284–294 CrossRef CAS.
- O. D. Jayakumar, E. H. Abdelhamid, V. Kotari, B. P. Mandal, R. Rao, Jagannath, V. M. Naik, R. Naik and A. K. Tyagi, Dalton Trans., 2015, 44, 15872–15881 RSC.
- Y. Feng, W. L. Li, Y. F. Hou, Y. Yu, W. P. Cao, T. D. Zhang and W. D. Fei, J. Mater. Chem. C, 2015, 3, 1250–1260 RSC.
- Q.-W. Wang, H.-B. Zhang, J. Liu, S. Zhao, X. Xie, L. Liu, R. Yang, N. Koratkar and Z.-Z. Yu, Adv. Funct. Mater., 2019, 29, 1806819 CrossRef.
- R. Sun, H.-B. Zhang, J. Liu, X. Xie, R. Yang, Y. Li, S. Hong and Z.-Z. Yu, Adv. Funct. Mater., 2017, 27, 1702807 CrossRef.
- Y. Yang, M. C. Gupta, K. L. Dudley and R. W. Lawrence, Nano Lett., 2005, 5, 2131–2134 CrossRef CAS PubMed.
- J.-M. Thomassin, C. Pagnoulle, L. Bednarz, I. Huynen, R. Jerome and C. Detrembleur, J. Mater. Chem., 2008, 18, 792–796 RSC.
- S. M. Hamidinejad, R. K. M. Chu, B. Zhao, C. B. Park and T. Filleter, ACS Appl. Mater. Interfaces, 2018, 10, 1225–1236 CrossRef CAS PubMed.
- B. Zhao, X. Guo, W. Zhao, J. Deng, B. Fan, G. Shao, Z. Bai and R. Zhang, Nano Res., 2017, 10, 331–343 CrossRef CAS.
- J. Gao and Y.-L. Loo, Adv. Funct. Mater., 2015, 25, 105–110 CrossRef CAS.
- C. W. Nan, Y. Shen and J. Ma, Annu. Rev. Mater. Res., 2010, 40, 131–151 CrossRef CAS.
- M. Zhang, P. Zhang, Q. Wang, L. Li, S. Dong, J. Liu and W. Rao, J. Mater. Chem. C, 2019, 7, 10331–10337 RSC.
- L.-Q. Zhang, S.-G. Yang, L. Li, B. Yang, H.-D. Huang, D.-X. Yan, G.-J. Zhong, L. Xu and Z.-M. Li, ACS Appl. Mater. Interfaces, 2018, 10, 40156–40167 CrossRef CAS PubMed.
- S. Zhao, H.-B. Zhang, J.-Q. Luo, Q.-W. Wang, B. Xu, S. Hong and Z.-Z. Yu, ACS Nano, 2018, 12, 11193–11202 CrossRef CAS PubMed.
- Y. Wu, Z. Wang, X. Liu, X. Shen, Q. Zheng, Q. Xue and J.-K. Kim, ACS Appl. Mater. Interfaces, 2017, 9, 9059–9069 CrossRef CAS PubMed.
- Z. Liu, G. Bai, Y. Huang, Y. Ma, F. Du, F. Li, T. Guo and Y. Chen, Carbon, 2007, 45, 821–827 CrossRef CAS.
- R. Bera, A. Maitra, S. Paria, S. K. Karan, A. K. Das, A. Bera, S. K. Si, L. Halder, A. De and B. B. Khatua, Chem. Eng. J., 2018, 335, 501–509 CrossRef CAS.
- M. Han, X. Yin, L. Kong, M. Li, W. Duan, L. Zhang and L. Cheng, J. Mater. Chem. A, 2014, 2, 16403–16409 RSC.
- L. Wang, X. Li, Q. Li, X. Yu, Y. Zhao, J. Zhang, M. Wang and R. Che, Small, 2019, 15, 1900900 CrossRef PubMed.
- B. Zhao, B. Fan, G. Shao, W. Zhao and R. Zhang, ACS Appl. Mater. Interfaces, 2015, 7, 18815–18823 CrossRef CAS PubMed.
- Y. Sun, J. Zhang, Y. Zong, X. Deng, H. Zhao, J. Feng, M. He, X. Li, Y. Peng and X. Zheng, ACS Appl. Mater. Interfaces, 2019, 11, 6374–6383 CrossRef CAS PubMed.
- O. Pitkänen, J. Tolvanen, I. Szenti, Á. Kukovecz, J. Hannu, H. Jantunen and K. Kordas, ACS Appl. Mater. Interfaces, 2019, 11, 19331–19338 CrossRef PubMed.
Footnote |
| † Electronic supplementary information (ESI) available. See DOI: 10.1039/d0tc00987c |
| This journal is © The Royal Society of Chemistry 2020 |

