 Open Access Article
Copper(II) defect-cubane water oxidation electrocatalysts: from molecular tetramers to oxidic nanostructures†
Devi Prasad
Adiyeri Saseendran
 a,
Jörg W. A.
Fischer
 b,
Lea
Müller
b,
Daniel F.
Abbott
b,
Lea
Müller
b,
Daniel F.
Abbott
 b,
Victor
Mougel
 b,
Gunnar
Jeschke
 b,
Carlos A.
Triana
 a and
Greta R.
Patzke
 *a
*a
aDepartment of Chemistry, University of Zurich, Winterthurerstrasse 190, CH-8057 Zurich, Switzerland. E-mail: greta.patzke@chem.uzh.ch
bDepartment of Chemistry and Applied Biosciences, Vladimir-Prelog-Weg 1-5/10, CH-8093 Zurich, Switzerland
First published on 24th April 2023
Abstract
We report on the synthesis and spectroscopic evidence for a sequence of structural transformations of a new defect-cubane type copper complex, [Cu4(pyalk)4(OAc)4](ClO4)(HNEt3), which acts as a pre-catalyst for water oxidation. In situ and post-catalytic studies showed that the tetrameric complex undergoes a structural transformation into dimeric and monomeric species, induced by water molecules and carbonate anions, respectively. Further, the observed electrocatalytic water oxidation activity has been confirmed to arise from in situ-generated Cu(II) oxidic nanostructures at the electrode interface.
The production of green hydrogen through water splitting offers an alternative for achieving renewable energy sources to reduce the anthropogenic environmental damage from fossil fuels.1,2 Yet, the involved complex four electron transfer processes, and the high thermodynamic barrier for O–O bond formation results in sluggish kinetics for the oxygen evolution reaction (OER).3 Hence, developing low cost and high performance water oxidation catalysts (WOCs) is of crucial importance. Inspired by nature's {Mn4CaOx} oxygen evolution complex (OEC), a versatile variety of transition metal (TM)-based molecular WOCs has been designed.4 In particular, molecular WOCs with tetranuclear cubane {M4O4} cores have been widely studied due to their structural similarity to the OEC,5 Cu-based WOCs have gained significant attention due to the low toxicity and relatively high abundance of copper along with its well-defined redox properties,6,7 and the spectrum of molecular Cu-based WOCs has expanded towards bi/tri/tetra, and polynuclear Cu cores.7–12
Molecular copper WOCs as electrodeposited films, and in situ generated nanosized Cu-oxides/Cu-hydroxides, have also been reported.13 While Cu-based molecular WOCs show homogenous nature in neutral conditions, nanoparticulate copper(hydr)oxides often contribute to their activity under alkaline conditions.13 Although the catalytic performance of molecular WOCs could be boosted by design, reinvestigations have revealed that they often compete with the formation of active heterogeneous/nanostructured species.14 A broad set of experimental conditions such as solvent type, electrolyte/buffer ions, catalyst concentration and electrode type do effect the stability and reactivity of molecular WOCs.15 This makes it vital to uncover the structural and catalytic behaviour of molecular Cu-WOCs in solution, since they exhibit homogeneous and heterogeneous behaviour depending on the operational conditions. Hence, a detailed understanding of the structural integrity of molecular Cu-WOCs in solution is of vital importance to; (i) determine their in situ transformation pathways towards true active species, (ii) understand the solution/buffer speciation of polynuclear WOCs to specify the coordination environment of active metal sites, and (iii) establish the exact trigger parameters that drive the molecular to oxidic transformation in situ.
Herein, we introduce a tetranuclear Cu-complex, namely [Cu4(pyalk)4(OAc)4](ClO4)(HNEt3) (pyalk: 2-(2′-pyridyl)-2-propanoate), which acts as a (pre-)catalyst for water oxidation in alkaline conditions. Using a combination of in/ex situ methods, we tracked the structural transformations of the Cu-defect cubane in aqueous and alkaline buffer solutions. We reveal that in situ formed Cu(II)Ox nanostructured species are among the real contributors to the observed OER.
The Cu-tetramer was synthesized by dropwise addition of the pyalk ligand to an acetonitrile solution of Cu(OAc)2 and NaClO4 (experimental section, ESI†). The UV-Vis spectrum of the Cu-tetramer in acetonitrile shows a broad peak at 675 nm and a sharp peak at 342 nm (Fig. 1a), which can be assigned to the d–d and charge transfer transitions in tetranuclear Cu complexes, respectively.16 Adding aliquots of water to an acetonitrile solution of the Cu-tetramer leads to the gradual reduction of the characteristic peak at 342 nm, while the d–d peak undergoes a bathochromic shift to 735 nm (Fig. 1a).
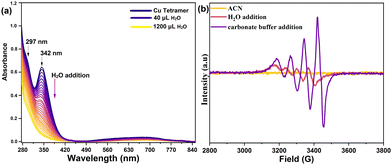 | ||
| Fig. 1 (a) In situ UV-Vis spectra of the Cu-tetramer upon serial addition of water. (b) X-band EPR spectra of the Cu-tetramer on adding water and 0.08 M carbonate buffer (pH 10.5). | ||
This indicates that the tetranuclear Cu core underwent structural/electronic changes upon interaction with water molecules (Fig. S1 and S2, ESI†), as further confirmed by the isolation of Cu-dimer crystals from aqueous solution of the Cu-tetramer (Fig. S3, ESI†). Additionally, the dissolution of Cu-tetramer in carbonate-bicarbonate buffer (pH 10.5) causes the d–d band to undergo a hypsochromic shift to 655 nm, indicating a change in the coordination of the Cu-centre that can be assigned to the binding of a CO32− group.7 Time-dependent UV-Vis spectra of the Cu-dimer complex in buffer over 24 h (Fig. S4, ESI†), revealed long-term stability of the newly formed Cu-complex in alkaline conditions (pH 10.5).
To further investigate the decomposition of the Cu-tetramer into monomers, in situ continuous-wave (cw) electron paramagnetic resonance (EPR) measurements were performed. In contrast to monomeric Cu species, Cu-tetramers and Cu-dimers are not expected to give rise to an EPR signal under the applied measurement conditions due to antiferromagnetic coupling.17,18 Measurements on 0.5 mM Cu-tetramer in pure acetonitrile did not exhibit an EPR signal, indicating the stability of tetrameric or dimeric Cu-species under these conditions (Fig. 1b). Upon water addition a weak Cu signal appears, suggesting the presence of a minor fraction of monomeric species. In carbonate buffer a strong signal is detected, confirming the presence of large fraction of monomeric species. The slight shift in the resonance positions indicates a different ligand environment of the Cu centers in buffer compared to the complex in water. Starting from the Cu-dimer, quantitative EPR analyses established that up to a Cu concentration of 1 mM all Cu-dimer species are dissociated into monomers in buffer (Fig. S8, ESI†). Therefore, the monomeric Cu-species are most likely the dominant species in the buffer solution. The solid-state cw EPR spectrum of a freeze-quenched 100 μM Cu solution in buffer exhibits resolved 14N hyperfine coupling, indicating that the monomeric Cu-species is coordinated by one N atom. This is further supported by location of the g|| and A|| values in a Bloomberg–Peisach plot19 (Fig. S9 and S10, ESI†).
The tetramer to dimer speciation of the complex [Cu4(pyalk)4(OAc)4](ClO4)(HNEt3) was studied by high resolution electrospray ionization mass spectrometry (HR-ESIMS) (Fig. S11–S15, ESI†). Structural integrity of the Cu-tetramer in acetonitrile was verified by the observation of a molecular species at m/z = 1053, generated by exclusion of ClO4− and HNEt3+ counter ions. After using water as solvent, no peaks were detected above m/z = 800. The peak at m/z = 534.1 corresponds to a dimeric [Cu2(pyalk)2(OAc)2(H2O)-H]+ species and the peak at m/z = 336.089 indicates the presence of [Cu(pyalk)2-2H]+ molecular species, implying the presence of a minor amount of mononuclear Cu(pyalk) species in water, as supported by the EPR spectra. These findings confirm that the Cu-tetramer reorganizes mainly into Cu-dimers in water, with partial formation of a mononuclear species, that is in turn, the prevailing species in carbonate buffer.
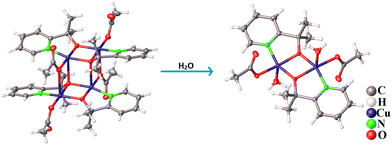
Crystals of the Cu-dimer were obtained through dissolution of the Cu-tetramer in water. Crystallographic data and selected bond lengths are given in Tables S2–S5, ESI.† The Cu tetramer has a defect-cubane structure, with a pair of di-copper centres {Cu2–Opyalk}, that are bridged by O atoms from the pyalk ligands. Two such Cu2–Opyalk units are bridged by acetate ligands to form the tetrameric structure (Fig. 2 and Fig. S1, ESI†). The crystal lattice is constituted of perchlorate and triethylammonium ions, in line with the [Cu4(pyalk)4(OAc)4] core being neutral. The Cu-dimer contains a typical di-copper core, where the two Cu-centres are bridged by O atoms from deprotonated pyalk ligands. The Cu-centres adopt a distorted square pyramidal symmetry, where the two O atoms from the pyalk ligand, one O atom from acetate, and the N atom from the pyridyl ring comprise the base of the Cu coordination. The powder X-ray diffraction (PXRD) patterns of bulk samples of both Cu complexes agree well with the simulated patterns, thus confirming the phase purity of the obtained Cu complexes (Fig. S16 and S17, ESI†). In addition, both Cu-tetramer and Cu-dimer complexes depict sharp and distinct Raman bands in the region 1000–1700 cm−1, revealing their different chemical structures and symmetry (Fig. S18 and S19, ESI†).
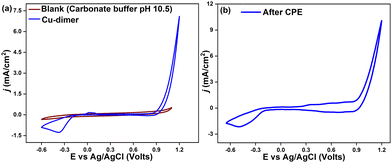
The electrocatalytic properties of the Cu-dimer were studied by cyclic voltammetry (CV), using 0.08 M carbonate-bicarbonate buffer (pH 10.5). The Cu-dimer shows an oxidation event at Epa = 0.0266 V and a reduction peak at Epc = −0.2422 V (ΔEp = 0.268 V) (Fig. S23, ESI†). Similar redox peaks in Cu-based molecular electrocatalysts have been assigned to the CuI/II couple.7 On increasing the anodic potential, the current starts to rise around 0.8 V, followed by a sharp rise in current density at more positive potentials. As seen in Fig. 3a, the current density reaches a value of 3 mA cm−2 at 1 V, and the catalytic current density of 7 mA cm−2 at 1.2 V. The onset potential 0.77 V (defined as the potential at j = 0.1 mA cm−2), relates to an overpotential of 960 mV, which is comparable to some of the reported Cu-based OER electrocatalysts (Table S7, ESI†).
The peak current ip shows a linear relation with the square root of scan rate, in accordance to the Randles-Sevcik equation, indicating a diffusion-controlled process (Fig. S25 and S26, ESI†).20 Controlled potential electrolysis (CPE) was done in 0.08 M buffer solution (pH 10.5) with a Cu-dimer concentration of 0.5 mM. At an applied potential of 0.82 V vs. Ag/AgCl (1.65 vs. NHE), a catalytic current density of 0.4 mA cm−2 was achieved for over 7 h (Fig. S27, ESI†). In the initial 1.5 h, chronoamperometric data showed an increase in current density, which later stabilized at around 0.4 mA cm−2. This could be ascribed to an activation process for the generation of real catalytically active species, such as the initiation of a heterogeneous deposition at the electrode interface.21 The applied potentials generate oxygen bubbles at the FTO electrode, followed by a surge in the oxygen concentration. Oxygen evolution and faradaic efficiency were determined with a Clark oxygen sensor. Comparisons of experimental data with the theoretical oxygen yield lead to a faradaic efficiency of 86% for oxygen evolution (Fig. S28 and S29, ESI†). After CPE experiments, the FTO electrode was rinsed with water and CVs were recorded in fresh buffer. The CV curves show a different current density profile from that of the initial Cu complex. The cathodic Epc peak was shifted to −0.34 V (Fig. S30, ESI†), and the catalytic current density increased to 5.3 mA cm−2 at 1 V (Fig. 3b).
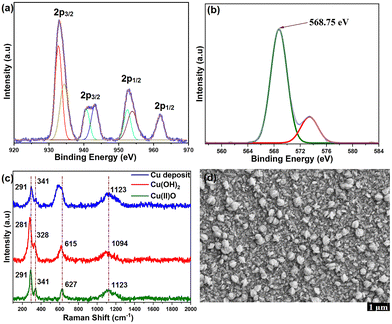
Scanning electron microscopy (SEM) revealed that the surface morphology of FTO electrodes consists of a random distribution of isolated flower-like nanostructures (Fig. 4d and Fig. S33, ESI†). Energy-dispersive X-ray spectroscopy (EDX) mapping revealed the presence of copper on the FTO surface (Fig. S34 and S35, ESI†). The electrochemical stability of the in situ formed nanostructures was studied by 100 successive CV cycles in carbonate buffer (pH 10.5), displaying good stability (Fig. S31, ESI†). Oxygen bubbles were detected at the glassy carbon electrode during the successive CV scans, further supporting that the deposited nanostructures are the true catalysts for OER (Fig. S32, ESI†). The X-ray photoelectron spectroscopy (XPS) survey signals of the nanostructures show peaks from Cu, O, C and Sn (from FTO) species (Fig. S36, ESI†).
The Cu 2p signal displayed shake-up satellite peaks, and Cu 2p3/2 and 2p1/2 signals at binding energies of 933.6 and 953.7 eV, respectively (Fig. 4a), which confirms that Cu has a +2 valence state.14,21 As the Cu 2p3/2 signals of CuO and Cu(OH)2 are similar, the Cu LMM feature was analysed to resolve the actual composition of Cu2+ species. The peak at the binding energy of 568.75 eV in the Cu LMM signal (Fig. 4b) agrees with the reported fingerprint LMM feature of CuO.21,22 The O 1s XP spectrum further supports the presence of CuO. The peak at 530.4 eV is assigned to elemental oxygen in CuO, while the signals at 531.3 eV and 532.4 eV arise from chemisorbed water molecules and hydroxyl oxygen species from the FTO surface (Fig. S37, ESI†). No signals in the N 1s region from the ligand were observed, which ruled out the presence of molecular species at the electrode surface. The Raman spectrum of the Cu-oxide nanostructure deposited on FTO displays three major active modes at 291, 341, 627 cm−1 (Fig. 4c), which correspond to the Ag and Bg modes from Cu–O vibrations, respectively.23 The signal at 1123 cm−1 is attributed to multi-phonon 2Bg vibrations arising from electronic density variations in the dx2−y2 plane.24 The peaks at 291 and 341 cm−1 agree with those of reference CuO (Fig. S38, ESI†). The band at 627 cm−1 appears to be broader than that of CuO, which is due to overlap with the signal from the FTO substrate (Fig. S39, ESI†). The Raman modes in reference Cu(OH)2 are red-shifted to 281 and 328 cm−1, respectively (Fig. S40, ESI†). Comparison of the Raman spectrum of CuCO3 does not show any agreement, thus excluding basic CuCO3 as the source of OER activity (Fig. S41, ESI†). In addition, the FT-IR spectrum of the electrode deposit bears close resemblance to that of CuO (Fig. S42, ESI†). Further, UV-visible spectral analysis of pre and post-catalytic solutions indicated 38% reduction in catalyst concentration which can be attributed to the conversion of molecular to oxide species (Fig. S43, ESI†).
Comparing the X-ray absorption near edge structure (XANES) spectra μ(E) of the as deposited nanostructures with the references CuO, Cu2O and Cu(OH)2 (Fig. 5a) shows that the absorption edge energy position of the μ(E) signal of the deposit is close to that of CuO. This validates that the deposited nanostructures holds a Cu2+ valence state, in line with our XPS results. The μ(E) spectrum of these nanostructures shows similarities with reference Cu(OH)2, and hence formation of a surface Cu(OH)2 phase cannot be completely excluded. Fig. 5b shows the Fourier-Transform FT|k3χ(k)| of the extended X-ray absorption fine structure (EXAFS) spectra for the deposited nanostructures and references. The FT|k3χ(k)| spectrum displays two main scattering peaks at R + ΔR∼1.5 and ∼2.48 Å, arising from single scattering of first and second shell coordinated O and Cu atoms, respectively. Fitting of the FT|k3χ(k)| spectrum can be done using only a CuO phase, which ratifies the CuO oxide-type structure of the deposited nanostructures. Cu2+ is bonded in a square co-planar geometry to four equivalent O2− ions with interatomic distances and coordination numbers (N) of Cu–O∼1.956 Å [NCu–O = 4], Cu–O∼2.815 Å [NCu–O = 2], Cu–Cu∼2.903 Å [NCu–Cu = 4], Cu–Cu∼3.136 Å [NCu–Cu = 4]. Those Cu–Cu interatomic distances in the nanostructured species are slightly shorter than the Cu–Cu∼2.949 Å and Cu–Cu∼3.335 Å distances in Cu(OH)2 (ICSD 15455). Combined results from XAS and Raman spectra indicate that the structure of the deposited nanostructured sample mainly represents a CuO phase with monoclinic symmetry, along with a co-existing minor Cu(OH)2 phase.
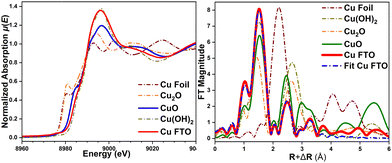 | ||
| Fig. 5 (a) Normalized XANES spectra μ(E) and (b) Fourier-Transform FT|k3χ(k)| spectra of the Cu deposit and reference oxides, and fitting to CuO. | ||
In summary, we demonstrated how a tetrameric Cu-complex [Cu4(pyalk)4(OAc)4](ClO4)(HNEt3) with a defect-cubane structure transforms into a Cu-dimer complex [Cu2(pyalk)2(OAc)2(H2O)] in water, and further, into Cu-monomers in carbonate buffer at pH 10.5. The structure transformations arise from the coordination of water molecules and carbonate anions to the Cu centres, respectively, as supported by a combination of analytical techniques. While the initial complex shows water oxidation activity, the true catalyst contains nanosized Cu-oxide-based heterogeneous species, which are formed at the electrode interface during the OER. These results highlight the importance of assessing the structural integrity of molecular WOCs in solution for the knowledge-driven design of high performance electrocatalysts.
This work has been financed by the Swiss National Science Foundation (Grant No. 200021_200989) and by the University of Zurich Research Priority Program (URPP) Solar Light to Chemical Energy Conversion (LightChEC). We are grateful to ESRF-SNBL for the allocation of synchrotron radiation beamtime.
Conflicts of interest
The authors declare no competing financial interest.Notes and references
- C. Walter, P. W. Menezes and M. Driess, Chem. Sci., 2021, 12, 8603–8631 RSC.
- Y. Zhao, D. Gao, S. Liu, J. Biskupek, U. Kaiser, R. Liu and C. Streb, Chem. – Eur. J., 2023, 29, e2022032 Search PubMed.
- R. Matheu, P. Garrido-Barros, M. Gil-Sepulcre, M. Z. Ertem, X. Sala, C. Gimbert-Suriñach and A. Llobet, Nat. Rev. Chem., 2019, 3, 331–341 CrossRef CAS.
- J. Li, C. A. Triana, W. Wan, D. P. Adiyeri Saseendran, Y. Zhao, S. E. Balaghi, S. Heidari and G. R. Patzke, Chem. Soc. Rev., 2021, 50, 2444–2485 RSC.
- F. Song, R. Moré, M. Schilling, G. Smolentsev, N. Azzaroli, T. Fox, S. Luber and G. R. Patzke, J. Am. Chem. Soc., 2017, 139, 14198–14208 CrossRef CAS PubMed.
- S. Nestke, E. Ronge and I. Siewert, Dalton Trans., 2018, 47, 10737 RSC.
- D. Lukács, Ł. Szyrwiel and J. S. Pap, Catalysts, 2019, 9, 83 CrossRef.
- S. M. Barnett, K. I. Goldberg and J. M. Mayer, Nat. Chem., 2012, 4, 498–502 CrossRef CAS PubMed.
- X. J. Su, M. Gao, L. Jiao, R. Z. Liao, P. E. M. Siegbahn, J. P. Cheng and M. T. Zhang, Angew. Chem.,Int. Ed., 2015, 54, 4909–4914 Search PubMed.
- Q. F. Chen, Z. Y. Cheng, R. Z. Liao and M. T. Zhang, J. Am. Chem. Soc., 2021, 143, 19761–19768 CrossRef CAS PubMed.
- L. Yu, J. Lin, M. Zheng, M. Chen and Y. Ding, Chem. Commun., 2018, 54, 354–357 RSC.
- J. Lin, X. Liang, X. Cao, N. Wei and Y. Ding, Chem. Commun., 2018, 54, 12515–12518 RSC.
- H. Lee, X. Wu and L. Sun, Nanoscale, 2020, 12, 4187–4218 RSC.
- S. E. Balaghi, S. Mehrabani, Y. Mousazade, R. Bagheri, A. S. Sologubenko, Z. Song, G. R. Patzke and M. M. Najafpour, ACS Appl. Mater. Interfaces, 2021, 13, 19927–19937 CrossRef CAS PubMed.
- D. Gao, I. Trentin, L. Schwiedrzik, L. González and C. Streb, Molecules, 2020, 25, 1–20 Search PubMed.
- X. Jiang, J. Li, B. Yang, X. Z. Wei, B. W. Dong, Y. Kao, M. Y. Huang, C. H. Tung and L. Z. Wu, Angew. Chem.,Int. Ed., 2018, 57, 7850–7854 Search PubMed.
- A. Banerjee, R. Singh, P. Mondal, E. Colacio and K. K. Rajak, Eur. J. Inorg. Chem., 2010, 790–0798 CrossRef CAS.
- M. Melník, Coord. Chem. Rev., 1982, 42, 259–293 CrossRef.
- J. Peisach and W. E. Blumberg, Arch. Biochem. Biophys., 1974, 165, 691–708 CrossRef CAS PubMed.
- S. Cui, X. Liu, Z. Sun and P. Du, ACS Sustainable Chem. Eng., 2016, 4, 2593–2600 CrossRef CAS.
- X. Liu, S. Cui, M. Qian, Z. Sun and P. Du, Chem. Commun., 2016, 52, 5546–5549 RSC.
- I. Platzman, R. Brener, H. Haick and R. Tannenbaum, J. Phys. Chem. C, 2008, 112, 1101–1108 CrossRef CAS.
- B. G. Ganga and P. N. Santhosh, Mater. Lett., 2015, 138, 113–115 CrossRef CAS.
- W. Wang, Q. Zhou, X. Fei, Y. He, P. Zhang, G. Zhang, L. Peng and W. Xie, CrystEngComm, 2010, 12, 2232–2237 RSC.
Footnote |
| † Electronic supplementary information (ESI) available. CCDC 2215584–2243591. For ESI and crystallographic data in CIF or other electronic format see DOI: https://doi.org/10.1039/d3cc01005h |
| This journal is © The Royal Society of Chemistry 2023 |

