 Open Access Article
Creative Commons Attribution 3.0 Unported Licence
SARS-CoV-2 RNA abundance in wastewater as a function of distinct urban sewershed size†
Rochelle H.
Holm
 *a,
Anish
Mukherjee
 b,
Jayesh P.
Rai
b,
Ray A.
Yeager
ac,
Daymond
Talley
d,
Shesh N.
Rai
abef,
Aruni
Bhatnagar
a and
Ted
Smith
b,
Jayesh P.
Rai
b,
Ray A.
Yeager
ac,
Daymond
Talley
d,
Shesh N.
Rai
abef,
Aruni
Bhatnagar
a and
Ted
Smith
 a
a
aChristina Lee Brown Envirome Institute, School of Medicine, University of Louisville, 302 E. Muhammad Ali Blvd., Louisville, KY 40202, USA. E-mail: rochelle.holm@louisville.edu
bDepartment of Bioinformatics and Biostatistics, School of Public Health and Information Sciences, University of Louisville, 505 S. Hancock St., Louisville, KY 40202, USA
cDepartment of Environmental and Occupational Health Sciences, School of Public Health and Information Sciences, University of Louisville, 485 E. Gray St., Louisville, KY 40202, USA
dLouisville/Jefferson County Metropolitan Sewer District, Morris Forman Water Quality Treatment Center, 4522 Algonquin Parkway, Louisville, KY 40211, USA
eBrown Cancer Center, School of Medicine, University of Louisville, 505 S. Hancock St., Louisville, KY 40202, USA
fCenter for Integrative Environmental Health Sciences, University of Louisville, 500 S. Preston St., Louisville, KY 40202, USA
First published on 3rd March 2022
Abstract
During the COVID-19 pandemic, wastewater-based epidemiology has emerged as a promising approach for monitoring SARS-CoV-2 prevalence on a community-level. Despite much being known about the utility of making these measurements in large wastewater treatment plants, little is known about the correlation with finer geographic resolution, such as those obtained through sewershed sub-area catchments. This study aims to identify community wastewater surveillance characteristics between sewershed areas that affect the strength of the association of SARS-CoV-2 RNA detection in a metropolitan area. For this, wastewater from 17 sewershed areas were sampled in Louisville/Jefferson County, Kentucky (USA), from August 2020 to April 2021 (N = 727), which covered approximately 97% of the county's households. Solids were collected from the treatment plants from November 2020 to December 2020 (N = 42). Our results indicate that the sewersheds differ in SARS-CoV-2 trends; however, high pairwise correlation spatial trends were not observed, and the mean SARS-CoV-2 RNA concentrations of smaller upstream community sewershed areas did not differ from their respective treatment centers. Solid samples could only be collected at treatment plants, therefore not allowing us to evaluate SARS-CoV-2 abundance as a function of the sewershed scale. The population size sensitivity of SARS-CoV-2 concentration detection is non-linear: at low population levels the measures are either too sensitive and generate a high level of variability, or at high population levels the estimates are dampened making small changes in community infection levels more difficult to discern. Our results suggest selecting sampling sites that include a wide population range. This study and its findings may inform other system-wide strategies for sampling wastewater for estimating non-SARS-CoV-2 targets.
Water impactSevere acute respiratory syndrome coronavirus 2 (SARS-CoV-2) is known to often be present in the feces of coronavirus disease 2019 (COVID-19) infected patients. SARS-CoV-2 sewer surveillance was conducted across a range of metropolitan population levels, from thousands to hundreds of thousands, to establish optimal sampling strategies. Our results suggest sampling an equal range of populations over time is best. |
1. Introduction
Severe acute respiratory syndrome coronavirus 2 (SARS-CoV-2) is a respiratory infection known to often, though not universally, be present in the feces of coronavirus disease 2019 (COVID-19) infected patients.1,2 Although relatively new, wastewater-based epidemiology (WBE) for monitoring the presence of SARS-CoV-2 on a community-level is rapidly expanding.3 In a piped sanitation system, the generation point for tracking the feces of COVID-19 infected patients is a flush toilet whereby fecal matter travels in one direction from a household, and depending on topography neighborhood level raw wastewater potentially passes through a pumping station, and ultimately ending at a centralized treatment plant. Based on sanitary sewer system design and function, obtaining a finer resolution of a sub-population involves sampling locations along these pipes from geographically distinct areas (i.e., the catchment areas or sewersheds).4 Even before the COVID-19 pandemic, the advantage of monitoring wastewater across different sized sewershed areas has been demonstrated in previous studies on nutrient removal and energy and resource recovery in wastewater treatment, and on monitoring trace organic chemicals.5–7 Community-level sampling scales of SARS-CoV-2 concentration in wastewater have been studied,8–12 but without explicit consideration for the utility of nested sewershed areas along a range of metropolitan population levels, from thousands to hundreds of thousands, contributing to a common treatment plant to determine how sample pooling affects target properties. Furthermore, existing wastewater regulatory compliance monitoring is not typically conducted at sewershed sub-area catchments scales; rather, it is conducted at centralized treatment facilities or in specific industrial area effluent, which have convenient, controlled, access points for sampling. Moreover, little information is available regarding the utility of sampling large urban sewers across mixed sewershed sizes for epidemiological surveillance.This study aimed to identify community wastewater surveillance characteristics between large wastewater treatment plants and finer geographic resolutions obtained through sewershed sub-area catchments that affect the strength of the association of SARS-CoV-2 RNA detection in a metropolitan area. Establishing the optimal scale for the sampling sewershed area may help identify locations where the virus could be lingering at a sub-population level as defined by a smaller sewershed area and determine how viral levels of SARS-CoV-2 change when measured at subsequent centralized treatment facilities.
2. Methods
2.1. Sewer network areas
The piped sewer system network geographic information system (GIS) shapefiles were provided by the wastewater utility, Louisville/Jefferson County Metropolitan Sewer District (MSD). Based on this, idealized sampling sites including wastewater treatment plants and finer geographic resolutions obtained through corresponding (nested) sewershed sub-area catchments across a range of population levels were selected. After the creation of catchment areas in GIS, the population was quantified based on the 2018 U.S. Census Bureau American Community Survey (ACS)13 for individuals whose residences fell within each sewershed. For the full sample site selection protocol, see Yeager et al.42.2. Wastewater sample collection and handling
The 17 locations in Louisville/Jefferson County, Kentucky, USA (Fig. 1; Table 1), were sampled over 34 weeks to monitor how SARS-CoV-2 levels in wastewater correspond to sewershed area types and sizes. Five of these sites were influent in the wastewater treatment plants. Twelve were upstream corresponding (nested) sewershed sub-area catchments at community sewer line locations or intermediate pump stations that were primarily residential, with minimal industrial inputs. Samples (N = 823) were collected from August 17, 2020 to April 5, 2021, with the exception of site MSD17, which was added on September 15, 2020. Additionally, no samples were collected in the last two weeks of December (ESI A†). Samples collected by MSD personnel typically comprised of 125 ml of subsample from a 24 h time-weighted composite sampler in an ice bath. In the event of a composite sampler equipment malfunction, a grab sample was collected. Samples were transported on ice to the University of Louisville for analysis.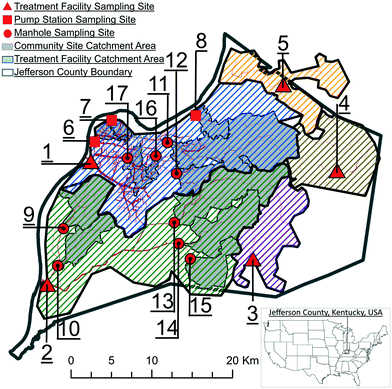 | ||
| Fig. 1 Sampling site locations and corresponding sewershed areas in Louisville/Jefferson County, Kentucky, USA. | ||
| Site name | Map ID | Site type | Incomea (USD$) | Populationa | Area (km2) | Combined sewer | Downstream aggregate treatment plant |
|---|---|---|---|---|---|---|---|
| a Based on 2018 U.S Census Bureau American Community Survey (ACS).13 Income is mean median household. | |||||||
| MSD01 | 1 | Treatment plant | 54![[thin space (1/6-em)]](https://www.rsc.org/images/entities/char_2009.gif) 138 138 |
349![[thin space (1/6-em)]](https://www.rsc.org/images/entities/char_2009.gif) 850 850 |
280 | Yes | — |
| Morris Forman Water Quality Treatment Center (MFWQTC) | |||||||
| MSD02 | 2 | Treatment plant | 53![[thin space (1/6-em)]](https://www.rsc.org/images/entities/char_2009.gif) 577 577 |
295![[thin space (1/6-em)]](https://www.rsc.org/images/entities/char_2009.gif) 910 910 |
332 | No | — |
| Derek R. Guthrie Water Quality Treatment Center (DRGWQTC) | |||||||
| MSD03 | 3 | Treatment plant | 76![[thin space (1/6-em)]](https://www.rsc.org/images/entities/char_2009.gif) 606 606 |
55![[thin space (1/6-em)]](https://www.rsc.org/images/entities/char_2009.gif) 928 928 |
80 | No | — |
| Cedar Creek Water Quality Treatment Center (CCWQTC) | |||||||
| MSD04 | 4 | Treatment plant | 113![[thin space (1/6-em)]](https://www.rsc.org/images/entities/char_2009.gif) 699 699 |
32![[thin space (1/6-em)]](https://www.rsc.org/images/entities/char_2009.gif) 460 460 |
88 | No | — |
| Floyds Fork Water Quality Treatment Center (FFWQTC) | |||||||
| MSD05 | 5 | Treatment plant | 106![[thin space (1/6-em)]](https://www.rsc.org/images/entities/char_2009.gif) 769 769 |
31![[thin space (1/6-em)]](https://www.rsc.org/images/entities/char_2009.gif) 269 269 |
67 | No | — |
| Hite Creek Water Quality Treatment Center (HCWQTC) | |||||||
| MSD06 | 6 | Pump station | 27![[thin space (1/6-em)]](https://www.rsc.org/images/entities/char_2009.gif) 695 695 |
10![[thin space (1/6-em)]](https://www.rsc.org/images/entities/char_2009.gif) 739 739 |
5 | Yes | MSD01 |
| Shawnee Park PS | MFWQTC | ||||||
| MSD07 | 7 | Pump station | 27![[thin space (1/6-em)]](https://www.rsc.org/images/entities/char_2009.gif) 446 446 |
7820 | 5 | Yes | MSD01 |
| 34th Street PS | MFWQTC | ||||||
| MSD08 | 8 | Pump station | 103![[thin space (1/6-em)]](https://www.rsc.org/images/entities/char_2009.gif) 304 304 |
11![[thin space (1/6-em)]](https://www.rsc.org/images/entities/char_2009.gif) 203 203 |
12 | Yes | MSD01 |
| Muddy Forks PS | MFWQTC | ||||||
| MSD09 | 9 | Manhole | 45![[thin space (1/6-em)]](https://www.rsc.org/images/entities/char_2009.gif) 895 895 |
35![[thin space (1/6-em)]](https://www.rsc.org/images/entities/char_2009.gif) 956 956 |
28 | No | MSD02 |
| MH32985 | DRGWQTC | ||||||
| MSD10 | 10 | Manhole | 51![[thin space (1/6-em)]](https://www.rsc.org/images/entities/char_2009.gif) 656 656 |
25![[thin space (1/6-em)]](https://www.rsc.org/images/entities/char_2009.gif) 073 073 |
21 | No | MSD02 |
| MH09837 | DRGWQTC | ||||||
| MSD11 | 11 | Manhole | 77![[thin space (1/6-em)]](https://www.rsc.org/images/entities/char_2009.gif) 842 842 |
99![[thin space (1/6-em)]](https://www.rsc.org/images/entities/char_2009.gif) 061 061 |
80 | Yes | MSD01 |
| MH08915A CSO140 | MFWQTC | ||||||
| MSD12 | 12 | Manhole | 68![[thin space (1/6-em)]](https://www.rsc.org/images/entities/char_2009.gif) 259 259 |
139![[thin space (1/6-em)]](https://www.rsc.org/images/entities/char_2009.gif) 251 251 |
112 | Yes | MSD01 |
| MH50495 CSO108 | MFWQTC | ||||||
| MSD13 | 13 | Manhole | 53![[thin space (1/6-em)]](https://www.rsc.org/images/entities/char_2009.gif) 542 542 |
73![[thin space (1/6-em)]](https://www.rsc.org/images/entities/char_2009.gif) 666 666 |
55 | No | MSD02 |
| MH23290 | DRGWQTC | ||||||
| MSD14 | 14 | Manhole | 61![[thin space (1/6-em)]](https://www.rsc.org/images/entities/char_2009.gif) 837 837 |
46![[thin space (1/6-em)]](https://www.rsc.org/images/entities/char_2009.gif) 659 659 |
37 | No | MSD02 |
| MH57769 | DRGWQTC | ||||||
| MSD15 | 15 | Manhole | 63![[thin space (1/6-em)]](https://www.rsc.org/images/entities/char_2009.gif) 642 642 |
22![[thin space (1/6-em)]](https://www.rsc.org/images/entities/char_2009.gif) 437 437 |
23 | No | MSD02 |
| MH57350 | DRGWQTC | ||||||
| MSD16 | 16 | Manhole | 49![[thin space (1/6-em)]](https://www.rsc.org/images/entities/char_2009.gif) 031 031 |
8071 | 3 | Yes | MSD01 |
| MH71910 CSO146 | MFWQTC | ||||||
| MSD17 | 17 | Manhole | 24![[thin space (1/6-em)]](https://www.rsc.org/images/entities/char_2009.gif) 084 084 |
20![[thin space (1/6-em)]](https://www.rsc.org/images/entities/char_2009.gif) 832 832 |
12 | Yes | MSD01 |
| MH70101 | MFWQTC | ||||||
2.3. Solids sample collection and handling
Solid samples (N = 42) were collected from five wastewater treatment plants twice a week from November 30, 2020 to December 16, 2020. Site MSD01 uses an anaerobic digestion process, and three sample types within this treatment system were collected: primary sludge, wastewater activated sludge, and centrifuge cake. The four regional treatment plants (MSD02, MSD03, MSD04, and MSD05) use an aerobic digestion process (with atmospheric air added to keep odors down), only one type of solid sample could be collected.2.4. Wastewater sample concentration, extraction, and PCR quantification
Our wastewater sample analysis method was published by Rouchka et al.14 within the guidelines developed by Pecson et al.15 In brief, we processed samples within 12 h of collection, used polyethylene glycol (PEG) precipitation, and performed quantification in triplicate by quantitative reverse transcription polymerase chain reaction (RT-qPCR). Standard published primer/probe sets were used as targets (ESI† B). Data for SARS-CoV-2 (N1), pepper mild mottle virus (PMMoV), and cross-assembly phage (CrAssphage) targets are reported in copies per ml of wastewater. The threshold value, as recommended by Klymus et al.,16 for N1 assays was 7.5 copies per ml.2.5. Solids sample concentration, extraction, and PCR quantification
The solid samples were shipped overnight on ice and analyzed at Verily Life Sciences (California, USA), following the method described by Graham et al.17 In brief, the process involves concentrating the solids in the sample, removing the water, and then extracting the RNA from the solids. Samples were run with 10 extractions, each with 10 droplet digital polymerase chain reaction assays. Coronavirus recovery was assessed using bovine coronavirus (BCoV). Data for the SARS-CoV-2 nucleocapsid (N) gene and PMMoV targets were reported as gc g−1 dry weight. Although the N gene assay is not the same as N1 or N2, it overlaps some with N1.182.6. Residences without sewer connections
To calculate the number of homes without sewer connections, and thus residences excluded from wastewater monitoring in the study area, a list of known addresses without a public service connection was provided by MSD for Louisville/Jefferson County as of February 16, 2021. Data included addresses, associated treatment plants, and property class codes. Property class codes of residential households that were most likely to have flushing toilets were isolated. These addresses were then geocoded in ArcGIS to the 17 wastewater sewersheds sampled in this study.2.7. COVID-19 infected individuals within the sampled sewer service area
Louisville/Jefferson County reported daily COVID-19 infected individuals from August 17, 2020 to April 5, 2021 were retrieved from publicly available data by the Louisville/Jefferson County Information Consortium and Louisville Metro Department of Public Health and Wellness.19 At the time of this study, the positive case rate data were not geocoded to the sewershed area.2.8. Statistical analysis
The wastewater data comprised of date, sample location type (i.e., manhole, pump station, and treatment plant), sample collection method (i.e., composite, grab), and sample temperature at collection. The SARS-CoV-2, PMMoV, and CrAssphage concentrations were the outcome variables in this study. PMMoV and CrAssphage, as human fecal indicators, are independent of monitoring SARS-CoV-2 concentrations in wastewater. Since the RNA concentrations measured in copies per ml of wastewater were highly skewed, loge transformations were used to normalize the data for statistical analysis.The solid data comprised of date, sample location (five levels), and sample type (i.e., anaerobic centrifuge cake, anaerobic primary sludge, anaerobic waste activated sludge, or aerobic digesters). The outcome variables included the concentrations of the N gene and PMMoV. Data were loge-transformed to achieve approximate normality. The solid sample data (N = 42) set were too small for statistical analysis.
Only quantifiable wastewater data, that is, data above the limit of quantification (LOQ), were used for statistical analyses. Of the total samples collected (N = 823), 88% (N = 727) had quantifiable data for each SARS-CoV-2, PMMoV, and CrAssphage targets (ESI† Table A1). From the excluded results, more often (86/96 excluded samples) were attributed to SARS-CoV-2, which was the most important target. First, significant differences among groups were tested using generalized linear models (GLM). Levene's test was also performed to assess the homogeneity of variances across different select groups.20 To perform t-tests and compare the means of the two groups, the within-group variances were first assessed to be homogeneous using Levene's test. The t-test was conducted only when the homogeneity of variances was verified using Levene's test. If the variances were heterogeneous, the Kruskal–Wallis non-parametric one-way test was used to check for significant effects. Temporal variability over the study period was also analyzed across the different groups. The data were grouped based on site or population group and the best fit of the loge concentrations as a function of time was plotted. A natural cubic spline fit was used when it was significantly different from a linear fit (no slope) model to account for seasonal trends. Correlation analyses were used to test the similarities among the different sites and spatial correlations among the adjacent sites for date pairs. Then it was further determined whether the variability of SARS-CoV-2 RNA concentrations could be attributed to sewershed site type (i.e., manhole, pump station, and treatment plant). Aggregated treatment plant concentrations were compared with the mean nested upstream contributing sewersheds. The results were declared significant at a 5% level of significance.21 The data analysis for this study was generated using Statistical Analysis System (SAS) software (version 9.4; Cary, N.C., USA).22 The plots were produced in R studio (version 1.4.1106; R Core Team, Vienna, Austria)23 using ggplot2.24 In the figures, le (log base e) represents the loge-transformed data.
2.9. Ethics
The University of Louisville Institutional Review Board classified this project as non-human subject research (reference #: 717950).3. Results
Over the study period, untransformed triplicate data (i.e., viral gene copies per ml wastewater) for SARS-CoV-2 ranged from 8 to 22![[thin space (1/6-em)]](https://www.rsc.org/images/entities/char_2009.gif) 707 copies per ml, PMMoV ranged from 102 to 108 copies per ml, and CrAssphage ranged from 103 to 108 copies per ml (ESI† Table C1). In the solid samples, untransformed data for the N gene ranged from 2833 to 80
707 copies per ml, PMMoV ranged from 102 to 108 copies per ml, and CrAssphage ranged from 103 to 108 copies per ml (ESI† Table C1). In the solid samples, untransformed data for the N gene ranged from 2833 to 80![[thin space (1/6-em)]](https://www.rsc.org/images/entities/char_2009.gif) 974 gc g−1 dry weight and PMMoV ranged from 107 to 108 gc g−1 dry weight (ESI† Table C2).
974 gc g−1 dry weight and PMMoV ranged from 107 to 108 gc g−1 dry weight (ESI† Table C2).
3.1. Time series trends in wastewater samples
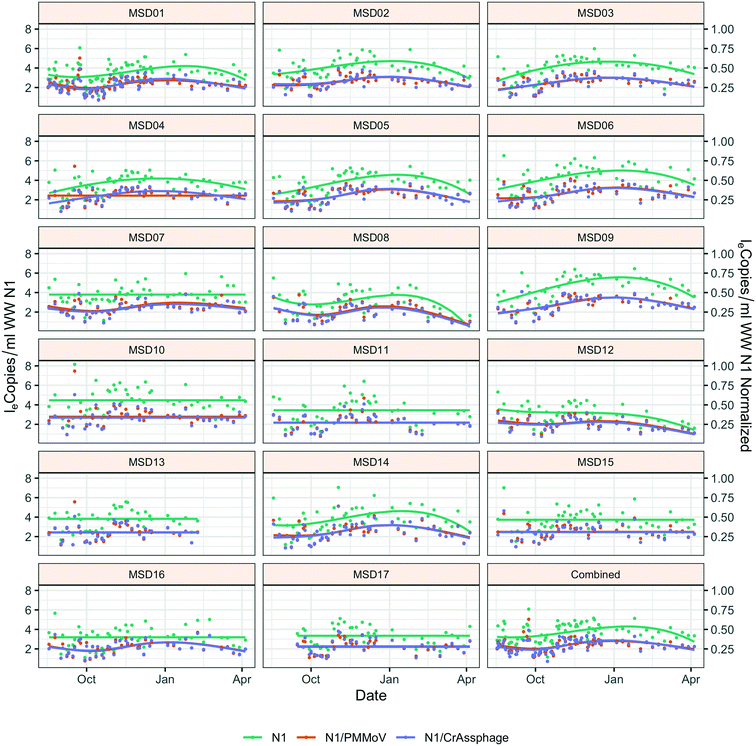
Throughout the study period, the sewershed site-specific loge SARS-CoV-2 concentrations did not have the same temporal trends; seven of the 17 sites had no significant time effect, and each of these were community sites (Fig. 2). Similar trend lines are mostly observed across sites for normalized loge SARS-CoV-2 by fecal indicators loge PMMoV and loge CrAssphage. The infected individuals within the county compared to the mean county level wastewater results both showed a winter season peak (ESI† Fig. C1).Due to the significant time effect, the comparison of grab and composite sample collection was not direct, yet the grab collection method (collected in the morning) had significantly smaller loge concentrations than the composite method: loge SARS-CoV-2 p-value = 0.040; loge SARS-CoV-2 normalized by loge PMMoV p-value = 0.014; and loge SARS-CoV-2 normalized by loge CrAssphage p-value = 0.017 (ESI† Table C3).
3.2. Concentration of SARS-CoV-2 wastewater across sewershed area
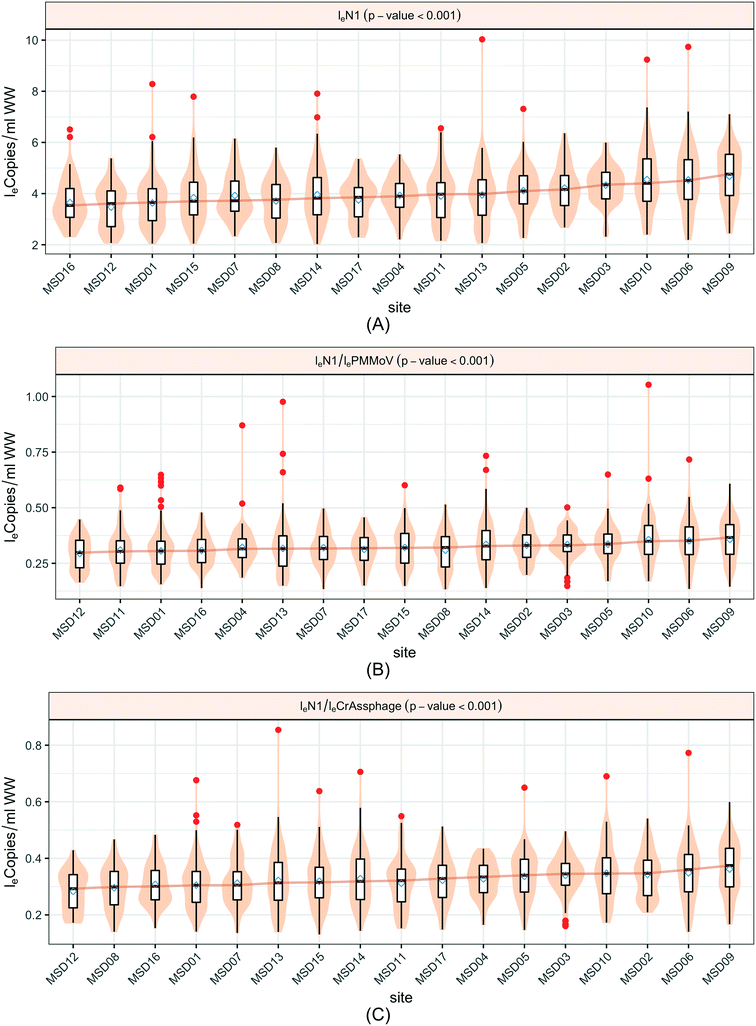
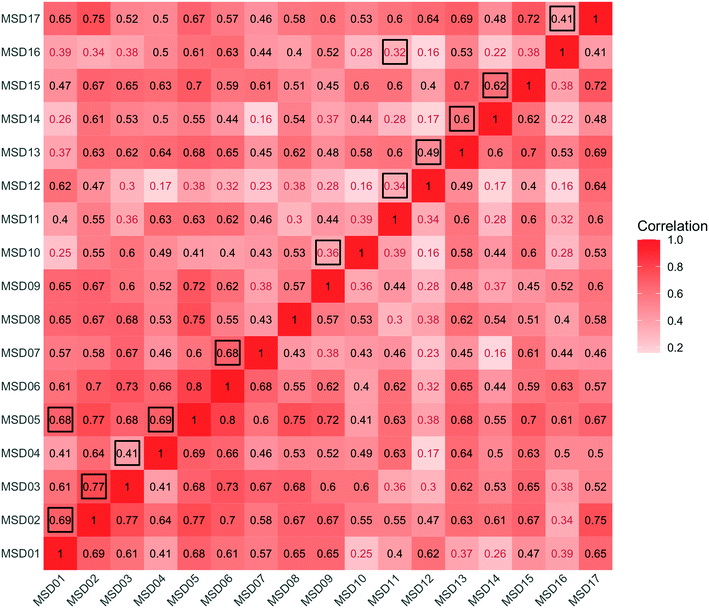
An analysis across the 17 sewershed areas indicated significant variability in the SARS-CoV-2 RNA concentration in the wastewater samples (Fig. 3). The Levene test to check variance homogeneity across sites indicated unequal variances (p-value < 0.001). Further comparison of the loge concentration distributions at different sites using the Kruskal–Wallis non-parametric test indicated that the sites were significantly different (p-value < 0.001). The lowest median loge SARS-CoV-2 concentration was at MSD16, while the largest was at MSD09, both of which are community manhole locations. Although the median concentration value order across sites changes before and after normalization by the fecal indicators, the sites remain statistically significant irrespective of this, and community street line manhole locations are consistently at the top and bottom of this ranking.A spatial correlation analysis for every pair of sites was conducted to assess similarities by date-pairing samples across the 17 sampling sites (Fig. 4; ESI† Fig. C2 and C3). Twenty-five sampling event pairs were possible. While treatment plants (MSD01 to MSD05) had similar sewage infrastructure, high pairwise correlation values (>0.7) for SARS-CoV-2 RNA (N1) were observed only between MSD02 and MSD03 and MSD02 and MSD05. When examining correlation values for SARS-CoV-2 RNA (N1) corresponding to community sites (MSD06 to MSD17) similar sewage infrastructure did not universally have a high pairwise correlation, and for those sites that were geographically adjacent none showed high pairwise correlation values (>0.7).
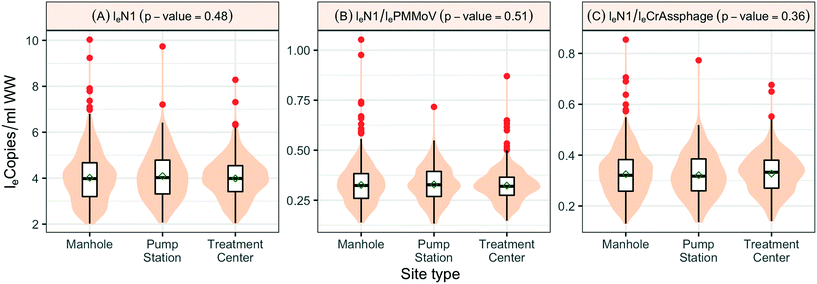
When SARS-CoV-2 RNA levels were grouped based on the sample location type (manhole, pump station, or treatment plant) within the sanitation system, Levene's test was used to check the homogeneity of variance, where a p-value < 0.001 implied considerable heterogeneity. A Kruskal–Wallis test was used to determine any significant differences between the distribution of SARS-CoV-2 RNA concentrations among the site types and concluded that the site type does not have a considerable influence on distributions (p-value = 0.48). Similar tests based on loge SARS-CoV-2 normalized by fecal indicators loge PMMoV and loge CrAssphage indicate no significant difference among the overall distribution across different location types, the p-values in both cases were greater than 0.1 (Fig. 5).
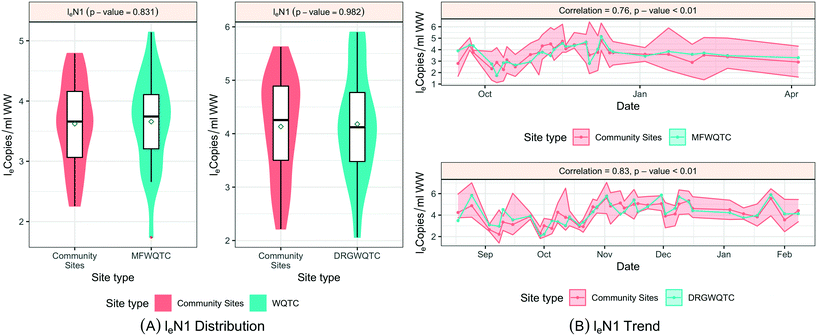
To examine SARS-CoV-2 RNA concentrations across the sewershed area (comparing downstream aggregated treatment plant to nested upstream contributing sewersheds), two treatment plants, MSD01 and MSD02, allowed for a detailed review. At MSD01 (MFWQTC), there were seven corresponding (nested) community sites, and at MSD02 (DRGWQTC), there were five corresponding community sites. In both cases, the distributions of the mean SARS-CoV-2 RNA concentrations in the community sites with the respective treatment plants were not statistically different (Kruskal–Wallis test; p-values > 0.8). Temporally, there were high pairwise correlation values (>0.7) at the treatment plants in comparison with the mean of those at the contributing community sites (correlation corresponding to the treatment plant MSD01 was 0.76 with a p-value < 0.01, while for the treatment plant MSD02 was 0.80 with a p-value < 0.01) (Fig. 6; ESI† Fig. C4 and C5).
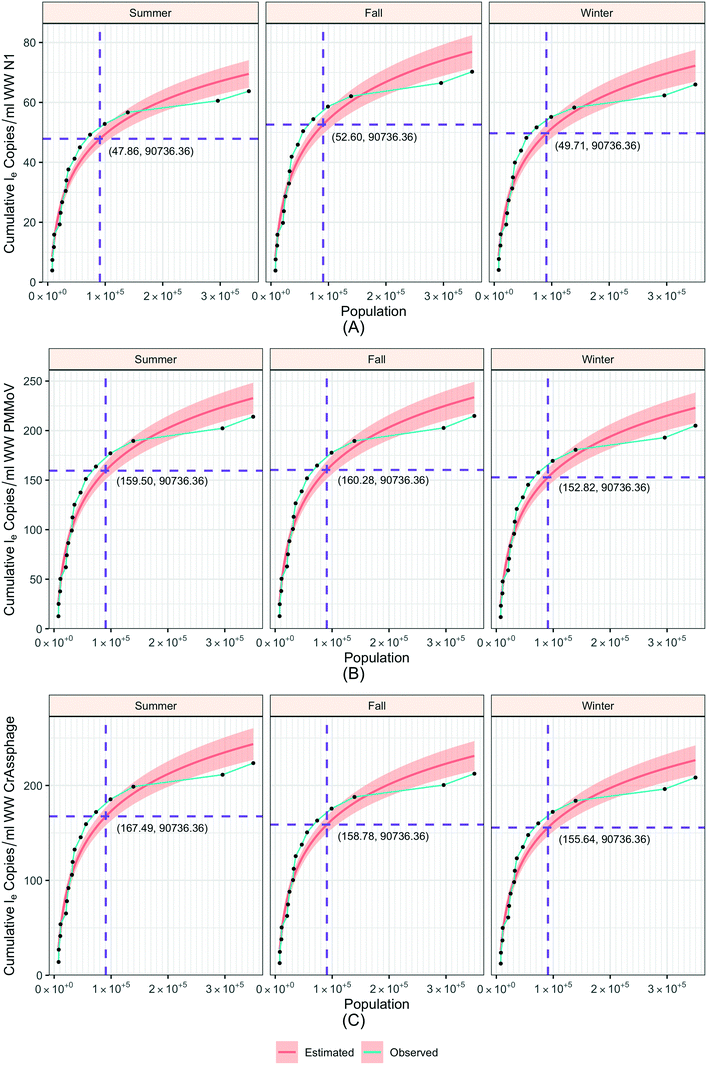
3.3. Sensitivity of detected wastewater concentrations versus sewershed population size
To understand the relationship between the population number within a sewershed area and the corresponding RNA concentration, the cumulative loge SARS-CoV-2 concentration averaged over time of the measurements was plotted against population size and compared to an estimated expected value (Fig. 7). This was also replicated for loge PMMoV, and loge CrAssphage cumulative concentration.The time effect was accounted for by grouping data based on the season: summer (August 17–September 16), fall (September 17–December 21), and winter (December 22–March 21). The catchment areas were sorted in increasing order of population size, and the mean over time cumulative le copies per ml of wastewater SARS-CoV-2 RNA (N1) starting from the least populated site was computed in the left-most point, and iteratively added through to the most populated site in the right-most point. The mean le copies per ml of SARS-CoV-2 RNA (N1) for a specific site can be obtained by subtracting the Y-axis value for the previous site from that of the current site. The estimation model used to generate this plot is the cumulative log concentration of SARS-CoV-2 RNA as a linear function of the log10 population (eqn (1)).
| Cum le N1 copies per ml = β0 + β1 × l10 Population | (1) |
 , or
, or  .
.
For smaller populations, the cumulative concentration increases rapidly, while the increment decreases for larger population levels. These results indicate that the effect of population on wastewater SARS-CoV-2 concentration is more prominent for smaller than larger sewershed areas. Furthermore, considering temporal variability of detected concentrations versus population, when population is grouped into the intervals ≤30![[thin space (1/6-em)]](https://www.rsc.org/images/entities/char_2009.gif) 000, 30
000, 30![[thin space (1/6-em)]](https://www.rsc.org/images/entities/char_2009.gif) 000 to 100
000 to 100![[thin space (1/6-em)]](https://www.rsc.org/images/entities/char_2009.gif) 000, and ≥100
000, and ≥100![[thin space (1/6-em)]](https://www.rsc.org/images/entities/char_2009.gif) 000 individuals contributing to a sewershed, the SARS-CoV-2 RNA (N1) and normalized concentrations were significantly different (p-value < 0.01) (ESI† Fig. C6).
000 individuals contributing to a sewershed, the SARS-CoV-2 RNA (N1) and normalized concentrations were significantly different (p-value < 0.01) (ESI† Fig. C6).
3.4. Presence of SARS-CoV-2 in date paired solid and wastewater samples
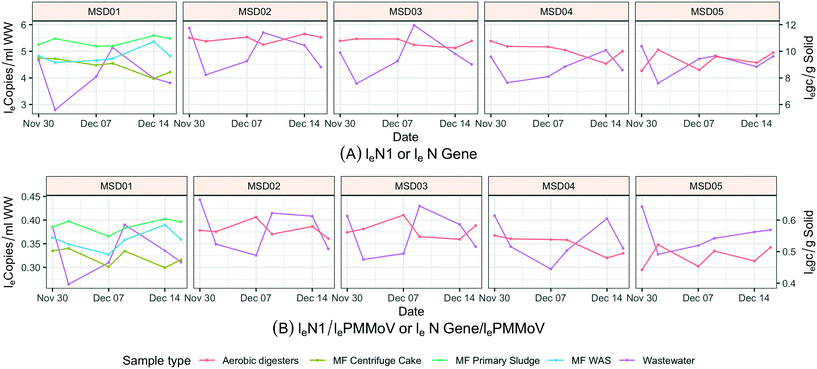
Sewage solids and influent wastewater results from treatment plants were paired by date (Fig. 8). When increasing SARS-CoV-2 RNA (N1) was observed in influent wastewater, a similar increasing trend was not necessarily observed in solid (N gene) samples at the same treatment center. This observation was performed for both aerobic and anaerobic solid samples. At MSD01, where different treatment stages could be sampled, on a low-flow day solids would turnover every couple of days and during a high-flow (wet weather) day they would turnover in about 12 h; still none of the different treatment stages within the same facility showed similar trends to the 24 h influent wastewater results. Furthermore, at MSD01 (industrial input of approximately 10%; a combined sewer system), the low loge SARS-CoV-2 RNA (N1) normalized by loge PMMoV in influent wastewater was from December 2, a low concentration trend that is not observed in solids despite the short turnover time. The results indicate that sewage solids and influent wastewater media should not be intermingled when comparing daily concentration variations.3.5. Sample temperature at time of collection
At the time of collection, the loge SARS-CoV-2 RNA (N1) (p-value < 0.001), loge PMMoV (p-value = 0.008), and loge CrAssphage (p-value = 0.014) varied significantly with sample temperature (ESI† Table C7). The loge SARS-CoV-2 RNA (N1) concentration decreased with an increase in sample collection temperature.As composite samples were stored in an ice bath, these samples were more likely to be at a cooler temperature than grab samples at the time of collection. Composite samples (N = 630) had a mean temperature of 38.1 °F, whereas grab samples (N = 23) had a mean temperature of 46.2 °F. Sewer infrastructure, especially depth from the ground surface and flow rates, as a function of distinct urban sewersheds, may account for some of the range in differences in sample temperature at the time of collection.
3.6. Residences without sewer connections, by sewershed
The results indicate 9947 residential properties were without sewer connections in the county (ESI† Table D1). Although some properties contained more than one household, a majority (73%) were classified as single-family residences. Because the county has 316![[thin space (1/6-em)]](https://www.rsc.org/images/entities/char_2009.gif) 174 household residences, those without sewer connections represent only approximately 3% of the total residences and were therefore excluded from sampling activities. About half of these properties without sewer connections were within either of the two largest water quality treatment plant service areas within the urban center: MSD01 and MSD02. There is also a geographic gap in MSD service coverage over the rural southeast portion of the county, but the gap does not contain a high number of residences. Residences without sewer connections were not captured in other ways in the sewer system, as MSD does not currently accept hauled waste at any treatment center, although a few permitted industrial users collect from septic tanks, portable toilets, and grease traps, and then perform primary treatment prior to discharge to MSD.
174 household residences, those without sewer connections represent only approximately 3% of the total residences and were therefore excluded from sampling activities. About half of these properties without sewer connections were within either of the two largest water quality treatment plant service areas within the urban center: MSD01 and MSD02. There is also a geographic gap in MSD service coverage over the rural southeast portion of the county, but the gap does not contain a high number of residences. Residences without sewer connections were not captured in other ways in the sewer system, as MSD does not currently accept hauled waste at any treatment center, although a few permitted industrial users collect from septic tanks, portable toilets, and grease traps, and then perform primary treatment prior to discharge to MSD.
4. Discussion
This study fills an important gap in the literature, and these results may inform other system-wide strategies for sampling wastewater for non-SARS-CoV-2 targets across urban sewershed scales. The finding that the changes in SARS-CoV-2 concentration become less dynamic with an increasing population in the sewershed area has important implications for estimating the incidence of SARS-CoV-2 infections. This important aspect of SARS-CoV-2 concentration and population size was also found by Rusiñol et al.25 for small treatment plants (representing <24![[thin space (1/6-em)]](https://www.rsc.org/images/entities/char_2009.gif) 000 individuals) which had lower median loads of SARS-CoV-2 RNA than larger treatment plants. Likewise, our results are consistent with Haak et al.9 showing nested individual community sites with smaller populations having more peaks and valleys compared to treatment plant concentrations and with Weidhaas et al.12 that, in some cases, higher SARS-CoV-2 levels were found in contributing sample locations than in aggregate sample locations. Furthermore, in raw wastewater, Nagarkar et al.11 in a study of three sewersheds (two treatment plants in which one had a sub-sewershed also sampled) noted that normalization factors for correlating wastewater and clinical COVID-19 case data may not universally apply to individual sewersheds. We also did not find a high pairwise correlation spatial trend; although Haak et al.9 noted that, the most distant sewershed sampling sites were more poorly correlated to treatment plant influent. Beyond SARS-CoV-2 sampling strategies, Teerlink et al.5 also observed for trace organic chemical concentrations less variable treatment plant influent concentrations associated with dispersion and mixing when compared to sewershed scales.
000 individuals) which had lower median loads of SARS-CoV-2 RNA than larger treatment plants. Likewise, our results are consistent with Haak et al.9 showing nested individual community sites with smaller populations having more peaks and valleys compared to treatment plant concentrations and with Weidhaas et al.12 that, in some cases, higher SARS-CoV-2 levels were found in contributing sample locations than in aggregate sample locations. Furthermore, in raw wastewater, Nagarkar et al.11 in a study of three sewersheds (two treatment plants in which one had a sub-sewershed also sampled) noted that normalization factors for correlating wastewater and clinical COVID-19 case data may not universally apply to individual sewersheds. We also did not find a high pairwise correlation spatial trend; although Haak et al.9 noted that, the most distant sewershed sampling sites were more poorly correlated to treatment plant influent. Beyond SARS-CoV-2 sampling strategies, Teerlink et al.5 also observed for trace organic chemical concentrations less variable treatment plant influent concentrations associated with dispersion and mixing when compared to sewershed scales.
The nonlinear relationship between the sewershed area population and the cumulative amount of SARS-CoV-2, PMMoV, and CrAssphage in the wastewater suggests that the sampling frame has a significant bearing on sensitivity. Specifically, small sewershed areas are highly sensitive to incremental contributions, while the largest aggregation sites are relatively less sensitive. The COVID-19 pandemic has involved cycles of infection increase and decrease, which could affect the population sensitivity curve. These cycles roughly corresponded to the seasons, with peak infection in winter. Across seasons, to the left or right of this inflection, the measures are either very sensitive, generating high variability, or too dampened, which indicates that small changes in community infection will be more difficult to discern. This pattern was repeated by the other two fecal markers, which were not likely to be affected by COVID-19 infection patterns.
Nourinejad et al.26 have advocated for the use of in-sewer SARS-CoV-2 network sensors, and our results suggest that such sensors would be best placed across different population levels rather than in street line locations of similar populations. Additionally, Larson et al.27 suggested that a sampling of 5 to 10 community locations might be required to iteratively find a COVID-19 “patient zero”. Even though a similar number of sample locations were used, our work suggests that there is greater utility in consistently sampling 12 community sites and not moving them.
The solids and wastewater influent data showed inconsistent paired temporal trends, though additional data may provide a clearer picture. The COVID-19 pandemic has often required the triangulation of different environmental health data, and it is expected that solids and wastewater do not have similar results. Wolfe et al.28 and Graham et al.17 reported settled solids as a more sensitive approach than measuring SARS-CoV-2 in wastewater influent for the association with clinical case rates of COVID-19. However, in our study, solid samples could be collected only at treatment plants and therefore could not estimate SARS-CoV-2 abundance changes as a function of the urban sewer system sewershed scale from manholes and pump stations; thus, the utility of solid samples in the overall study design as a function of distinct urban sewer size is limited by the logistics of the existing sewer infrastructure.
While Rusiñol et al.25 proposed that at low COVID-19 community rates, small treatment plants are less informative than large treatment plants, in our study, the limit of detection was not a concern even for sewersheds serving <8000 people, demonstrating the value of capturing sewershed level population variation within the sanitation system. Likewise, determining who was excluded from the study area requires knowing properties related to who is, and who is not connected to the sanitation system being sampled. The United Nations Children's Fund (UNICEF) and World Health Organization29 report sewer connections in the United States were estimated to account for 85% of the population, with 15% using septic tanks and less than 1% using other improved sanitation facilities (including shared). Some areas of Kentucky are known to have a gap in access, with both straight pipes and failing septic tanks in many areas.30 However, Louisville/Jefferson County has a higher proportion of sewer connections. Although some places were missed, the sewershed areas studied here offer approximately 97% household coverage, which allowed us to reliably monitor the abundance of SARS-CoV-2 RNA in a large urban area.
5. Limitations
Despite its many strengths, this study has some limitations. Due to the difficulty in selecting community sewershed areas that had perfectly isolated boundaries, there was some overlap between the above-ground geographic borders. The demonstration and duration of shedding by COVID-19 infected persons is highly individual and can continue even after testing negative for SARS-CoV-2 in respiratory samples.1,2 In theory, RNA measured in wastewater samples is primarily a subset of infected individuals at an unidentified temporal range of their peak fecal shedding period. The scope of this study was the SARS-CoV-2 RNA abundance in wastewater as a function of distinct urban sewersheds, and future research is required to compare the reported Louisville/Jefferson County COVID-19 case numbers with the concurrent randomized nasal diagnostic clinical study by sewershed. Additionally, pipe length data from the sample locations to treatment plants was not available.6. Conclusion
The results of this study show that selecting the scale of urban sewershed matters, data resolution that is lost when sampling only a single sewershed size. Our results indicate that the sewersheds differ in SARS-CoV-2 trends; however, high pairwise correlation spatial trends were not observed, and the mean SARS-CoV-2 RNA concentrations of smaller upstream community sewershed areas did not differ from their respective treatment centers. Solid samples could only be collected at treatment plants, therefore not allowing us to evaluate SARS-CoV-2 abundance as a function of the sewershed scale. The population size sensitivity of SARS-CoV-2 concentration detection is non-linear: at low population levels the measures are either too sensitive and generate a high level of variability, or at high population levels the estimates are dampened making small changes in community infection levels more difficult to discern. Our results suggest sampling an equal range of populations over time is most likely to provide robust estimates of changes in prevalence. The results also suggest that there is limited benefit in oversampling small populations. This study and its findings may inform other system-wide strategies for sampling wastewater for estimating non-SARS-CoV-2 targets.Funding
This work was supported by a contract from the Louisville-Jefferson County Metro Government as a component of the Coronavirus Aid, Relief, and Economic Security Act, as well as grants from the James Graham Brown Foundation and the Owsley Brown II Family Foundation. The funders had no role in the study design, data collection and analysis, decision to publish, or preparation of the manuscript.Author contributions
Conceptualization: R. H. H. and T. S.; formal analysis: A. M., J. P. R., and S. N. R.; methodology: R. H. H.; writing-original draft preparation: R. H. H.; writing-review and editing: R. H. H., A. M., J. P. R., R. A. Y., D. T., S. N. R., A. B., and T. S.; supervision: A. B. and T. S.; project administration: T. S. All authors have read and agreed to the published version of the manuscript.Conflicts of interest
The authors declare that they have no known competing financial interests or personal relationships that could have appeared to influence the work reported in this paper.Acknowledgements
We thank our field and analytical team Dwight Mitchell, Donald Golightly, Brian Sivado, David Hoetker, Rick Strehl, supporting MSD Operations Field Services staff and the Fuqua Lab at the Center for Predictive Medicine for their diligent commitment to this work.References
- N. M. Vaselli, W. Setiabudi, K. Subramaniam, E. R. Adams, L. Turtle, M. Iturriza-Gómara, T. Solomon, N. A. Cunliffe, N. French and D. Hungerford, Investigation of SARS-CoV-2 Faecal Shedding in the Community: A Prospective Household Cohort Study (COVID-LIV) in the UK. 2021, BMC Infect. Dis., 2021, 21, 784 CrossRef CAS PubMed.
- Y. Zhang, M. Cen, M. Hu, L. Du, W. Hu, J. J. Kim and N. Dai, Prevalence and persistent shedding of fecal SARS-CoV-2 RNA in patients with COVID-19 infection: A systematic review and meta-analysis. Clinical and Translational, Gastroenterology, 2021, 12(4), e00343 Search PubMed.
- F. Wu, J. Zhang, A. Xiao, X. Gu, W. L. Lee, F. Armas, K. Kauffman, W. Hanage, M. Matus, N. Ghaeli and N. Endo, SARS-CoV-2 titers in wastewater are higher than expected from clinically confirmed cases, mSystems, 2020, 5(4), e00614–e00620 CAS.
- R. Yeager, R. H. Holm, K. Saurabh, J. L. Fuqua, D. Talley, A. Bhatnagar and T. Smith, Wastewater Sample Site Selection to Estimate Geographically-Resolved Community Prevalence of COVID-19: A Sampling Protocol Perspective, GeoHealth, 2021, e2021GH000420 CAS.
- J. Teerlink, A. S. Hering, C. P. Higgins and J. E. Drewes, Variability of trace organic chemical concentrations in raw wastewater at three distinct sewershed scales, Water Res., 2012, 46(10), 3261–3271 CrossRef CAS PubMed.
- P. K. Cornejo, Q. Zhang and J. R. Mihelcic, How does scale of implementation impact the environmental sustainability of wastewater treatment integrated with resource recovery?, Environ. Sci. Technol., 2016, 50(13), 6680–6689 CrossRef CAS PubMed.
- K. D. Orner, O. Y. Ozcan, D. Saetta, T. H. Boyer, D. H. Yeh, D. Anderson and J. A. Cunningham, House of quality planning matrix for evaluating wastewater nutrient management technologies at three scales within a sewershed, Environ. Eng. Sci., 2017, 34(11), 773–784 CrossRef CAS.
- P. M. D'Aoust, S. T. Towhid, É. Mercier, N. Hegazy, X. Tian, K. Bhatnagar, Z. Zhang, C. C. Naughton, A. E. MacKenzie, T. E. Graber and R. Delatolla, COVID-19 wastewater surveillance in rural communities: Comparison of lagoon and pumping station samples, Sci. Total Environ., 2021, 801, 149618 CrossRef PubMed.
- L. Haak, B. Delic, L. Li, T. Guarin, L. Mazurowski, N. G. Dastjerdi, A. Dewan and K. Pagilla, Spatial and temporal variability and data bias in wastewater surveillance of SARS-CoV-2 in a sewer system, Sci. Total Environ., 2022, 805, 150390 CrossRef CAS PubMed.
- S. W. Hasan, Y. Ibrahim, M. Daou, H. Kannout, N. Jan, A. Lopes, H. Alsafar and A. F. Yousef, Detection and quantification of SARS-CoV-2 RNA in wastewater and treated effluents: Surveillance of COVID-19 epidemic in the United Arab Emirates, Sci. Total Environ., 2021, 764, 142929 CrossRef CAS PubMed.
- M. Nagarkar, S. P. Keely, M. Jahne, E. Wheaton, C. Hart, B. Smith, J. Garland, E. A. Varughese, A. Braam, B. Wiechman and B. Morris, SARS-CoV-2 monitoring at three sewersheds of different scales and complexity demonstrates distinctive relationships between wastewater measurements and COVID-19 case data, Sci. Total Environ., 2021, 151534 Search PubMed.
- J. Weidhaas, Z. T. Aanderud, D. K. Roper, J. VanDerslice, E. B. Gaddis, J. Ostermiller, K. Hoffman, R. Jamal, P. Heck, Y. Zhang and K. Torgersen, Correlation of SARS-CoV-2 RNA in wastewater with COVID-19 disease burden in sewersheds, Sci. Total Environ., 2021, 775, 145790 CrossRef CAS PubMed.
- U.S. Census Bureau, 2018 American Community Survey (ACS), U.S. Department of Commerce, 2020, https://www.census.gov/data/developers/data-sets/acs-5year.html (accessed 21.06.21) Search PubMed.
- E. C. Rouchka, J. H. Chariker, K. Saurabh, S. Waigel, W. Zacharias, M. Zhang, D. Talley, I. Santisteban, M. Puccio, S. Moyer, R. H. Holm, R. A. Yeager, K. J. Sokoloski, J. Fuqua, A. Bhatnagar and T. Smith, The Rapid Assessment of Aggregated Wastewater Samples for Genomic Surveillance of SARS-CoV-2 on a City-Wide Scale, Pathogens, 2021, 10(10), 1271 CrossRef CAS PubMed.
- B. M. Pecson, E. Darby, C. N. Haas, Y. M. Amha, M. Bartolo, R. Danielson, Y. Dearborn, G. Di Giovanni, C. Ferguson, S. Fevig, E. Gaddis, D. Gray, G. Lukasik, B. Mull, L. Olivas, A. Olivieri and Y. Qu, Reproducibility and sensitivity of 36 methods to quantify the SARS-CoV-2 genetic signal in raw wastewater: findings from an interlaboratory methods evaluation in the US, Environ. Sci.: Water Res. Technol., 2021, 7(3), 504–520 RSC.
- K. E. Klymus, C. M. Merkes, M. J. Allison, C. S. Goldberg, C. C. Helbing, M. E. Hunter, C. A. Jackson, R. F. Lance, A. M. Mangan, E. M. Monroe and A. J. Piaggio, Reporting the limits of detection and quantification for environmental DNA assays, Environ. DNA, 2020, 2(3), 271–282 CrossRef.
- K. E. Graham, S. K. Loeb, M. K. Wolfe, D. Catoe, N. Sinnott-Armstrong, S. Kim, K. M. Yamahara, L. M. Sassoubre, L. M. Mendoza Grijalva, L. Roldan-Hernandez, K. Langenfeld, K. R. Wigginton and A. B. Boehm, SARS-CoV-2 RNA in wastewater settled solids is associated with COVID-19 cases in a large urban sewershed, Environ. Sci. Technol., 2020, 55(1), 488–498 CrossRef PubMed.
- J. S. Huisman, J. Scire, L. Caduff, X. Fernandez-Cassi, P. Ganesanandamoorthy, A. Kull, A. Scheidegger, E. Stachler, A. B. Boehm, B. Hughes, A. Knudson, A. Topol, K. R. Wigginton, M. K. Wolfe, T. Kohn, C. Ort, T. Stadler and T. R. Julian, Wastewater-based estimation of the effective reproductive number of SARS-CoV-2, medRxiv, 2021, DOI:10.1101/2021.04.29.21255961v1 (accessed 15 December 2021).
- Louisville/Jefferson County Information Consortium and Louisville Metro Department of Public Health and Wellness, COVID-19 in Jefferson County KY, 2021, https://covid-19-in-jefferson-county-ky-lojic.hub.arcgis.com/ (accessed 2 December 2021) Search PubMed.
- H. Levene, Robust tests for equality of variances, in Contributions to probability and statistics; essays in honor of Harold Hotelling, Stanford University Press, Stanford, California, 1960 Search PubMed.
- G. Walker and J. Shostak, Common statistical methods for clinical research with SAS examples, SAS Institute, Cary, NC, 2010 Search PubMed.
- The SAS System V9.4, SAS Institute Inc., Cary, NC, 2003 Search PubMed.
- R Core Team. R: A language and environment for statistical computing, R Foundation for Statistical Computing, Vienna, Austria, 2019, URL https://www.R-project.org/ Search PubMed.
- H. Wickham, ggplot2: Elegant graphics for data analysis, Springer-Verlag, New York, 2016 Search PubMed.
- M. Rusiñol, I. Zammit, M. Itarte, E. Forés, S. Martínez-Puchol, R. Girones, C. Borrego, L. Corominas and S. Bofill-Mas, Monitoring waves of the COVID-19 pandemic: Inferences from WWTPs of different sizes, Sci. Total Environ., 2021, 787, 147463 CrossRef PubMed.
- M. Nourinejad, O. Berman and R. C. Larson, Placing sensors in sewer networks: A system to pinpoint new cases of coronavirus, PLoS One, 2021, 16(4), e0248893 CrossRef CAS PubMed.
- R. C. Larson, O. Berman and M. Nourinejad, Sampling manholes to home in on SARS-CoV-2 infections, PLoS One, 2020, 15(10), e0240007 CrossRef CAS PubMed.
- M. K. Wolfe, A. Archana, D. Catoe, M. M. Coffman, S. Dorevich, K. E. Graham, S. Kim, L. M. Grijalva, L. Roldan-Hernandez, A. I. Silverman, N. Sinnott-Armstrong, D. J. Vugia, A. T. Yu, W. Zambrana, K. R. Wigginton and A. B. Boehm, Scaling of SARS-CoV-2 RNA in Settled Solids from Multiple Wastewater Treatment Plants to Compare Incidence Rates of Laboratory-Confirmed COVID-19 in Their Sewersheds, Environ. Sci. Technol. Lett., 2021, 8(5), 398–404 CrossRef CAS.
- World Health Organization, Progress on household drinking water, sanitation and hygiene 2000-2020: five years into the SDGs, 2021, Geneva, https://data.unicef.org/resources/progress-on-household-drinking-water-sanitation-and-hygiene-2000-2020/ (accessed 15 December 2021) Search PubMed.
- Kentucky Water Resources Research Institute and University of Kentucky, PRIDE Water Quality Assessment Report: I. Problems and Programs, KWRRI Research Reports, 193, 2000, https://uknowledge.uky.edu/cgi/viewcontent.cgi?article=1192&context=kwrri_reports (accessed 15 December 2021) Search PubMed.
Footnote |
| † Electronic supplementary information (ESI) available. See DOI: 10.1039/d1ew00672j |
| This journal is © The Royal Society of Chemistry 2022 |

