 Open Access Article
Fluorescent molecular logic gates based on photoinduced electron transfer (PET) driven by a combination of atomic and biomolecular inputs†‡
Glenn D.
Wright
a,
Chao-Yi
Yao
a,
Thomas S.
Moody
b and
A. Prasanna
de Silva
 a
a
aSchool of Chemistry and Chemical Engineering, Queen's University, Belfast BT9 5AG, Northern Ireland, UK. E-mail: a.desilva@qub.ac.uk
bAlmac Sciences, Craigavon BT63 5QD, Northern Ireland, UK
First published on 5th May 2020
Abstract
Molecular AND logic gates 1, 3, 5 and 7, which are designed according to principles of photoinduced electron transfer (PET) switching, respond to co-existing Candida antarctica lipase B and H+ (and Na+).
Molecular logic-based computation1–4 requires gates to process and store information. Besides its ability to operate in biocompatible micrometric spaces, the diversity of information available to molecular logic distinguishes it from its semiconductor cousin which employs voltage information only. For instance, the inputs feeding gates can take the form of physical entities (e.g. light dose,5 temperature6), chemical species (e.g. atomic,1 molecular7) and biochemical species (e.g. nucleotides,8 enzymes3). However, there are hardly any examples of combined atomic and enzyme inputs in the literature, if at all.
Fluorescent PET switches grew out of the sensing literature.9 Although atomic inputs were present from the beginning,10 protein inputs were incorporated only recently.11 Even these covered only some receptor- and transport-proteins.§ A way to incorporate hydrolase enzymes was described by Ojida et al.12 and us.13 Here, a fluorescent PET system based on a ‘fluorophore-spacer-amine’ format relied on the upward shift of the amine's pKa value by ∼2 pH units upon hydrolyzing a neighbouring ester into a carboxylate anion. Now we show how such systems can serve as fluorescent molecular logic gates driven by atomic ions, H+ and Na+, and a hydrolase enzyme, Candida antarctica lipase B (CALB).
Logic gate 1¶ is synthesized by nucleophilic substitution of 4-bromomethyl-7-methoxycoumarin with sarcosine ethyl ester. 1 is a typical fluorescent PET ‘off–on’ switch of the ‘fluorophore-spacer–receptor’ format8 with H+ being the input. By itself, the 7-methoxycoumarin fluorophore has no significant interaction with H+ in the pH range of our experiments since it lacks a suitable receptor.141's pH-dependent fluorescence intensity (IF) is analysed according to eqn (1)14 to give pKa = 3.6. The fluorescence quantum yields are ΦFmax = 0.97 and ΦFmin = 0.02.
| log[(IFmax − IF)/(IF − IFmin)] = pH − pKa | (1) |
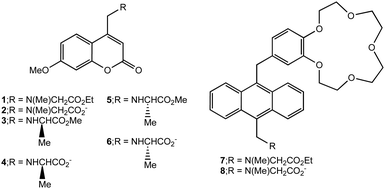 | ||
| Scheme 1 Structures of logic gates 1, 3, 5 and 7 and their hydrolysis products 2, 4, 6 and 8 respectively. | ||
| Gate | pKa | Φ max | Φ min | K M (10−5 M) | V max (10−9 M s−1) |
|---|---|---|---|---|---|
a In water![[thin space (1/6-em)]](https://www.rsc.org/images/entities/char_2009.gif) : :![[thin space (1/6-em)]](https://www.rsc.org/images/entities/char_2009.gif) methanol (4 methanol (4![[thin space (1/6-em)]](https://www.rsc.org/images/entities/char_2009.gif) : :![[thin space (1/6-em)]](https://www.rsc.org/images/entities/char_2009.gif) 1, v/v), except for 7 and 8 where water 1, v/v), except for 7 and 8 where water![[thin space (1/6-em)]](https://www.rsc.org/images/entities/char_2009.gif) : :![[thin space (1/6-em)]](https://www.rsc.org/images/entities/char_2009.gif) DMSO (1 DMSO (1![[thin space (1/6-em)]](https://www.rsc.org/images/entities/char_2009.gif) : :![[thin space (1/6-em)]](https://www.rsc.org/images/entities/char_2009.gif) 1, v/v) is used.
b Not determined, but all these values are expected to be close to those of 6.
c At 1.0 M Na+.
d At ∼0.0 M Na+. 1, v/v) is used.
b Not determined, but all these values are expected to be close to those of 6.
c At 1.0 M Na+.
d At ∼0.0 M Na+.
|
|||||
| 1 | 3.6 | 0.97 | 0.02 | 1.9 | 0.50 |
| 2 | 6.7 | 0.48 | 0.01 | — | — |
| 3 | 4.5 | 0.56 | 0.05 | 1.1 | 7.5 |
| 4 | —b | —b | —b | — | — |
| 5 | 4.5 | 0.57 | 0.07 | 1.6 | 97 |
| 6 | 7.1 | 0.20 | 0.01 | — | — |
| 7 | 5.8c | 0.18,c 0.16d | 0.09c | 0.22c | 0.75c |
| 8 | 8.8c | 0.15,c 0.12d | 0.06c | — | — |
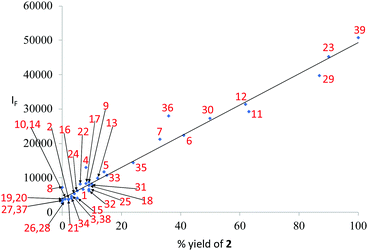
1 was subjected to an enzyme screen to see which enzyme would hydrolyze 1 most efficiently to 2 at pH 7 (Fig. 1). CALB was found to be the most efficient, which is gratifying since CALB is known17 to hydrolyze a variety of esters over a wide pH range. Additionally, it was found that the hydrolysis reaction could be most conveniently followed by the fluorescence emission signal (Fig. 1). Thus we realize that 1 becomes a ‘fluorophore–spacer1–receptor–spacer2–enzyme substrate’ system.
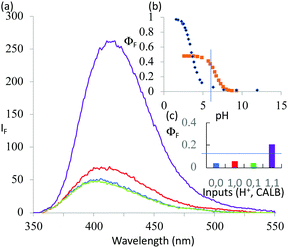
The fluorescence spectra of 1 at pH 6 and 10 with/without CALB exposure for 30 min are shown in Fig. 2a. The AND logic response of the fluorescence signal is clear since both H+ and CALB are needed to elicit a ‘high’ fluorescence response from 1. When exposed to CALB at pH 6, 1 gradually hydrolyzes to 2 and shows a gradual increase in fluorescence intensity. The 1–CALB interaction is governed by a Michaelis constant KM of 1.9 × 10⁻⁵ M and Vmax value of 5.0 × 10⁻¹⁰ M s−1. These values are obtained by applying eqn (2) to convert the rate of change of fluorescence intensity into the rate of change of the product 2 concentration, followed by the application of eqn (3).18
| V = d(2)/dt = [dIF/dt]·(1)t=0/{[(ΦF2/ΦF1) − 1]·IFt=0} | (2) |
| 1/V = [(KM/Vmax)/(1)] + 1/Vmax | (3) |
It is to be noted that the enzyme reaction is irreversible under our experimental conditions so that the logic device is suitable only for single-use situations. Such single-use situations are commonly present in the medical diagnostics sphere, as seen with two19- or three20 (Scheme 1).
Owing to the diversity available in inputs, outputs, power supplies and devices within molecular logic, several routes to reconfigurability have become available.2 However, we are not aware of any cases in the primary literature where logic is reconfigured by changing molecular configuration. Since the enantiodiscrimination of enzymes is well-established, we now have an opportunity to present such an approach.
The enantiomeric pair of logic gates 3¶ and 5¶ arise from a synthesis analogous to that of 1. The hydrolysis products of these are 4 and 6 respectively, although only 6 was available for pKa determination. pKa values are measured for these compounds with the aid of eqn (1), as done for 1 and 2. The values obtained for 3, 5 and 6 are 4.5, 4.5 and 7.1 respectively. The pKa value of 4 is expected to be the same as that found for its opposite enantiomer 6, i.e. 7.1.
As seen in Fig. 3a, the fluorescence spectra of 3 at pH 6 and 10 with/without CALB exposure for 30 min correspond to a PASS 0 logic action. On the other hand, Fig. 3b shows an AND logic action for 5. 3 and 5 differ in the configuration of the functional groups around the asymmetric carbon. Thus, logic reconfiguring is achieved by changing the molecular configuration of the device. At pH 6, KM values are not very different, i.e. 1.1 × 10⁻⁵ and 1.6 × 10⁻⁵ M, for 3 and 5 respectively. However, Vmax values differ significantly, i.e. 7.5 × 10⁻⁹ and 9.7 × 10⁻⁸ M s−1, as a result of CALB's enantioselectivity.
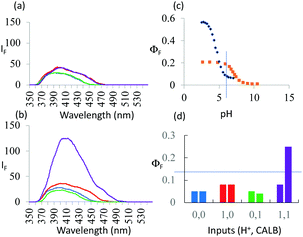 | ||
Fig. 3 (a) Fluorescence spectra of 7.3 × 10⁻⁶ M 3 under stimulation with H+ and CALB inputs for 30 min in water![[thin space (1/6-em)]](https://www.rsc.org/images/entities/char_2009.gif) : :![[thin space (1/6-em)]](https://www.rsc.org/images/entities/char_2009.gif) methanol (4 methanol (4![[thin space (1/6-em)]](https://www.rsc.org/images/entities/char_2009.gif) : :![[thin space (1/6-em)]](https://www.rsc.org/images/entities/char_2009.gif) 1, v/v) (λexc = 326 nm). ‘High’ and ‘low’ input levels are as in Fig. 2. Input states are coloured as in Fig. 2. The ‘high’ level of H+ input, 10−6 M, is chosen from the pH value at which maximum discrimination of the fluorescence signals between 5 and 6 is seen in (c). (b) Same as in (a) but for 5 instead of 3. (c) ΦF of 5 (black) and 6 (orange)as a function of pH. (d) Pictorial version of truth table showing ΦF values extracted from (a) and (b). Left-hand bars of each pair correspond to 3 whereas right-hand bars correspond to 5. Output threshold chosen at ΦF = 0.13. 1, v/v) (λexc = 326 nm). ‘High’ and ‘low’ input levels are as in Fig. 2. Input states are coloured as in Fig. 2. The ‘high’ level of H+ input, 10−6 M, is chosen from the pH value at which maximum discrimination of the fluorescence signals between 5 and 6 is seen in (c). (b) Same as in (a) but for 5 instead of 3. (c) ΦF of 5 (black) and 6 (orange)as a function of pH. (d) Pictorial version of truth table showing ΦF values extracted from (a) and (b). Left-hand bars of each pair correspond to 3 whereas right-hand bars correspond to 5. Output threshold chosen at ΦF = 0.13. | ||
We have explored the modularity of our design by building a prototype 3-input AND gate 7¶ of the ‘receptor1–spacer1–fluorophore–spacer2–receptor2–spacer3–enzyme substrate’ format, which is driven by CALB, H+ and Na+. The sensitivity of logic gate 7's fluorescence to Na+, cf. that of 1, arises from the new benzo-18-crown-6 ether functional group within 7.
7 is synthesized by reacting a known anthracene-crown ether conjugate21 with sarcosine ethyl ester. Its AND logic behaviour is shown in Fig. 4a and c. Its pKa = 5.8 (at 1.0 M Na+) in water![[thin space (1/6-em)]](https://www.rsc.org/images/entities/char_2009.gif) :
:![[thin space (1/6-em)]](https://www.rsc.org/images/entities/char_2009.gif) DMSO (1
DMSO (1![[thin space (1/6-em)]](https://www.rsc.org/images/entities/char_2009.gif) :
:![[thin space (1/6-em)]](https://www.rsc.org/images/entities/char_2009.gif) 1, v/v). 8, the hydrolysis product of 7, has pKa = 8.8 under the same conditions. The log
1, v/v). 8, the hydrolysis product of 7, has pKa = 8.8 under the same conditions. The log![[thin space (1/6-em)]](https://www.rsc.org/images/entities/char_2009.gif) βNa+ values for 7 and 8 are 0.7 and 0.8 respectively (at pH 4.5). The 7–CALB interaction is characterized at pH 7 and at 1.0 M Na+ by KM = 2.2 × 10⁻⁶ M and Vmax = 7.5 × 10⁻¹⁰ M s−1. This proof of principle study does not examine selectivity issues with respect to other metal ions.
βNa+ values for 7 and 8 are 0.7 and 0.8 respectively (at pH 4.5). The 7–CALB interaction is characterized at pH 7 and at 1.0 M Na+ by KM = 2.2 × 10⁻⁶ M and Vmax = 7.5 × 10⁻¹⁰ M s−1. This proof of principle study does not examine selectivity issues with respect to other metal ions.
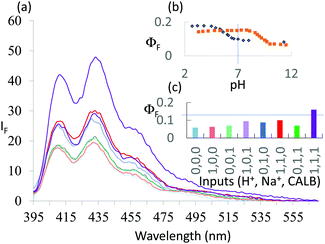 | ||
Fig. 4 (a) Fluorescence spectra of 7.3 × 10⁻⁶ M 7 under stimulation with H+, Na+ and CALB inputs for 30 min in water![[thin space (1/6-em)]](https://www.rsc.org/images/entities/char_2009.gif) : :![[thin space (1/6-em)]](https://www.rsc.org/images/entities/char_2009.gif) DMSO (1 DMSO (1![[thin space (1/6-em)]](https://www.rsc.org/images/entities/char_2009.gif) : :![[thin space (1/6-em)]](https://www.rsc.org/images/entities/char_2009.gif) 1, v/v) (λexc = 378 nm). ‘High’ and ‘low’ input levels for H+ and CALB are as in Fig. 2, except that ‘high’ H+ is 10−7 M, with ‘high’ and ‘low’ Na+ levels being chosen as 1.0 and 0 M respectively. Input states are coloured as in Fig. 1 for ‘high’ Na+, while those with ‘low’ Na+ are shown in the same colours but with 50% transparency. The ‘high’ level of H+ input, 10−7 M, is chosen from the pH value at which maximum discrimination of the fluorescence signals between 7 and 8 is seen in (b). (b) ΦF of 7 (black) and 8 (orange) as a function of pH in the presence of 1.0 M Na+. (c) Pictorial version of truth table showing ΦF values extracted from (a). Output threshold chosen at ΦF = 0.13. 1, v/v) (λexc = 378 nm). ‘High’ and ‘low’ input levels for H+ and CALB are as in Fig. 2, except that ‘high’ H+ is 10−7 M, with ‘high’ and ‘low’ Na+ levels being chosen as 1.0 and 0 M respectively. Input states are coloured as in Fig. 1 for ‘high’ Na+, while those with ‘low’ Na+ are shown in the same colours but with 50% transparency. The ‘high’ level of H+ input, 10−7 M, is chosen from the pH value at which maximum discrimination of the fluorescence signals between 7 and 8 is seen in (b). (b) ΦF of 7 (black) and 8 (orange) as a function of pH in the presence of 1.0 M Na+. (c) Pictorial version of truth table showing ΦF values extracted from (a). Output threshold chosen at ΦF = 0.13. | ||
We conclude that the fluorescent PET sensing/switching design is a useful starting point for constructing tailored molecular logic systems which employ mixed inputs from the chemical and biological spheres, especially when the latter concerns a hydrolase enzyme. Such systems are unique when compared with previously developed AND and other logic gates.2,3 This approach also allows demonstration of logic reconfiguring by changing the molecular configuration of the logic device.
We acknowledge the Department of Employment and Learning, Northern Ireland and T. J. Lively for support and help.
Note added in proof: Fluorescent PET probes for some oxidoreductase proteins are also available.§22
Conflicts of interest
There are no conflicts to declare.Notes and references
- A. P. de Silva, H. Q. N. Gunaratne and C. P. McCoy, Nature, 1993, 364, 42 CrossRef.
- Molecular and Supramolecular Information Processing, ed. E. Katz, Wiley-VCH, Weinheim, 2012 CrossRef CAS; Biomolecular Information Processing, ed. E. Katz, Wiley-VCH, Weinheim, 2012 CrossRef CAS; K. Szacilowski, Infochemistry, Wiley, Chichester, 2012 CrossRef CAS; A. P. de Silva, Molecular Logic-based Computation, Royal Society of Chemistry, Cambridge, 2013 CrossRef CAS; V. Balzani, A. Credi and M. Venturi, Molecular Devices and Machines, VCH, Weinheim, 2nd edn, 2008 CrossRef CAS; A. P. de Silva, Y. Leydet, C. Lincheneau and N. D. McClenaghan, J. Phys.: Condens. Matter, 2006, 18, S1847 CrossRef CAS; S. Uchiyama and A. P. de Silva, Nat. Nanotechnol., 2007, 2, 399 CrossRef PubMed; J. Andreasson and U. Pischel, Chem. Soc. Rev., 2015, 44, 1053 RSC; B. Daly, J. Ling, V. A. Silverson and A. P. de Silva, Chem. Commun., 2015, 51, 8403 RSC; S. Erbas-Cakmak, S. Kolemen, A. C. Sedgwick, T. Gunnlaugsson, T. D. James, J. Y. Yoon and E. U. Akkaya, Chem. Soc. Rev., 2018, 47, 2228 RSC; J. Andreasson and U. Pischel, Chem. Soc. Rev., 2018, 47, 2266 RSC.
- E. Katz and V. Privman, Chem. Soc. Rev., 2010, 39, 1835 RSC; Enzyme-Based Computing Systems, ed. E. Katz, Wiley-VCH, Weinheim, 2019 Search PubMed.
- Recent examples: A. C. Sedgwick, H.-H. Han, J. E. Gardiner, S. D. Bull, X.-P. He and T. D. James, Chem. Sci., 2018, 9, 3672 RSC; C.-Y. Yao, J. Ling, L.-Y.-H. Chen and A. P. de Silva, Chem. Sci., 2019, 10, 2272 RSC; B. Daly, T. S. Moody, A. J. M. Huxley, C.-Y. Yao, B. Schazmann, A. Alves-Areias, J. F. Malone, H. Q. N. Gunaratne, P. Nockemann and A. P. de Silva, Nat. Commun., 2019, 10, 49 CrossRef CAS PubMed; J.-Z. Li, Y.-H. Sun, C.-Y. Wang, Z.-Q. Guo, Y.-J. Shen and W.-H. Zhu, Anal. Chem., 2019, 91, 11946 CrossRef PubMed; M. V. Refalo, N. V. Farrugia, A. D. Johnson, S. Klejna, K. Szacilowski and D. C. Magri, J. Mater. Chem. C, 2019, 7, 15225 RSC; A. Ghosh, A. Patel and M. Schmittel, J. Am. Chem. Soc., 2019, 141, 18954 CrossRef PubMed; A. Fernandez, E. J. Thompson, J. W. Pollard, T. Kitamura and M. Vendrell, Angew. Chem., Int. Ed., 2019, 58, 16894 CrossRef PubMed.
- U. Pischel and J. Andreasson, New J. Chem., 2010, 34, 2701 RSC; D. Gust, J. Andreasson, U. Pischel, T. A. Moore and A. L. Moore, Chem. Commun., 2012, 48, 1947 RSC.
- S. Uchiyama, N. Kawai, A. P. de Silva and K. Iwai, J. Am. Chem. Soc., 2004, 126, 3032 CrossRef CAS PubMed.
- M. E. Huston, E. U. Akkaya and A. W. Czarnik, J. Am. Chem. Soc., 1989, 111, 8735 CrossRef CAS; C. R. Cooper and T. D. James, Chem. Commun., 1997, 1419 RSC; C. R. Cooper and T. D. James, J. Chem. Soc., Perkin Trans. 1, 2000, 963 RSC.
- A. Saghatelian, N. H. Volcker, K. M. Guckian and M. R. Ghadiri, J. Am. Chem. Soc., 2003, 125, 346 CrossRef CAS PubMed; M. N. Stojanovic, D. Stefanovic and S. Rudchenko, Acc. Chem. Res., 2014, 47, 1845 CrossRef PubMed; R. Lopez, R. F. Wang and G. Seelig, Nat. Chem., 2018, 10, 746 CrossRef PubMed.
- R. A. Bissell, A. P. de Silva, H. Q. N. Gunaratne, P. L. M. Lynch, G. E. M. Maguire and K. R. A. S. Sandanayake, Chem. Soc. Rev., 1992, 21, 187 RSC; A. P. de Silva, H. Q. N. Gunaratne, T. Gunnlaugsson, A. J. M. Huxley, C. P. McCoy, J. T. Rademacher and T. E. Rice, Chem. Rev., 1997, 97, 1515 CrossRef CAS PubMed; A. P. de Silva, T. P. Vance, M. E. S. West and G. D. Wright, Org. Biomol. Chem., 2008, 6, 2468 RSC; A. P. de Silva, T. S. Moody and G. D. Wright, Analyst, 2009, 134, 2385 RSC; W. Zhang, Z. Ma, L. P. Du and M. Y. Li, Analyst, 2014, 139, 2641 RSC; B. Daly, J. Ling and A. P. de Silva, Chem. Soc. Rev., 2015, 44, 4203 RSC; D. Wu, A. C. Sedgwick, T. Gunnlaugsson, E. U. Akkaya, J. Y. Yoon and T. D. James, Chem. Soc. Rev., 2017, 46, 7105 RSC.
- Y. C. Wang and H. Morawetz, J. Am. Chem. Soc., 1976, 98, 3611 CrossRef CAS; B. K. Selinger, Aust. J. Chem., 1977, 30, 2087 CrossRef; G. S. Beddard, R. S. Davidson and T. D. Whelan, Chem. Phys. Lett., 1978, 56, 54 CrossRef; H. Shizuka, M. Nakamura and T. Morita, J. Phys. Chem., 1979, 83, 2019 CrossRef; H. Shizuka, T. Ogiwara and E. Kimura, J. Phys. Chem., 1985, 89, 4302 CrossRef; J. P. Konopelski, F. Kotzyba-Hibert, J.-M. Lehn, J.-P. Desvergne, F. Fages, A. Castellan and H. Bouas-Laurent, J. Chem. Soc., Chem. Commun., 1985, 433 RSC; A. P. de Silva and R. A. D. D. Rupasinghe, J. Chem. Soc., Chem. Commun., 1985, 1669 RSC; G. Grynkiewicz, M. Poenie and R. Y. Tsien, J. Biol. Chem., 1985, 206, 3440 Search PubMed; A. P. de Silva and S. A. de Silva, J. Chem. Soc., Chem. Commun., 1986, 1709 RSC; M. E. Huston, K. W. Haider and A. W. Czarnik, J. Am. Chem. Soc., 1988, 110, 4460 CrossRef.
- B. McLaughlin, E. M. Surender, G. D. Wright and A. P. de Silva, Chem. Commun., 2018, 54, 1319 RSC.
- Y. Oshikawa and A. Ojida, Chem. Commun., 2013, 49, 11373 RSC.
- G. D. Wright, PhD thesis, Queen's University Belfast, 2010.
- A. P. de Silva, H. Q. N. Gunaratne, P. L. M. Lynch, A. L. Patty and G. L. Spence, J. Chem. Soc., Perkin Trans. 2, 1993, 1611 RSC.
- F. Hirayama, J. Chem. Phys., 1965, 42, 3163 CrossRef CAS.
- J. F. Callan, A. P. de Silva and N. D. McClenaghan, J. Chem. Soc., Chem. Commun., 2004, 2048 RSC.
- E. M. Anderson, M. Karin and O. Kirk, Biocatal. Biotransform., 1998, 16, 181 CrossRef CAS.
- H. Lineweaver and D. Burk, J. Am. Chem. Soc., 1934, 56, 658 CrossRef CAS.
- T. Konry and D. R. Walt, J. Am. Chem. Soc., 2009, 131, 13232 CrossRef CAS PubMed.
- D. C. Magri, G. J. Brown, G. D. McClean and A. P. de Silva, J. Am. Chem. Soc., 2006, 128, 4950 CrossRef CAS PubMed; G. J. Scerri, J. C. Spiteri, C. J. Mallia and D. C. Magri, Chem. Commun., 2019, 55, 4961 RSC.
- A. P. de Silva, H. Q. N. Gunaratne and C. P. McCoy, J. Am. Chem. Soc., 1997, 119, 7891 CrossRef CAS; S. A. de Silva, B. Amorelli, D. C. Isidor, K. C. Loo, K. E. Crooker and Y. E. Pena, Chem. Commun., 2002, 1360 RSC; A. P. de Silva, G. D. McClean and S. Pagliari, Chem. Commun., 2003, 2010 RSC; S. Uchiyama, E. Fukatsu, G. D. McClean and A. P. de Silva, Angew. Chem., Int. Ed., 2016, 55, 768 CrossRef PubMed.
- T. Guo, L. Cui, J. N. Shen, W. P. Zhu, Y. F. Xu and X. H. Qian, Chem. Commun., 2013, 49, 10820 RSC; D. D. Li, Y. Q. Xu, N. N. Zhou, J. X. Liu, R. Wang, T. Cheng, Y. Tang, W. P. Zhu, Y. F. Xu and X. H. Qian, Dyes Pigm., 2017, 136, 627 CrossRef CAS; L. Yang, J. Y. Niu, R. Sun, Y. J. Xu and J. F. Ge, Sens. Actuators, B, 2018, 259, 299 CrossRef; Z. J. Zhang, T. Lv, B. B. Tao, Z. F. Wen, Y. Q. Xu, H. J. Li, F. Y. Liu and S. G. Sun, Bioorg. Med. Chem., 2020, 28, 115280 CrossRef PubMed; X. L. Sha, X. Z. Yang, X. R. Wei, R. Sun, Y. J. Xu and J. F. Ge, Sens. Actuators, B, 2020, 307, 127653 CrossRef.
Footnotes |
| † In honour of Professor Eric Anslyn's 60th Birthday. |
| ‡ Electronic supplementary information (ESI) available: Synthesis procedures and characterization details for all compounds. See DOI: 10.1039/d0cc00478b |
| § See note added in proof. |
¶ 1; 1H NMR (CDCl3): δ 1.30 (t, 3H, OCH2C![[H with combining low line]](https://www.rsc.org/images/entities/char_0048_0332.gif) 3, J = 7 Hz), 2.44 (s, 3H, NC 3, J = 7 Hz), 2.44 (s, 3H, NC![[H with combining low line]](https://www.rsc.org/images/entities/char_0048_0332.gif) 3), 3.38 (s, 2H, ArC 3), 3.38 (s, 2H, ArC![[H with combining low line]](https://www.rsc.org/images/entities/char_0048_0332.gif) 2N), 3.84 (s, 2H, NC 2N), 3.84 (s, 2H, NC![[H with combining low line]](https://www.rsc.org/images/entities/char_0048_0332.gif) 2CO), 3.89 (s, 3H, OC 2CO), 3.89 (s, 3H, OC![[H with combining low line]](https://www.rsc.org/images/entities/char_0048_0332.gif) 3), 4.21 (q, 2H, OC 3), 4.21 (q, 2H, OC![[H with combining low line]](https://www.rsc.org/images/entities/char_0048_0332.gif) 2CH3, J = 7 Hz), 6.35 (s, 1H, C 2CH3, J = 7 Hz), 6.35 (s, 1H, C![[H with combining low line]](https://www.rsc.org/images/entities/char_0048_0332.gif) CO), 6.83 (m, 1H, Ar CO), 6.83 (m, 1H, Ar![[H with combining low line]](https://www.rsc.org/images/entities/char_0048_0332.gif) ), 6.87 (m, 1H, Ar ), 6.87 (m, 1H, Ar![[H with combining low line]](https://www.rsc.org/images/entities/char_0048_0332.gif) ), 7.90 (d, 2H, Ar ), 7.90 (d, 2H, Ar![[H with combining low line]](https://www.rsc.org/images/entities/char_0048_0332.gif) , J = 9 Hz). 13C NMR (CDCl3): δ 41.1, 41.5, 56.8, 58.5, 100.9, 111.8, 112.7, 112.8, 126.8, 151.9, 156.0, 162.2, 163.7, 172.0. MS(ES): 306.1341 [M + H+]. Calculated m/z for C16H20NO5+, 306.1355. , J = 9 Hz). 13C NMR (CDCl3): δ 41.1, 41.5, 56.8, 58.5, 100.9, 111.8, 112.7, 112.8, 126.8, 151.9, 156.0, 162.2, 163.7, 172.0. MS(ES): 306.1341 [M + H+]. Calculated m/z for C16H20NO5+, 306.1355.3; 1H NMR (CDCl3): δ 1.38 (d, 3H, C(C 5; 1H NMR (CDCl3): δ 1.38 (d, 3H, C(C 7; 1H NMR (CDCl3): δ 1.29 (t, 3H, CH2C |
| This journal is © The Royal Society of Chemistry 2020 |

