Orbital-specific electronic interaction in crystalline films of iron phthalocyanine grown on Au(111) probed by angle-resolved photoemission spectroscopy
Hiroyuki
Yamane†
 *ab,
Andy
Carlier
ac and
Nobuhiro
Kosugi
ab
aInstitute for Molecular Science, Myodaiji, Okazaki 444-8585, Japan
bSOKENDAI (The Graduate University for Advanced Studies) Myodaiji, Okazaki 444-8585, Japan
cDepartment of Physics, Université de Namur, rue Grafé, B-5000 Namur, Belgium
First published on 26th January 2018
Abstract
The orbital-specific interfacial and intermolecular interactions in crystalline films of iron phthalocyanine (FePc) grown on an Au(111) surface were studied by means of angle-resolved photoemission spectroscopy (ARPES) with synchrotron radiation. The temperature-dependent ARPES measurement on the FePc monolayer reveals the formation of the molecule–metal hybrid state together with the Kondo resonance state below the Fermi level. These interface-specific states are derived from the electronic coupling of the Fe 3d orbital in the molecule with the Au(111) surface electron. For the flat-lying FePc multilayer on Au(111), the photon-energy-dependent ARPES spectra reveal the intermolecular valence-band dispersion for the C 2p-derived state, while the Fe 3d-derived state does not show such dispersion, indicating the localized Fe 3d spin state. These orbital-specific interactions play crucial roles in the unique electronic and magnetic properties of FePc.
Introduction
Metal phthalocyanine (MPc, M = metal) molecules are well-known archetypal organic semiconductors and show unique physical and chemical properties depending on central metals and end groups in the molecule and their polymorphs, which can be promising materials for next-generation (opto)electronics. Since MPc molecules with 3d transition metals (e.g. FePc, shown in the inset of Fig. 1) have attracted much attention for potential applications in molecular spintronic devices, various spectroscopic and microscopic experiments have been performed for MPc thin films and interfaces1–9 in comparison with gaseous molecules.10,11 In particular, it was pointed out that the FePc molecules on an Au(111) surface exhibit two Kondo resonances at the temperature of T = 2.6 ± 1.4 K and 110–150 K, depending on the adsorption configuration.3 The Kondo resonance is in general derived from the screening of the magnetic moment of the impurity spin by the conduction electrons as the result of the many-body entanglement.12 Therefore, the FePc–Au(111) hybrid state due to the orbital-specific interaction, if present, can be regarded as a probe to understand the Kondo resonance.In the present work, in order to understand the orbital-specific electronic interaction in two- and three-dimensional crystalline films of FePc on Au(111), we performed the angle-resolved photoemission spectroscopy (ARPES) experiments using synchrotron radiation. At the FePc/Au(111) interface, we observed evolution of the charge transfer (CT)-derived peak at the Fe site, together with the Kondo resonance at the temperature of T ≤ 160 K. On the other hand, we observed the intermolecular electronic band dispersion in the FePc multilayer on Au(111), which shows delocalized and localized characters for the C 2p- and Fe 3d-derived bands, respectively, and is related to magnetic properties of FePc thin films on Au(111).
Results and discussion
Molecule–metal hybrid state at the FePc/Au(111) interface
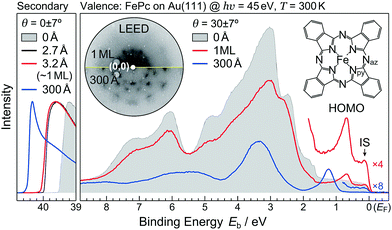
First, we discuss the thickness-dependent electronic structure of FePc thin films on Au(111). Fig. 1 shows the ARPES spectra (hν = 45 eV) and the corresponding low-energy electron diffraction (LEED) image, measured for the FePc thin films grown on Au(111). In the secondary electron cutoff region, which corresponds to the vacuum level (VL) position, the 2.7 Å deposition introduces the rapid decrease in VL from the clean Au(111) due to the formation of the interface dipole layer.13 Shift in VL for 3.2 Å is almost the same to that in 2.7 Å, indicating the saturated monolayer (1 ML) formation. The corresponding LEED image of the FePc monolayer exhibits two-kinds of diffraction spots; one is the surface reconstruction pattern of Au(111) around the (0,0) spot, and the other is the weak diffraction pattern due to the molecular unit cell. The latter is the typical LEED pattern of the flat-lying MPc monolayer on Au(111).14 For the multilayer, the
  pattern disappears and the molecule-derived LEED pattern is getting intense from the monolater's LEED pattern, indicating the ordered growth of the FePc multilayer on Au(111).
The ARPES spectrum of the FePc monolayer shows the highest-occupied molecular orbital (HOMO)-derived peak at the binding energy (Eb) of 0.68 eV. The HOMO-derived peak is shifted to the higher-Eb side as the thickness increases, and is almost converged at Eb = 1.23 eV when the film thickness reaches 300 Å. The thickness dependent shift in the HOMO is almost parallel to that in the VL, indicating that the ionization potential is almost constant in the present system; therefore, the observed shift in the HOMO is ascribed to the photohole screening by surrounding mediums such as the substrate and neighboring molecules.15 Note that, the interface-specific electronic state is observed just below the Fermi level (EF, Eb = 0 eV), labelled “IS” in Fig. 1, but is not observable in the FePc multilayer, which only shows the weak substrate's Fermi edge because of the dewetting effect on Au(111).16
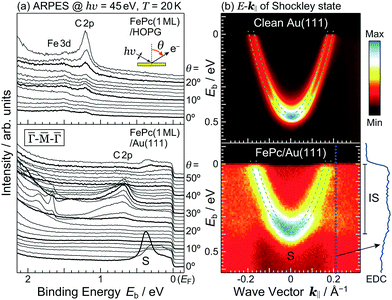
The detailed θ-dependent ARPES spectra for the FePc monolayers on Au(111) and the highly-oriented pyrolytic graphite (HOPG) at 20 K are shown in Fig. 2(a). At the weakly physisorbed FePc/HOPG interface, the C 2p- and Fe 3d-derived peaks appear at Eb = 1.20 eV and 1.49 eV, respectively. The intensity of Fe 3d is stronger than that of C 2p at the surface-normal emission (θ = 0°). With increasing θ, the intensity of C 2p is getting stronger, and the peak intensity ratio between C 2p and Fe 3d is reversed at θ ≥ 20°. This photoelectron intensity angular distribution (PIAD) is reflected the different spatial electron distribution between C 2p- and Fe 3d-derived molecular orbitals. No additional adsorption-induced peaks can be seen just below EF at the FePc/HOPG interface.
At the FePc/Au(111) interface, the dispersive Au(111) surface states exist at Eb = 0–0.37 eV (Shockley state, labelled S), 1.65–2.15 eV (Tamm state), and 0–2.15 eV (sp band). The C 2p-derived peak is localized at Eb = 0.68 eV, and overlaps with the sp band at θ = 20°–30°. The C 2p PIAD shows an intensity maximum at θ = 32°, which is converted to the lateral wave-vector component (k‖) of ca. 1.7 Å−1 using the following equation.
 | (1) |
The Shockley state shows a parabolic dispersion in the E–k‖ map [Fig. 2(b)], obtained using eqn (1), which is well-reproduced by two free-electron-like parabolas,
 | (2) |
| Sample | m*/m0 | E 0 (meV) | ΔkR (Å−1) |
|---|---|---|---|
| Au(111) | 0.27 | 465 | 0.013 |
| FePc/Au(111) | 0.28 | 380 | 0.013 |
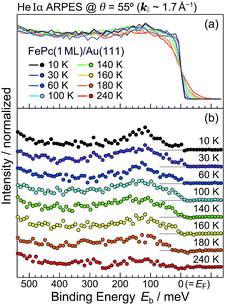
In order to understand the FePc/Au(111) interface state in more detail, we performed the temperature dependence of He Iα ARPES (hν = 21.218 eV) along θ = 55° (k‖ ≈ 1.7 Å−1). As shown in Fig. 3(a), the substrate's Fermi edge at Eb = 0 meV is sharpened with decreasing the temperature, which can be subtracted by using the Fermi–Dirac distribution function. In Fig. 3(b), the background-subtracted ARPES spectra exhibit the temperature-dependent evolution of the interface state. At T = 240 K, the interface state appears very weakly at Eb = 80–400 meV. The intensity of the interface state is increased at T = 180 K, and is almost saturated at T ≤ 160 K. Increase in the intensity of the interface state can be explained by the efficient CT interaction from Au(111) to Fe 3d orbitals due to the shorter FePc–Au(111) interfacial bonding distance at the lower temperature. Remarkably, an additional interface state appears just below EF (Eb ≈ 30 meV) at T ≤ 160 K. The additional interface state just below EF can be ascribed to the Kondo resonance since the observed energy and temperature range correspond well with those for the high-temperature Kondo resonance at the FePc/Au(111) interface;3 therefore, the complex electronic interaction at the FePc/Au(111) interface is mainly dominated by the Fe 3d orbitals in the FePc molecule coupled with the Au(111) surface electron systems. Although we could not apply the lineshape analysis to the Kondo-resonance peak because of its tiny signal intensity, the ARPES spectra show the evidence for the linewidth narrowing with decreasing the temperature, which is apparent at T = 60–100 K, as a result of the electron–phonon interaction.6
Intermolecular interaction in the FePc crystalline film
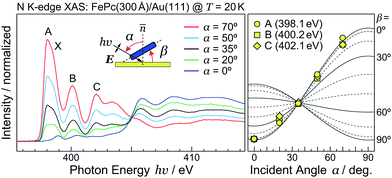
As discussed using the LEED data (Fig. 1), the FePc molecules on Au(111) form the ordered growth, which introduces the ferromagnetism.8 Prior to discussion of the intermolecular interaction in the FePc crystalline film, the molecular orientation of the FePc crystalline film on Au(111) at 20 K was quantitatively characterized by the incident-angle (α) dependence of N K-edge X-ray absorption spectroscopy (XAS). The XAS spectra in Fig. 4 show sharp peaks at hν = 398.1 eV, 400.2 eV, and 402.1 eV as labelled A, B, and C, respectively. Peak A is ascribed to the 1s → LUMO transition at azaporphyrin N (Naz) site, and peaks B and C are ascribed to the 1s → π* transitions at Naz and pyrrole N (Npy) sites.20 Peaks A–C are weakest at the normal incidence (α = 0°) and become stronger with increasing α. Broad 1s → σ* features appear after the isosbestic point at hν = 405 eV, showing the opposite behavior. These evidences are explained by the interaction between the electric field vector (E) of incident p-polarized X-rays and the molecular orbitals based on the dipole transition. The XAS intensity is expressed as,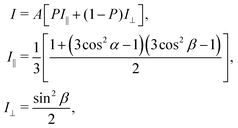 | (3) |
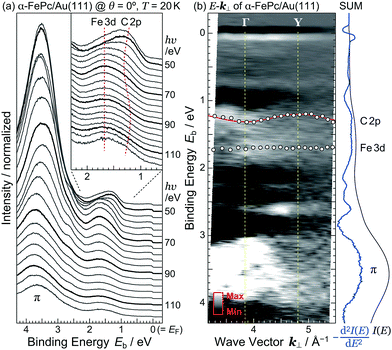
In the case of the flat-lying ordered multilayer of π-conjugated molecules, the intermolecular electronic coupling exists along the surface-normal direction, and can be detected by the hν-dependent normal-emission ARPES, which scans the perpendicular wave-vector component (k⊥).
 | (4) |
Judging from the lineshape of the HOMO-derived peak, the C 2p peak shows a dispersive behavior with hν, but the Fe 3d peak does not. The C 2p peak appears at Eb = 1.25 eV at hν = 50 eV. With increasing hν, the C 2p peak shifts to the higher-Eb side, and turns back at hν = 62 eV. Such an inflection point is also found around hν = 94 eV. The HOMO-derived peak onset also shows the dispersive behavior with hν. If the observed change in the ARPES spectra originates from the hν-dependent photoionization cross section, the HOMO-derived peak onset should appear at the constant Eb position.10 Since the C 2p peak and its onset shows the periodic shift, the most plausible origin of the dispersive behavior is not photoionization cross section but the delocalized band formation.
Fig. 5(b) shows the E–k⊥ map for the FePc crystalline film on Au(111) at 20 K, which is obtained from the second derivative of ARPES [−d2I(E)/dE2] after converting to k⊥ from hν using eqn (3). For the k⊥ conversion, we used V0 = −1.0 eV, to get good agreement in the dispersion periodicity between C 2p and π bands. The dispersion periodicity is well explained by π/a⊥ = 0.964 Å−1, where a⊥ = 3.26 Å is the intermolecular distance. Because of the low-temperature measurement in ARPES, the determined a⊥ = 3.26 Å at 20 K is 4.1% shorter than that observed for the α-phase FePc crystal, as determined from the room-temperature X-ray diffraction (a⊥ ≈ 3.4 Å).23 The observed dispersion for the C 2p peak can be thus ascribed to the delocalized band formation due to the intermolecular π–π interaction in the α-FePc crystalline film as observed for the other MPc crystalline films.24,25 From the Γ to Y point, the C 2p band is dispersed to the lower-Eb side by 110 ± 5 meV in total. Assuming the free-electron-like final states, the one-dimensional tight-binding model with only nearest neighbor interactions is given as,
E(k⊥) =E0b − 2t⊥![[thin space (1/6-em)]](https://www.rsc.org/images/entities/char_2009.gif) cos(a⊥k⊥), cos(a⊥k⊥), | (5) |
Conclusion
We have studied the orbital-specific electronic interaction in the monolayer and multilayer films of FePc on Au(111) by means of ARPES, wherein the molecular orientation and the ordered structure were characterized by XAS and LEED. The temperature-dependent ARPES measurement on the FePc monolayer reveals the formation of the interface-specific state derived from the site-specific electronic coupling at the central-metal (Fe) site in the FePc molecule with the Au(111) surface electron system. The orbital-specific CT interaction induces not only the filling of Fe 3d-derived unoccupied orbitals but also the Kondo resonance.The hν-dependent ARPES (E–k⊥) measurement on the FePc multilayer reveals the orbital-specific intermolecular interaction. The weakly delocalized C 2p band due to the intermolecular π–π interaction gives the hole transport properties mh* = 12.8m0 and μh > 23.4 cm2 V−1 s−1 at 20 K. On the other hand, the Fe 3d band does not show dispersion, indicating the localized character of the spin state. The interplay of the orbital-specific electronic interactions is crucial in the coexistence of high-μh and ferromagnetic characters of FePc crystals.
Experimental
ARPES and XAS experiments
The ARPES and XAS experiments were performed on a highly brilliant in-vacuum undulator beamline of BL6U, which covers hν = 40–700 eV, of the UVSOR-III Synchrotron in the Institute for Molecular Science. The ARPES/XAS endstation at BL6U consists of the measurement, preparation, and load-lock chambers. The ARPES spectra were acquired from the energy-vs.-angle image by using a micro-channel-plate (MCP) detector of a hemispherical electron energy analyzer (MB Scientific A-1). The total energy resolution was 20 meV and the angular resolution was 0.2° in the ARPES measurements. On the other hand, the XAS spectra were measured by using the sample-current method with the energy resolution of better than 0.1 eV.The temperature-dependent He Iα ARPES experiment (hν = 21.218 eV) was performed using the laboratory-based ARPES system, equipped with the deflector-type hemispherical analyser and the monochromatized UV source with a μ-spot capillary (Scienta-Omicron DA30 and VUV5k, respectively). The sample temperature was controlled by the liquid He flow cryostat and the indirect resistive heating systems.
Preparation of the FePc thin films on Au(111)
The Au(111) single crystal (5 N purity) and the HOPG (ZYA grade) were used for the substrate. The clean Au(111) substrate was obtained by repeated cycles of the Ar+ sputtering and the subsequent annealing at 700 K. The HOPG substrate was cleaved in air just before loading into the load-lock chamber and cleaned by heating at 700 K for 5 hours in the preparation chamber. The cleanliness of these substrates was confirmed by the core-level and valence-band ARPES spectra and MCP-LEED.The well-ordered FePc monolayer was prepared by the vacuum deposition of highly purified powders onto the clean substrate kept at the room temperature. After the 1 ML equivalent deposition, the sample was annealed at 475 K to improve the lateral ordering. The thick FePc multilayer was prepared on the well-ordered FePc monolayer. During the deposition for the FePc multilayer, the substrate temperature was kept at 355 K. The deposition rate (<1 Å min−1) and amount were measured using a calibrated quartz crystal microbalance. The lateral ordered structure of FePc crystalline films was confirmed by MCP-LEED.
Conflicts of interest
There are no conflicts to declare.Acknowledgements
The authors would like to thank the staff of the UVSOR-III Synchrotron for their kind supports in the present ARPES experiment. This work is supported by Grant-in-Aid for Scientific Research on Innovative Areas (π-System Figuration: Control of Electron and Structural Dynamism for Innovative Functions) JP17H05167 and Grant-in-Aid for Scientific Research (C) JP17K05767 from Japan Society for the Promotion of Science (JSPS) and Grant for Basic Science Research Projects from the Sumitomo Foundation 150301.References
- A. Zhao, Q. Li, L. Chen, H. Xiang, W. Wang, S. Pan, B. Wang, X. Xiao, J. Yang, J. G. Hou and Q. Zhu, Science, 2005, 309, 1542 CrossRef CAS PubMed
.
- N. Tsukahara, S. Shiraki, S. Itou, N. Ohta, N. Takagi and M. Kawai, Phys. Rev. Lett., 2011, 106, 187201 CrossRef PubMed
.
- E. Minamitani, N. Tsukahara, D. Matsunaka, Y. Kim, N. Takagi and M. Kawai, Phys. Rev. Lett., 2012, 109, 086602 CrossRef PubMed
.
- N. Tsukahara, E. Minamitani, Y. Kim, M. Kawai and N. Takagi, J. Chem. Phys., 2014, 141, 054702 CrossRef PubMed
.
- Y. Wang, X. Zheng and J. Yang, Phys. Rev. B, 2016, 93, 125114 CrossRef
.
- J. Ziroff, S. Hame, M. Kochler, A. Bendounan, A. Schöll and F. Reinert, Phys. Rev. B: Condens. Matter Mater. Phys., 2012, 85, 161404(R) CrossRef
.
- S. Ahmadi, M. N. Shariati, S. Yu and M. Göthelid, J. Phys. Chem., 2012, 137, 084705 CrossRef PubMed
.
- J. Bartolomé, F. Bartolomé, L. M. García, G. Filoti, T. Gredig, C. N. Colesniuc, I. K. Schuller and J. C. Cezar, Phys. Rev. B: Condens. Matter Mater. Phys., 2010, 81, 195405 CrossRef
.
- S. Stepanow, P. S. Miedema, A. Mugarza, G. Ceballos, P. Moras, J. C. Cezar, C. Carbone, F. M. F. de Groot and P. Gambardella, Phys. Rev. B: Condens. Matter Mater. Phys., 2011, 83, 220401(R) CrossRef
.
- B. Brena, C. Puglia, M. de Simone, M. Coreno, K. Tarafder, V. Feyer, R. Banerjee, E. Göthelid, B. Sanyal, P. M. Oppeneer and O. Eriksson, J. Chem. Phys., 2011, 134, 074312 CrossRef PubMed
.
- I. Bidermane, J. Lüder, R. Totani, C. Grazioli, M. de Simone, M. Coreno, A. Kivimäki, J. Åhlund, L. Lozzi, B. Brena and C. Puglia, Phys. Status Solidi B, 2015, 252, 1259 CrossRef CAS
.
- J. Kondo, Prog. Theor. Phys., 1964, 32, 37 CrossRef CAS
.
- H. Ishii, K. Sugiyama, E. Ito and K. Seki, Adv. Mater., 1999, 11, 605 CrossRef CAS
.
- B. Stadtmüller, I. Kröger, F. Reinert and C. Kumpf, Phys. Rev. B: Condens. Matter Mater. Phys., 2011, 83, 085416 CrossRef
.
- H. Peisert, M. Knupfer, T. Schwieger, J. M. Auerhammer, M. S. Golden and J. Fink, J. Appl. Phys., 2002, 91, 4872 CrossRef CAS
.
- G. Beernink, T. Strunskus, G. Witte and C. Wöll, Appl. Phys. Lett., 2004, 85, 398 CrossRef CAS
.
- J. Ziroff, P. Gold, A. Bendounan, F. Forster and F. Reinert, Surf. Sci., 2009, 603, 354 CrossRef CAS
.
- H. Yamane and N. Kosugi, J. Phys. Chem. C, 2016, 120, 24307 CAS
.
- E. Annese, J. Fujii, I. Vobornik and G. Rossi, J. Phys. Chem. C, 2011, 115, 17409 CAS
.
- S. Kera, M. B. Casu, A. Schöll, T. Schmidt, D. Batchelor, E. Rühl and E. Umbach, J. Chem. Phys., 2006, 125, 014705 CrossRef CAS PubMed
.
-
J. Stöhr, NEXAFS Spectroscopy, Springer-Verlag, 1992 Search PubMed
.
- F. Petraki, H. Peisert, F. Latteyer, U. Aygül, A. Vollmer and T. Chassé, J. Phys. Chem. C, 2011, 115, 21334 CAS
.
- M. Evangelisti, J. Bartolomé, L. J. de Jongh and G. Filoti, Phys. Rev. B: Condens. Matter Mater. Phys., 2002, 66, 144410 CrossRef
.
- H. Yamane and N. Kosugi, Phys. Rev. Lett., 2013, 111, 086602 CrossRef PubMed
.
- H. Yamane and N. Kosugi, J. Chem. Phys., 2014, 141, 224701 CrossRef PubMed
.
- N. Ueno and S. Kera, Prog. Surf. Sci., 2008, 83, 490 CrossRef CAS
.
Footnote |
| † Present address: RIKEN SPring-8 Center, Sayo, Hyogo 679-5148, Japan. E-mail: yamane@spring8.or.jp |
| This journal is © the Partner Organisations 2018 |

