ZIF-8 coating on graphite: a high-rate and long-term cycling anode for sodium-ion capacitors†
Xueying
Liang
,
Zhifei
Mao
,
Xiaojun
Shi
,
Taoqiu
Zhang
,
Zhi
Zheng
,
Jun
Jin
 ,
Beibei
He
 ,
Rui
Wang
 ,
Yansheng
Gong
 and
Huanwen
Wang
 *
*
Engineering Research Center of Nano-Geomaterials of Ministry of Education, Faculty of Material and Chemistry, China University of Geosciences, Wuhan, 430074, China. E-mail: wanghw@cug.edu.cn
First published on 25th July 2023
Abstract
Sodium-ion capacitors (SICs) have been designed to combine the advantages of high-energy batteries and high-power capacitors as well as low-cost sodium resources. However, anode materials usually exhibit sluggish diffusion of Na+, which results in kinetics imbalance with the capacitive cathode. Herein, the zeolitic imidazolate framework-8 (ZIF-8) layer is uniformly grown on the graphite surface (ZIF-8@Gr) to promote solvated-Na+ co-intercalation reactions in an ether electrolyte. The ZIF-8 coating can act as a multifunctional protection layer to inhibit electrolyte decomposition in the initial cycle, and also withstand volume expansion of graphite during the long-term co-intercalation process. The initial coulombic efficiency (ICE) of the ZIF-8@Gr electrode can be improved to 86%, much higher than that of the pristine graphite electrode (58%). More importantly, the ZIF-8@Gr electrode possesses ultrafast-charging sodium storage (20 A g−1, a full charge time within 16.2 s) and ultralong cycle life (96% and 94% capacity retention after 15![[thin space (1/6-em)]](https://www.rsc.org/images/entities/char_2009.gif) 000 and 20
000 and 20![[thin space (1/6-em)]](https://www.rsc.org/images/entities/char_2009.gif) 000 cycles at 5 A g−1 and 10 A g−1, respectively). By coupling the ZIF-8@Gr electrode with the activated carbon (AC) as the positive electrode, the as-fabricated SIC device demonstrates impressive energy//power densities (82 W h kg−1 at 518 W kg−1, 47 W h kg−1 at 10
000 cycles at 5 A g−1 and 10 A g−1, respectively). By coupling the ZIF-8@Gr electrode with the activated carbon (AC) as the positive electrode, the as-fabricated SIC device demonstrates impressive energy//power densities (82 W h kg−1 at 518 W kg−1, 47 W h kg−1 at 10![[thin space (1/6-em)]](https://www.rsc.org/images/entities/char_2009.gif) 370 W kg−1). These results indicate that ZIF-based surface modification enables graphite as a fast-charging and long-term cycling sodium-storage material.
370 W kg−1). These results indicate that ZIF-based surface modification enables graphite as a fast-charging and long-term cycling sodium-storage material.
Introduction
Hybridization of batteries and supercapacitors according to their own merits and pitfalls is considered to be an efficient strategy to develop new power sources for the requirements of state-of-the-art equipment.1,2 The battery-type and capacitor-type electrodes operate reversibly in different potential ranges, which can increase the voltage window of the device and achieve fast charge capability, long-term cycling life, and high power density as well as high energy density.3–5 In 2000, hybrid lithium-ion capacitors (LICs) were commercialized by JM Energy Corp. with a bulk graphite anode and an AC cathode in the electrolyte of 1 M LiPF6 (EC/DMC), delivering a specific energy of 20 W h kg−1 at a power density of 3 kW kg−1 with a cell voltage of 3.8 V. The working temperature of this graphite‖AC LIC ranges from −10 °C to 60 °C.6 Considering the scarcity and uneven distribution of lithium resources, the development of sodium-ion capacitors (SICs) that share a similar energy-storage mechanism with LICs7,8 can meet the needs of large-scale Energy Storage Systems (ESS), thus becoming a hot research project in recent years.9–11 However, the commercial graphite production lines cannot be transferred from LICs to SICs since intercalation of Na+ ions into graphite is thermodynamically unfavorable in the cost-effective carbonate electrolytes, corresponding to a specific capacity of less than 35 mA h g−1.12–14Fortunately, recent research has demonstrated that Na+ and ether molecules can be co-intercalated into graphite to form ternary (t)-GIC compounds instead of the typical binary (b)-GIC compounds as observed in lithium-ion batteries,15–17 which offer a theoretical capacity of about 110 mA h g−1.18 This solvent co-intercalation can avoid the desolvation step, thus possessing fast reaction kinetics, which opens a new avenue to employ graphite as a promising negative electrode in SICs.19,20 Until now, properties of Na+-solvent co-intercalation into graphite have been extensively investigated, including: (1) revealing the intercalation mechanism of Na in the (t)-GIC system using operando X-ray diffraction;21 (2) surface layer evolution on the graphite surface during Co-intercalation of sodium-solvent;22 (3) developing novel graphite structures (such as few-layer graphitic carbon,23 freestanding microcrystalline graphite fiber24) toward fast and long-term co-intercalation of solvated Na+. Despite these advances, irreversible capacity in the initial cycle is always observed, resulting in a relative ICE value (about 50%).21,25 How to explain and further avoid the irreversible loss in the ether-based electrolyte is very important for the practical application of the graphite negative electrode in SICs or SIBs. Moreover, the rate capability and cycling stability of the commercial graphite electrode during co-intercalation should be further boosted by optimizing the electrode–electrolyte interface.26,27
In this paper, ZIF-8 with a sodium zeolite-type structure is grown on the surface of commercial graphite (ZIF-8@Gr) to improve the electrode/electrolyte interfacial properties. This unique interface design is beneficial to provide more active adsorption sites for fast solvated-Na+-diffusion and to prevent the decomposition of electrolyte, thus decreasing irreversible capacity loss corresponding to a high ICE of 86%. Moreover, long-term cycling stability (94% capacity retention after 20![[thin space (1/6-em)]](https://www.rsc.org/images/entities/char_2009.gif) 000 cycles at 10 A g−1) and fast-charging ability (20 A g−1) have been achieved for the ZIF-8@Gr electrode in Na-half-cells. More importantly, even at a high mass loading of about 10 mg cm−2, the ZIF-8@Gr electrode can still exhibit excellent rate/cycling performance. The as-assembled ZIF-8@Gr‖AC SIC device is demonstrated to have high energy//power densities.
000 cycles at 10 A g−1) and fast-charging ability (20 A g−1) have been achieved for the ZIF-8@Gr electrode in Na-half-cells. More importantly, even at a high mass loading of about 10 mg cm−2, the ZIF-8@Gr electrode can still exhibit excellent rate/cycling performance. The as-assembled ZIF-8@Gr‖AC SIC device is demonstrated to have high energy//power densities.
Results and discussion
Synthesis and characterization
In conventional LIBs, the SEI film is usually generated on the graphite surface to have double advantages.11 The first is that the SEI can insulate the electronic contact between the electrode and electrolyte, thus promoting the reaction kinetics. The second is that the SEI can serve as a filter that only allows naked Li+ to be intercalated into graphite interlayers, namely the desolvation step.28 In the case of solvated-Na+ co-intercalation in graphite, the conventional SEI film should not be produced in 1 M NaPF6/diglyme because it will forbid the co-intercalation of the large-size [Na(Diglyme)]+ complex.29–31 However, irreversible capacity loss is usually observed during the initial cycles, which is accompanied by low ICE. In addition, fluctuations in coulombic efficiency occur during long-term cycling (e.g., 5000 cycles). In Liu's work,32 the reason for irreversible capacity is that a small fraction of PF6− participates in reduction. Maibach, et al.22 also found that the surface layer on the cycled graphite electrodes during Na-tetraglyme co-intercalation is mainly from salt decomposition products and hydrocarbons. These efforts indicate that the co-intercalation behavior of solvated-Na+ in graphite is related to the electrode/electrolyte interfacial properties. As illustrated in Fig. 1A, the ZIF-8 coating is beneficial to generate a robust artificial protective layer on the graphite surface during repeated charging and discharging. In subsequent tests, the Na+-storage capacity of the graphite electrode can be well retained even during high-rate and long-term cycling tests, which can achieve the kinetics balance with the positive electrode of AC in hybrid SICs.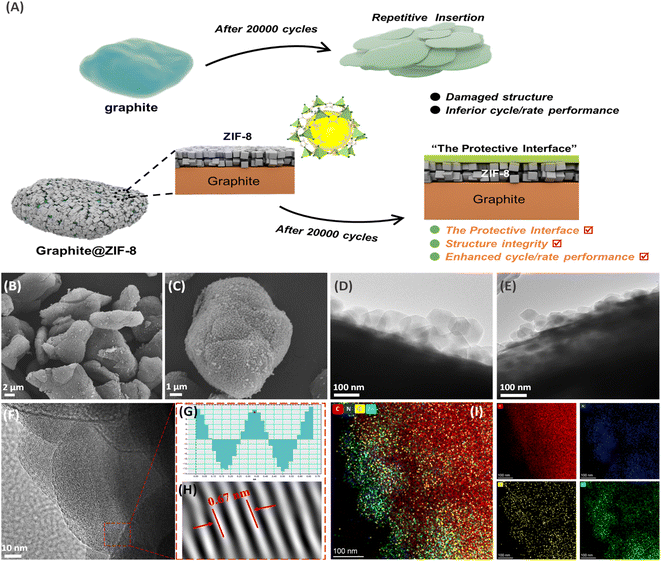 | ||
| Fig. 1 (A) Illustration of Gr@ZIF-8 during solvated-Na+ storage, (B, C) SEM and (D, E) TEM images of ZIF-8@Gr, (F–H) HRTEM of the graphite lattice, and (I) elemental mapping images of ZIF-8@Gr. | ||
The surface morphology of ZIF-8@Gr is analyzed by scanning electron microscopy (SEM) and transmission electron microscopy (TEM). As illustrated in the low-magnification SEM image (Fig. 1B), ZIF-8@Gr can still maintain the same micro-sphere morphology as the pristine graphite (Fig. S1 ESI†), indicating the uniform growth of ZIF-8 on the graphite surface. In the high magnification SEM image (Fig. 1C), we can see that the graphite surface is completely covered by ZIF-8 polyhedra with a size of about 100 nanometers. The TGA curves show that the content of ZIF-8 is about 10% (Fig. S2 ESI†). This heterogeneous ZIF-8@graphite structure can also be clearly observed in TEM images (Fig. 1D and E), where the ZIF-8 coating has a thickness of about 100 nm. The (002) lattice fringe of graphite can be well observed (Fig. 1F), corresponding to a layer spacing of 0.335 nm (Fig. 1H). In addition, the elemental mapping images (Fig. 1I) show the concentrated C elements in graphite and the uniform distribution of N, O, and Zn elements in the ZIF-8 layer, further verifying the homogeneous growth on graphite.
Subsequently, we analyzed the structural composition of ZIF-8@Gr using X-ray diffraction (XRD), Raman spectroscopy (Raman), X-ray photoelectron spectroscopy (XPS), and Brunner–Emmett–Teller (BET) studies. In the XRD pattern (Fig. 2A), except for the characteristic graphitic carbon peak (002) at about 26°, the diffraction peaks between 5° and 20° are attributed to the published crystal structure data of ZIF-8. As shown in Raman spectra (Fig. 2B), the intensity of the D-peak representing the stacking disorder and structural defects is rather weak, but the intensity of the G-peak corresponding to the degree of graphitization is extremely high. Meanwhile, we can further observe the characteristic 2D-peak of graphite at 2724 cm−1, which is similar to that of the original graphite (Fig. S3 ESI†).
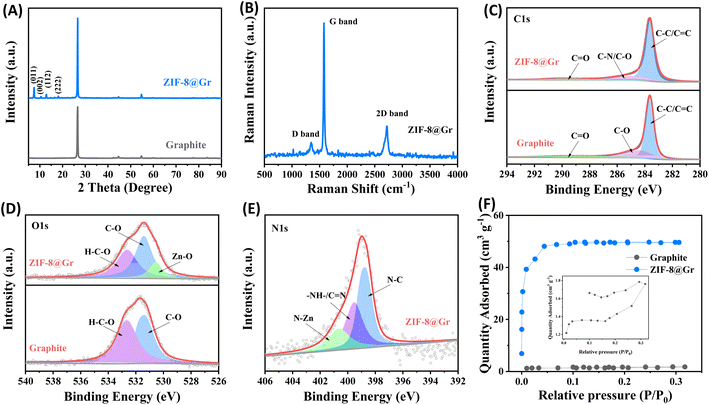 | ||
| Fig. 2 (A) XRD patterns of ZIF-8@Gr and graphite, (B) Raman spectra and XPS spectra of (C) C 1s, (D) O 1s, and (E) N 1s, and (F) nitrogen adsorption–desorption isotherms of ZIF-8@Gr and graphite. | ||
We further performed XPS tests on ZIF-8@Gr and graphite, and the full spectra are shown in Fig. S4 ESI†. The C 1s peaks can be decomposed into C![[double bond, length as m-dash]](https://www.rsc.org/images/entities/char_e001.gif) O, C–O, C
O, C–O, C![[double bond, length as m-dash]](https://www.rsc.org/images/entities/char_e001.gif) C/C–C, and C–N bonds in ZIF-8@Gr. In comparison, the C–N bond is not found in pristine graphite due to the absence of 2-methyl imidazolate groups in ZIF-8 (Fig. 2C). In the O 1s peaks (Fig. 2D), the H–C–O and C–O bonds can be obtained in both graphite and ZIF-8@Gr. However, an additional peak at 530 eV in ZIF-8@Gr is attributed to the Zn–O bond formed by O coordinated to Zn.33 In the N 1s region (Fig. 2E), the peaks at 398.7, 399.5, and 400.6 eV are attributed to the C–N bond, the C
C/C–C, and C–N bonds in ZIF-8@Gr. In comparison, the C–N bond is not found in pristine graphite due to the absence of 2-methyl imidazolate groups in ZIF-8 (Fig. 2C). In the O 1s peaks (Fig. 2D), the H–C–O and C–O bonds can be obtained in both graphite and ZIF-8@Gr. However, an additional peak at 530 eV in ZIF-8@Gr is attributed to the Zn–O bond formed by O coordinated to Zn.33 In the N 1s region (Fig. 2E), the peaks at 398.7, 399.5, and 400.6 eV are attributed to the C–N bond, the C![[double bond, length as m-dash]](https://www.rsc.org/images/entities/char_e001.gif) N and –NH– bonds in the imidazole rings and the N–Zn bond,27 respectively. Based on the adsorption/desorption isotherm of N2 (Fig. 2F), the specific surface area of ZIF-8@Gr is as high as 163.1 m2 g−1, much higher than that of pristine graphite (4.67 m2 g−1). This is mainly attributed to the porous structure of the surface-coated ZIF-8 layer. These results indicate that the ZIF-8 layer has been successfully grown on graphite to optimize the electrode/electrolyte properties.
N and –NH– bonds in the imidazole rings and the N–Zn bond,27 respectively. Based on the adsorption/desorption isotherm of N2 (Fig. 2F), the specific surface area of ZIF-8@Gr is as high as 163.1 m2 g−1, much higher than that of pristine graphite (4.67 m2 g−1). This is mainly attributed to the porous structure of the surface-coated ZIF-8 layer. These results indicate that the ZIF-8 layer has been successfully grown on graphite to optimize the electrode/electrolyte properties.
Sodium-storage properties of ZIF-8@Gr in half-cells
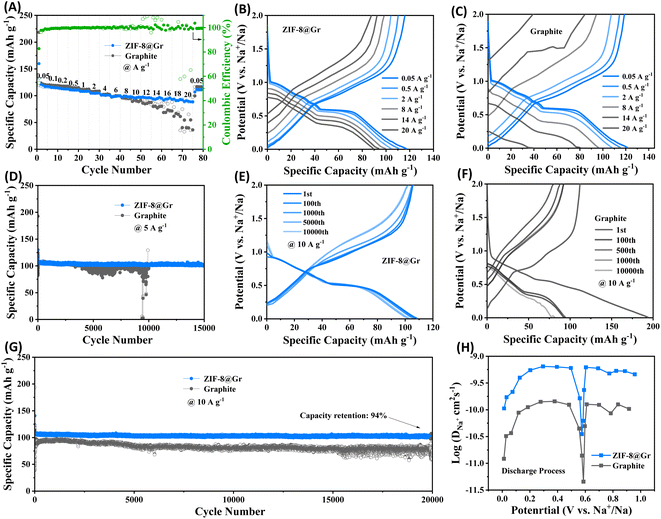
Based on the galvanostatic charge–discharge (GCD) curves, the initial discharge/charge capacities of ZIF-8@Gr are 123 mA h g−1 and 106 mA h g−1, respectively (Fig. 3A). The initial coulombic efficiency of the ZIF-8@Gr electrode is 86.67%, which is higher than that of the pristine graphite electrode (58.41%) (Fig. 3D). This is due to the unique interface that prevents the decomposition of the electrolyte effectively. This result can be confirmed by testing three parallel electrodes, as shown in Fig. S5 ESI.† In the subsequent GCD curves, the ZIF-8@Gr and the pristine graphite electrode show two plateau regions, corresponding to different solvated-Na+ de/intercalation processes in graphite intercalation compounds.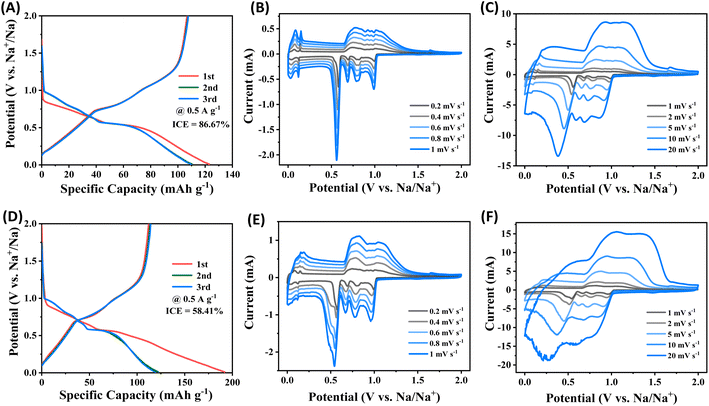 | ||
| Fig. 3 Galvanostatic charge–discharge (GCD) curves of (A) and (D) pristine graphite electrodes at 0.5 A g−1, and CV curves of (B, C) ZIF-8@Gr and (E, F) pristine graphite at different scan rates. | ||
Redox characteristics are further revealed by cyclic voltammetry (CV), where the ZIF-8@Gr and pristine graphite electrodes exhibit similar anodic and cathodic peaks, which correspond to the main plateaus of the GCD curves (Fig. 3B and E). The CV shape of the ZIF-8@Gr electrode can be well maintained even at a high scan rate of 20 mV s−1. In contrast, the CV curve of the pristine graphite electrode is completely deformed at high rates, indicating the importance of the ZIF-8 coating in reducing electrode polarization. To investigate the sodium storage kinetics of ZIF-8@Gr, we further calculated the contribution of the intercalation and capacitance reactions to the total capacity according to the power-law relationship (i = avb). The calculation results are shown in Fig. S6 ESI.† Even at a small scan rate of 0.2 mV s−1, the capacitive contribution of the ZIF-8@Gr electrode is as high as 94.4%, demonstrating that the ZIF-8-enabled electrode–electrolyte interface is beneficial to fast Na+ transport and reaction kinetics.
Rate capability of the ZIF-8@Gr and graphite electrodes is shown in Fig. 4A. At a small current density of 0.05 A g−1, both electrodes provide a reversible capacity of 117 mA h g−1. When the current density increases to 20 A g−1, the ZIF-8@Gr electrode still maintains a high reversible capacity of 90 mA h g−1, which is much higher than that of the graphite electrode (36 mA h g−1 at 20 A g−1). When the current density returns to 0.05 A g−1, a high capacity of 111 mA h g−1 can be recovered, indicating high reversibility. The GCD curves at various current densities can further demonstrate the excellent rate capability of ZIF-8@Gr (Fig. 4B and C).
The cycling stability of ZIF-8@Gr and graphite is investigated by the GCD test at room temperature (Fig. 4D). The ZIF-8@Gr electrode could be cycled steadily for 15![[thin space (1/6-em)]](https://www.rsc.org/images/entities/char_2009.gif) 000 cycles at 5 A g−1 and still maintains a reversible capacity of 102 mA h g−1, corresponding to a capacity retention of 96%. However, the pristine graphite electrode becomes unstable after 3500 cycles. The results indicate that the cycle stability of the pristine graphite has been greatly improved after coating with ZIF-8. The cycling performance of the two electrodes is further tested at a high current density of 10 A g−1 (Fig. 4G). The ZIF-8@Gr electrode provides a Na+-storage capacity of 108 mA h g−1 and still maintains 94% capacity retention after 20
000 cycles at 5 A g−1 and still maintains a reversible capacity of 102 mA h g−1, corresponding to a capacity retention of 96%. However, the pristine graphite electrode becomes unstable after 3500 cycles. The results indicate that the cycle stability of the pristine graphite has been greatly improved after coating with ZIF-8. The cycling performance of the two electrodes is further tested at a high current density of 10 A g−1 (Fig. 4G). The ZIF-8@Gr electrode provides a Na+-storage capacity of 108 mA h g−1 and still maintains 94% capacity retention after 20![[thin space (1/6-em)]](https://www.rsc.org/images/entities/char_2009.gif) 000 cycles. The Na-storage performance of ZIF-8@Gr is even better than that of graphite materials in the literature (Table S1†). Accordingly, the GCD curves of ZIF-8@Gr have smaller distortion than that of pristine graphite (Fig. 4E and F). To further investigate the diffusion rate of sodium ions in ZIF-8@Gr and graphite, we performed the galvanostatic intermittent titration technique (GITT) test (Fig. 4H). The Na+ diffusion coefficient is calculated (the detailed calculation process in the Experimental section). Fig. 4H shows that the Na+ diffusion coefficient in the ZIF-8@Gr electrode is higher than that of the graphite electrode, indicating that the ZIF-8 layer can effectively accelerate the Na+ storage kinetics.
000 cycles. The Na-storage performance of ZIF-8@Gr is even better than that of graphite materials in the literature (Table S1†). Accordingly, the GCD curves of ZIF-8@Gr have smaller distortion than that of pristine graphite (Fig. 4E and F). To further investigate the diffusion rate of sodium ions in ZIF-8@Gr and graphite, we performed the galvanostatic intermittent titration technique (GITT) test (Fig. 4H). The Na+ diffusion coefficient is calculated (the detailed calculation process in the Experimental section). Fig. 4H shows that the Na+ diffusion coefficient in the ZIF-8@Gr electrode is higher than that of the graphite electrode, indicating that the ZIF-8 layer can effectively accelerate the Na+ storage kinetics.
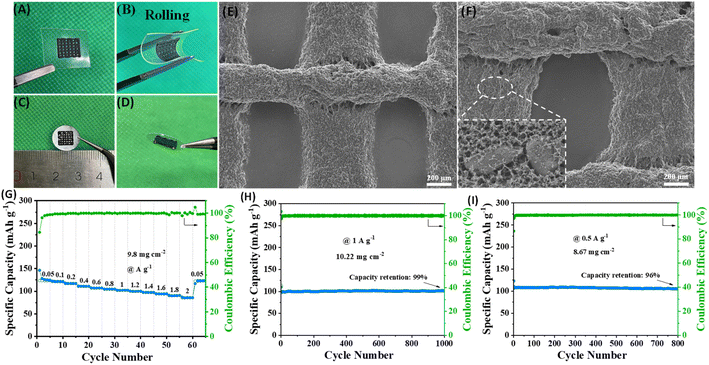
High mass loading is an important indicator for commercialization. Here we used the 3D printing technology to construct high-loading electrodes. The ink is prepared by mixing ZIF-8@Gr with conductive additives and binder homogeneously. A 3D structured electrode is constructed on aluminum foil (Fig. 5C and D) with an average loading of 8 ∼ 10 mg cm−2, which can greatly improve the loading of the electrode (compared to 1 ∼ 2 mg cm−2 in many reported studies). In particular, the 3D printing technology can build the ink on various materials and the electrodes remain unbroken after rolling (Fig. 5A and B), showing high flexibility. The SEM images (Fig. 5E and F) show multiple cylinders with diameters of about 300 μm intersecting with each other to form a three-dimensional conductive porous grid-like electrode, and this shape facilitates the penetration of the electrolyte and the transport of ions.
The CR2302 half-cell was assembled subsequently for electrochemical tests (Fig. 5G–I). The ZIF-8@Gr electrode still exhibits remarkable rate capability at a high mass loading with a high specific capacity of 125 mA h g−1 at 0.05 A g−1, which can still retain 85 mA h g−1 as the current density is increased to 2 A g−1. Gratifyingly, at a high mass loading of 10.22 mg cm−2, the ZIF-8@Gr electrode still has a reversible capacity of 100 mA h g−1 at 1 A g−1. After 1000 cycles, the capacity retention rate can reach an amazing 99% value with almost no decay. Even back to 0.5 A g−1, the 3D-ZIF-8@Gr//Na half-cell has a capacity retention rate of 96% after 800 cycles. The results demonstrate that the ZIF-8@Gr electrode exhibits superior cycling stability in spite of high loadings, satisfying the commercial demand and bringing value to actual applications.
Characterization of cycled electrodes
SEM, EIS and XPS tests are conducted on the cycling electrode (at the 20![[thin space (1/6-em)]](https://www.rsc.org/images/entities/char_2009.gif) 000th cycle) to analyse the composition of the protective interface formed on the surface of ZIF-8@Gr. Coin cells were deconstructed in a glovebox, and the salt species are removed from the electrode surface with the diglyme solution. In the SEM images, the protective interface can be clearly observed on the ZIF-8@Gr surface (Fig. 6A), which can maintain a high structural stability under ultrafast discharge/charge cycles. In contrast, the pristine graphite is obviously exfoliated after cycling (Fig. 6B), further demonstrating the important role of ZIF-8 in constructing a stable electrode–electrolyte interface. We also compared Nyquist plots of graphite and ZIF-8@Gr (Fig. S7 ESI†). The effect of ZIF coating on improving the Na+-storage performance of graphite was further demonstrated. In the initial state, two electrodes exhibit an almost similar resistance, indicating that the thin ZIF layer does not affect the electron transport. After 100 cycles, the resistance of the pristine graphite electrode is largely increased due to the electrolyte decomposition. Interestingly, the resistance of ZIF-8@Gr is obviously decreased after 100 cycles, indicating that the good reversibility of graphite is maintained and that the ion transport layer on graphite during cycling inhibits the decomposition of the electrolyte.
000th cycle) to analyse the composition of the protective interface formed on the surface of ZIF-8@Gr. Coin cells were deconstructed in a glovebox, and the salt species are removed from the electrode surface with the diglyme solution. In the SEM images, the protective interface can be clearly observed on the ZIF-8@Gr surface (Fig. 6A), which can maintain a high structural stability under ultrafast discharge/charge cycles. In contrast, the pristine graphite is obviously exfoliated after cycling (Fig. 6B), further demonstrating the important role of ZIF-8 in constructing a stable electrode–electrolyte interface. We also compared Nyquist plots of graphite and ZIF-8@Gr (Fig. S7 ESI†). The effect of ZIF coating on improving the Na+-storage performance of graphite was further demonstrated. In the initial state, two electrodes exhibit an almost similar resistance, indicating that the thin ZIF layer does not affect the electron transport. After 100 cycles, the resistance of the pristine graphite electrode is largely increased due to the electrolyte decomposition. Interestingly, the resistance of ZIF-8@Gr is obviously decreased after 100 cycles, indicating that the good reversibility of graphite is maintained and that the ion transport layer on graphite during cycling inhibits the decomposition of the electrolyte.
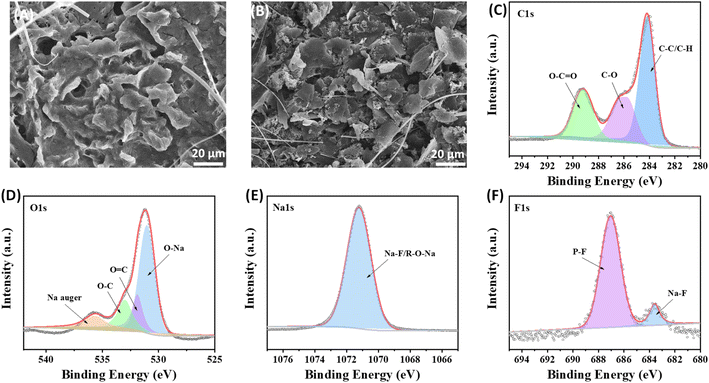 | ||
Fig. 6 SEM images after 20![[thin space (1/6-em)]](https://www.rsc.org/images/entities/char_2009.gif) 000 cycles (a) ZIF-8@Gr, and (b) graphite, and XPS spectra of (c) C 1s, (d) O 1s, (e) Na 1s and (f) F 1s in ZIF-8@Gr. 000 cycles (a) ZIF-8@Gr, and (b) graphite, and XPS spectra of (c) C 1s, (d) O 1s, (e) Na 1s and (f) F 1s in ZIF-8@Gr. | ||
Further observing the XPS spectra of C 1s, there are three characteristic peaks at 289 eV, 286 eV, and 285 eV, corresponding to O–C![[double bond, length as m-dash]](https://www.rsc.org/images/entities/char_e001.gif) O, C–O, and C–C/C–H groups respectively (Fig. 6C). These characteristic peaks are related to substances from electrolyte decomposition, especially alkoxides, ethers, and esters. The O 1s spectrum shows an intense peak around 530 eV, matching the binding energies of metal oxides,34 and also appearing in this spectrum as Na–O, probably taking the form of sodium alkoxide in the protective interface (Fig. 6D). This result is attributed to the Na 1s spectrum. The peak at ∼531.2 eV indicates the presence of O
O, C–O, and C–C/C–H groups respectively (Fig. 6C). These characteristic peaks are related to substances from electrolyte decomposition, especially alkoxides, ethers, and esters. The O 1s spectrum shows an intense peak around 530 eV, matching the binding energies of metal oxides,34 and also appearing in this spectrum as Na–O, probably taking the form of sodium alkoxide in the protective interface (Fig. 6D). This result is attributed to the Na 1s spectrum. The peak at ∼531.2 eV indicates the presence of O![[double bond, length as m-dash]](https://www.rsc.org/images/entities/char_e001.gif) C and the peak at ∼533.1 eV is divided into O–C. In addition, in the Na 1s spectrum, the characteristic peak at 1071 eV is generated by the Na–F bond (Fig. 6E). There are two distinct peaks at ∼687 eV and ∼684.5 eV in the F 1s spectrum (Fig. 6F), corresponding to the P–F and Na–F bonds, respectively, where P–F is caused by the decomposition of the fluorine-containing NaPF6 salt, and NaF is a desirable SEI component. In summary, the above analysis can prove that the composition of the protective interface formed on the ZIF-8@Gr surface is similar to the SEI, which can alleviate the exfoliation phenomenon of graphite. However, volume expansion due to the co-intercalation mechanism is difficult to avoid, the graphite electrode expanded up to 200% and the ZIF-8@Gr electrode expanded to 150% (Fig. S8 ESI†).
C and the peak at ∼533.1 eV is divided into O–C. In addition, in the Na 1s spectrum, the characteristic peak at 1071 eV is generated by the Na–F bond (Fig. 6E). There are two distinct peaks at ∼687 eV and ∼684.5 eV in the F 1s spectrum (Fig. 6F), corresponding to the P–F and Na–F bonds, respectively, where P–F is caused by the decomposition of the fluorine-containing NaPF6 salt, and NaF is a desirable SEI component. In summary, the above analysis can prove that the composition of the protective interface formed on the ZIF-8@Gr surface is similar to the SEI, which can alleviate the exfoliation phenomenon of graphite. However, volume expansion due to the co-intercalation mechanism is difficult to avoid, the graphite electrode expanded up to 200% and the ZIF-8@Gr electrode expanded to 150% (Fig. S8 ESI†).
Electrochemical performance of sodium-ion capacitors
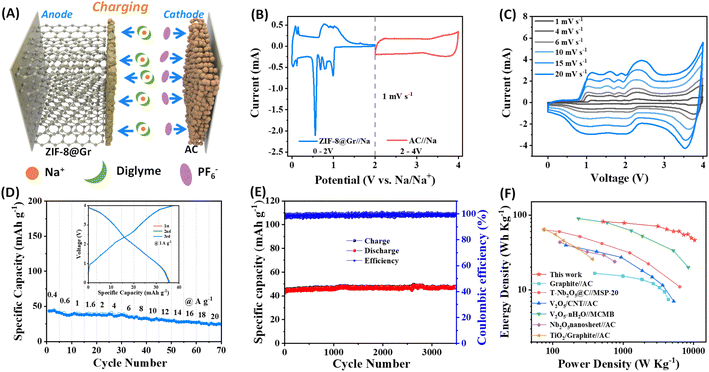
To demonstrate the viability for practical applications, we assembled a sodium ion capacitor (SIC) device using the above ZIF-8@Gr electrode and an activated carbon (AC) as the positive electrode in 1 M NaPF6 in diglyme (Fig. 7A). Based on the potential window verification for ZIF-8@Gr and AC electrodes in half-cells, the operating voltage window is set between 0 and 4 V. During the charging process of SIHC, PF6− ions are adsorbed on the positive electrode of AC, while Na+-solvent is co-intercalated into the ZIF-8@Gr electrode under the electric field. During the discharge process, the Na+-solvent is extracted from ZIF-8@Gr and PF6− ions are also desorbed from AC, and both return into the electrolyte. It should be noted that the pre-sodiation step can be avoided in the graphite electrode due to solvated-Na+ co-intercalation reactions. Fig. 7B shows the current versus voltage signature of the Na//AC and the Na//ZIF-8@Gr half cells under CV measurements at a scan rate of 1 mV s−1. The CV curve of Na//AC exhibits a quasi-rectangular shape, which is a typical capacitance behaviour. By comparing the CV curve of the SIC and the ZIF-8@Gr electrode (Fig. 7C), the redox peaks in CV curves of the SIC are mainly based on the typical staging behavior of the ZIF-8@Gr electrode. When the scan rate gradually increases from 1 mV s−1 to 20 mV s−1, the CV curves have no obvious distortion, demonstrating high reversibility.The rate capability and cycling stability of the ZIF-8@Gr//AC SIC full cell were further investigated via GCD tests (Fig. 7D and E). In the rate test, the current density was up to 20 A g−1, at which the capacity retention was 57% relative to the value at 0.4 A g−1. When the current density was set as 1 A g−1, the capacity of the ZIF-8@Gr//AC SIC device can be stabilized over long-term cycles of up to 3500 cycles. It is important to test the self-discharge data for a capacitor. Therefore, the ZIF-8@Gr//AC SIC device was first charged to 4 V at 0.1 A g−1, and the open-circuit voltage was monitored as a function of time (Fig. S9 ESI†). After 60 h, the voltage dropped from 4 V to 2.7 V, corresponding to a self-discharge rate of ∼21 mV h−1. This value is an order of magnitude lower than that of the nanocarbon-based EDLCs (usually >300 mV h−1). From formulas (2) to (4) in the experimental part†, the energy density and power density of the ZIF-8@Gr//AC SIC device are calculated, and the results are compared with those of other previously reported SICs (Fig. 7F). Significantly, a maximum energy density of 82 W h kg−1 can be obtained at a power density of 518 W kg−1. With the power density increasing to 10![[thin space (1/6-em)]](https://www.rsc.org/images/entities/char_2009.gif) 370 W kg−1, the ZIF-8@Gr//AC SIC can still obtain an energy density of 47 W h kg−1, which is superior to those of the previously reported SICs (Fig. 7F).24,25,35–37 When other inactive components (including aluminum foil, acetylene black, and poly(vinylidene fluoride) (PVDF)) are included for calculation, the energy and power densities will decrease to about 29% of the above values (Fig. S10 ESI†).
370 W kg−1, the ZIF-8@Gr//AC SIC can still obtain an energy density of 47 W h kg−1, which is superior to those of the previously reported SICs (Fig. 7F).24,25,35–37 When other inactive components (including aluminum foil, acetylene black, and poly(vinylidene fluoride) (PVDF)) are included for calculation, the energy and power densities will decrease to about 29% of the above values (Fig. S10 ESI†).
Conclusions
In summary, we report in situ growth of a zeolite imidazole framework layer on a graphite surface (ZIF-8@Gr), to form a heterogeneous interface between ZIF-8 and graphite. This unique structure can provide more adsorption sites for sodium ion transport, and this ZIF-8 layer can also solve the problem of poor cycling stability, because the surface of ZIF-8@Gr will form a unique protective interface after long-term cycles, which can improve the electrode/electrolyte interfacial properties. This ZIF-derived protective layer can not only enhance the rate capability of the commercial graphite electrode in the diglyme electrolyte (90 mA h g−1 at 20 A g−1) but also improve cycle stability (with 94% capacity retention over 20![[thin space (1/6-em)]](https://www.rsc.org/images/entities/char_2009.gif) 000 cycles at 10 A g−1). Utilizing ZIF-8@Gr as the negative electrode material, we successfully fabricated the ZIF-8@Gr//AC SIC device, which demonstrated an impressive power density of 10
000 cycles at 10 A g−1). Utilizing ZIF-8@Gr as the negative electrode material, we successfully fabricated the ZIF-8@Gr//AC SIC device, which demonstrated an impressive power density of 10![[thin space (1/6-em)]](https://www.rsc.org/images/entities/char_2009.gif) 370 W kg−1 and an energy density of 47 W h kg−1. Additionally, we employed advanced 3D printing technology to construct a multilayer mesh electrode with a high loading of 10 mg cm−2. Through the electrochemical performance tests, this electrode exhibited excellent cycle stability and rate capability, showing its significant commercial application. This research develops a novel surface-modification approach to enhance the fast-charging capability of the graphite electrode in sodium-storage.
370 W kg−1 and an energy density of 47 W h kg−1. Additionally, we employed advanced 3D printing technology to construct a multilayer mesh electrode with a high loading of 10 mg cm−2. Through the electrochemical performance tests, this electrode exhibited excellent cycle stability and rate capability, showing its significant commercial application. This research develops a novel surface-modification approach to enhance the fast-charging capability of the graphite electrode in sodium-storage.
Author contributions
H. Wang conceived the project. X. Liang and Z. Mao discussed and designed the experiments. X. Liang, X. Shi and T. Zhang prepared the samples. J. Jin and Z. Zheng carried out the characterization. B. He, R. Wang and Y. Gong participated in the data analysis. All authors discussed the results. X. Liang wrote the manuscript and H. Wang revised the manuscript. All authors have approved the final version of the manuscript.Conflicts of interest
The authors declare no conflict of interest.Acknowledgements
This work was financially supported by the National Natural Science Foundation of China (Grant No. 22279122), Zhejiang Provincial Natural Science Foundation of China (Grant No. LZ22B030004) and Shenzhen Science and Technology Program (Grant No. JCYJ20220530162402005).Notes and references
- Y. Wu, X. Fan, R. R. Gaddam, Q. Zhao, D. Yang, X. Sun, C. Wang and X. S. Zhao, J. Power Sources, 2018, 408, 82–90 CrossRef CAS
.
- J. Xu, Z. Liu, F. Zhang, J. Tao, L. Shen and X. Zhang, RSC Adv., 2020, 10, 7780–7790 RSC
.
- T. Zhang, Z. Mao, X. Shi, J. Jin, B. He, R. Wang, Y. Gong and H. Wang, Energy Environ. Sci., 2022, 15, 158–168 RSC
.
- X. Liu, H. Wang, Y. Cui, X. Xu, H. Zhang, G. Lu, J. Shi, W. Liu, S. Chen and X. Wang, J. Mater. Sci., 2018, 53, 6763–6773 CrossRef CAS
.
- Z. Mao, H. Wang, D. Chao, R. Wang, B. He, Y. Gong and H. J. Fan, Small, 2020, 16, e2001950 CrossRef PubMed
.
- H. Wang, C. Zhu, D. Chao, Q. Yan and H. J. Fan, Adv. Mater., 2017, 29, e2001950 Search PubMed
.
- S. Shiraishi, K. Sunaga and T. Suganuma, Carbon, 2010, 48, 1323 Search PubMed
.
- B. Li, J. Zheng, H. Zhang, L. Jin, D. Yang, H. Lv, C. Shen, A. Shellikeri, Y. Zheng, R. Gong, J. P. Zheng and C. Zhang, Adv. Mater., 2018, 30, e1705670 CrossRef PubMed
.
- D. Lu, X. Lei, S. Weng, R. Li, J. Li, L. Lv, H. Zhang, Y. Huang, J. Zhang, S. Zhang, L. Fan, X. Wang, L. Chen, G. Cui, D. Su and X. Fan, Energy Environ. Sci., 2022, 15, 3331–3342 RSC
.
- B. Chen, L. Zu, Y. Liu, R. Meng, Y. Feng, C. Peng, F. Zhu, T. Hao, J. Ru, Y. Wang and J. Yang, Angew. Chem., Int. Ed., 2020, 59, 3137–3142 CrossRef CAS PubMed
.
- J. Ding, W. Hu, E. Paek and D. Mitlin, Chem. Rev., 2018, 118, 6457–6498 CrossRef CAS PubMed
.
- G. Zou, C. Wang, H. Hou, C. Wang, X. Qiu and X. Ji, Small, 2017, 13, e1700762 CrossRef PubMed
.
- J. Yuan, M. Qiu, X. Hu, Y. Liu, G. Zhong, H. Zhan and Z. Wen, ACS Nano, 2022, 16, 14807–14818 CrossRef CAS PubMed
.
- G. Alvarez Ferrero, G. Åvall, K. A. Mazzio, Y. Son, K. Janßen, S. Risse and P. Adelhelm, Adv. Energy Mater., 2022, 12, e2202377 CrossRef
.
- N. Leifer, M. F. Greenstein, A. Mor, D. Aurbach and G. Goobes, J. Phys. Chem. C, 2018, 122, 21172–21184 CrossRef CAS
.
- Q. Liu, F. Wu, D. Mu and B. Wu, Phys. Chem. Chem. Phys., 2020, 22, 2164–2175 RSC
.
- F. Wang, J. Yi, Y. Wang, C. Wang, J. Wang and Y. Xia, Adv. Energy Mater., 2014, 4, e1300600 CrossRef
.
- H. Kim, J. Hong, G. Yoon, H. Kim, K.-Y. Park, M.-S. Park, W.-S. Yoon and K. Kang, Energy Environ. Sci., 2015, 8, 2963–2969 RSC
.
- J. Chen, X. Fan, X. Ji, T. Gao, S. Hou, X. Zhou, L. Wang, F. Wang, C. Yang, L. Chen and C. Wang, Energy Environ. Sci., 2018, 11, 1218–1225 RSC
.
- Z. Wang, S. M. Selbach and T. Grande, RSC Adv., 2014, 4, 3973–3983 RSC
.
- B. Jache and P. Adelhelm, Angew. Chem., Int. Ed., 2014, 53, 10169–10173 CrossRef CAS PubMed
.
- J. Maibach, F. Jeschull, D. Brandell, K. Edstrom and M. Valvo, ACS Appl. Mater. Interfaces, 2017, 9, 12373–12381 CrossRef CAS PubMed
.
- J. Wang, H. Wang, R. Zhao, Y. Wei, F. Kang and D. Zhai, Nano Lett., 2022, 22, 6359–6365 CrossRef CAS PubMed
.
- X. Liu, T. Wang, T. Zhang, Z. Sun, T. Ji, J. Tian, H. Wang, X. Hao, H. Liu and D. Chao, Adv. Energy Mater., 2022, 12, e2202388 CrossRef
.
- X. Liu, G. A. Elia, B. Qin, H. Zhang, P. Ruschhaupt, S. Fang, A. Varzi and S. Passerini, ACS Energy Lett., 2019, 4, 2675–2682 CrossRef CAS
.
- D. Wang, X. Du and B. Zhang, Small Struct., 2022, 3, e2200078 CrossRef
.
- Z. He, H. Lin, X. Zhang, Y. Chen, W. Bai, Y. Lin, R. Jian and Y. Xu, Colloids Surf., A, 2023, 657, e130601 CrossRef
.
- A. C. S. Jensen, H. Au, S. Gärtner, M. M. Titirici and A. J. Drew, Batteries Supercaps, 2020, 3, 1306–1310 CrossRef CAS
.
- M. Goktas, C. Bolli, E. J. Berg, P. Novák, K. Pollok, F. Langenhorst, M. v. Roeder, O. Lenchuk, D. Mollenhauer and P. Adelhelm, Adv. Energy Mater., 2018, 8, e1702724 CrossRef
.
- M. Goktas, C. Bolli, J. Buchheim, E. J. Berg, P. Novak, F. Bonilla, T. Rojo, S. Komaba, K. Kubota and P. Adelhelm, ACS Appl. Mater. Interfaces, 2019, 11, 32844–32855 CrossRef CAS PubMed
.
- Z. Zhu, F. Cheng, Z. Hu, Z. Niu and J. Chen, J. Power Sources, 2015, 293, 626–634 CrossRef CAS
.
- M. Liu, L. Xing, K. Xu, H. Zhou, J. Lan, C. Wang and W. Li, Energy Storage Mater., 2020, 26, 32–39 CrossRef
.
- A. M. Mosier, H. L. Larson, E. R. Webster, M. Ivos, F. Tian and L. Benz, Langmuir, 2016, 32, 2947–2954 CrossRef CAS PubMed
.
- S. Sarkar, M. J. Lefler, B. S. Vishnugopi, R. B. Nuwayhid, C. T. Love, R. Carter and P. P. Mukherjee, Cell Rep. Phys. Sci., 2023, 4, e101356 CrossRef
.
- J. Dong, Y. Jiang, Q. Wei, S. Tan, Y. Xu, G. Zhang, X. Liao, W. Yang, Q. Li, Q. An and L. Mai, Small, 2019, 15, e1900379 CrossRef PubMed
.
- H. Li, Y. Zhu, S. Dong, L. Shen, Z. Chen, X. Zhang and G. Yu, Chem. Mater., 2016, 28, 5753–5760 CrossRef CAS
.
- Z. Le, F. Liu, P. Nie, X. Li, X. Liu, Z. Bian, G. Chen, H. B. Wu and Y. Lu, ACS Nano, 2017, 11, 2952–2960 CrossRef CAS PubMed
.
Footnote |
| † Electronic supplementary information (ESI) available. See DOI: https://doi.org/10.1039/d3ta03404f |
| This journal is © The Royal Society of Chemistry 2023 |


