A zwitterionic polymer containing a hydrophobic group: enhanced rheological properties†
Ling
Liu
a,
Shaohua
Gou
 *ab,
Huichao
Zhang
c,
Lihua
Zhou
a,
Lan
Tang
a and
Lang
Liu
a
aOil and Gas Field Applied Chemistry Key Laboratory of Sichuan Province, Southwest Petroleum University, Chengdu 610500, China
bState Key Laboratory of Oil and Gas Reservoir Geology and Exploitation, Southwest Petroleum university, Chengdu 610500, China
cHenan Energy and Chemical Group Co., Ltd, China
First published on 1st June 2020
Abstract
A zwitterionic polymer containing a hydrophobic long chain, named MANPS, was independently developed by free radical solution polymerization. The introduction of an hydrophobic long-chain monomer, namely, octadec-9-enioc acid allylamide (NAE) and an amphoteric ionic monomer, i.e., 3-(3-methylacrylamide propyl dimethylamino)-propyl-1-sulfonate (MEPS) in conventional acrylamide (AM) and acrylic acid (AA) enhanced the rheological properties of polymer flooding agents, thereby improving their temperature resistance and salt tolerance. A series of experiments were performed to determine the optimal reaction conditions for the polymer; the structure and molecular weight characteristics of MANPS were confirmed by FT-IR spectroscopy, 1H NMR spectroscopy, intrinsic viscosity, high-performance liquid chromatography (HPLC) and SEM. The rheological test results showed that MANPS had higher apparent viscosity than the partially hydrolyzed polyacrylamide (HPAM). It exhibited good shear recovery at a certain shear rate. The reason was considered to be the long-chain entanglement of molecules and the “anti-polyelectrolyte action” of zwitterions. Thermogravimetric analysis provided good evidence of the thermal properties of the copolymer MANPS. Evaluating the oil displacement performance of the oil-displacing agent was an essential part. The results showed that the copolymer MANPS was comparable to HPAM having a 10.4% higher oil displacement rate under the same concentration and test conditions.
1 Introduction
In recent years, oil has been an irreplaceable necessity for human life, such as in the fields of fuels, plastics, asphalt, clothing and scientific research.1,2 However, the production of oil has not fully met the current needs. Fortunately, some reliable studies have indicated that much of the crude oil in the formation can be effectively extracted by polymer flooding.3–5 For polymer flooding, the viscosity and viscoelasticity of the displacement solution are two key factors. The reason is that the polymer flooding technology to enhance oil recovery is mainly conducted by increasing the sweep volume and displacement efficiency of the displacement solution.6,7 Partially hydrolyzed polyacrylamide (HPAM)8,9 as the commonly used polymer for enhanced oil recovery (EOR) often suffers a significant decrease in its own viscosity10,11 due to the high temperature and high salinity of the formation.12–15 Consequently, it is of great importance to develop novel HPAM substitutes with good viscosity and viscoelasticity even under high-temperature and high-salinity conditions.On the other hand, according to the oil-displacement mechanism, it is inevitable that the oil-displacing polymer should have good rheological properties.16–20 Many studies have reported that by introducing hydrophobic groups or anionic and cationic groups into the HPAM molecular chain, the temperature and salt resistance of the polymer can be effectively improved through intermolecular interactions (hydrogen bonds, van der Waals forces, Coulomb forces, etc.).21–23 Furthermore, due to the hydrophilic macromolecule chain and a small amount of hydrophobic groups of the hydrophobically associating polymer, this kind of polymer solution has unique properties.24,25 In order to further improve the rheological properties of the HPAM substitutes, an effective method is to introduce some anionic and cationic groups and hydrophobic groups to form a novel zwitterionic polymer.
Lately, articles on amphoteric ionic polymers have been widely reported. Banerjee et al.26 successfully synthesized an L-lysine-based amphoteric ionic polymer (PLAM) by water-based synthesis and found that under different acid–base conditions, the polymer (PLAM) could interact with Cu(II) ions to form spherical aggregates or dissociate into free polymer chains. Zheng et al.27 reviewed the application progress of an amphoteric ionic polymer at the molecular level and pointed out that the amphoteric ionic polymer has great development potential in the future. Ibrahim et al.28 synthesized amphoteric polymer nanoparticles via distillation–precipitation polymerization (DPP) using [2-(methyl propylene oxide) ethyl] dimethyl sulfur propyl (3-) ammonium hydroxide (SBMA) as the monomer and N,N′-methylene double (acrylamide) (MBAAm) as the crosslinking agent. Blackman et al.29 summarized the structure of different amphoteric ion monomers and the preparation methods of their polymers. In addition, their response behavior and potential applications under different environmental stimuli (temperature, pH, salt, and dual-reaction systems) were summarized.
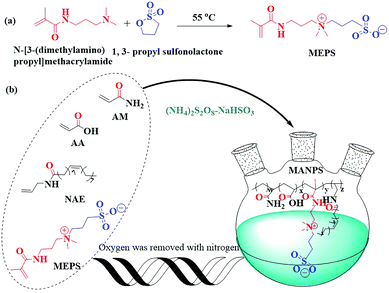
In this article, a zwitterionic polymer containing a hydrophobic long chain, named MANPS, was independently developed by free radical solution polymerization using octadec-9-enioc acid allylamide (NAE) as a hydrophobic monomer. The polymerization conditions and solution properties of MANPS were investigated. We analyzed the synthesized amphoteric ionic monomer 3-(3-methylacrylamide propyl dimethylamino)-propyl-1-sulfonate (MEPS) using FT-IR and 1H NMR, and determined the FT-IR, 1H NMR, SEM and intrinsic viscosity of MANPS. In addition, a series of rheological tests proved that MANPS had good temperature resistance, salt tolerance, shear recovery and thixotropy. It was proved by a simulated flooding experiment that this novel polymer MANPS can enhance oil recovery in harsh reservoir environments.
2 Experimental section
2.1 Materials
Acrylamide (AM), acrylic acid (AA), sodium hydroxide (NaOH), ammonium persulfate ((NH4)2S2O8), sodium hydrogen sulfite (NaHSO3), sodium chloride (NaCl), magnesium chloride (MgCl2), calcium chloride (CaCl2), N-[3-(dimethylamino)propyl]methacrylamide, 1,3-propyl sulfonolactone and 4,4′-methylenebis(2,6-di-tert-butylphenol) were purchased from Chengdu Kelong Chemical Reagents Corporation (Chengdu, China). HPAM, with a relative molecular weight of about 1.3 × 10⁷, was from Daqing Refining & Chemical Company (China). The functional sulfonate monomer MEPS was prepared in the laboratory. The hydrophobic monomer NAE was prepared according to the literature.302.2 Synthetic methods
![[thin space (1/6-em)]](https://www.rsc.org/images/entities/char_2009.gif) :
:![[thin space (1/6-em)]](https://www.rsc.org/images/entities/char_2009.gif) 140
140![[thin space (1/6-em)]](https://www.rsc.org/images/entities/char_2009.gif) :
:![[thin space (1/6-em)]](https://www.rsc.org/images/entities/char_2009.gif) 1.5
1.5![[thin space (1/6-em)]](https://www.rsc.org/images/entities/char_2009.gif) :
:![[thin space (1/6-em)]](https://www.rsc.org/images/entities/char_2009.gif) 1. After being adjusted to a pH of 7, the solution was then transferred to a super thermostatic water bath. Initiators (NH4)2S2O8 and NaHSO3 accounted for 0.0642‰ of the total moles of monomer (the molar ratio was controlled at 1
1. After being adjusted to a pH of 7, the solution was then transferred to a super thermostatic water bath. Initiators (NH4)2S2O8 and NaHSO3 accounted for 0.0642‰ of the total moles of monomer (the molar ratio was controlled at 1![[thin space (1/6-em)]](https://www.rsc.org/images/entities/char_2009.gif) :
:![[thin space (1/6-em)]](https://www.rsc.org/images/entities/char_2009.gif) 1) were added into the reaction system under a nitrogen atmosphere at the indicated temperature. After reacting for 8 h at 50 °C, the copolymer gels were precipitated and washed with anhydrous ethanol to remove the unreacted monomers and initiators, and then dried at 60 °C in a vacuum for 10 h to obtain the corresponding copolymers, MANPS.
1) were added into the reaction system under a nitrogen atmosphere at the indicated temperature. After reacting for 8 h at 50 °C, the copolymer gels were precipitated and washed with anhydrous ethanol to remove the unreacted monomers and initiators, and then dried at 60 °C in a vacuum for 10 h to obtain the corresponding copolymers, MANPS.
2.3 Characterization
FT-IR spectra of the samples were obtained via a WQF-520 Fourier transform infrared spectrometer in the optical range of 4000–500 cm−1. 1H NMR spectra were measured on a Bruker AM 400 MHz NMR spectrometer using D2O as the solvent. The intrinsic viscosity of the MANPS copolymer was determined by the dilution method32 with an NCY automatic Ubbelohde capillary viscometer (0.55 mm) (Shanghai Sikeda Scientific Instruments Inc., Shanghai, China) at 30 ± 0.1 °C. Copolymer composition was determined by HPLC (LC-20A, Hitachi, Tokyo, Japan). The test conditions were set as follows: ODS column, V(H2O)![[thin space (1/6-em)]](https://www.rsc.org/images/entities/char_2009.gif) :
:![[thin space (1/6-em)]](https://www.rsc.org/images/entities/char_2009.gif) V(CH3OH) = 1
V(CH3OH) = 1![[thin space (1/6-em)]](https://www.rsc.org/images/entities/char_2009.gif) :
:![[thin space (1/6-em)]](https://www.rsc.org/images/entities/char_2009.gif) 9, 210 nm, 40 °C, 1.0 mL min−1. Scanning electron microscopy (SEM) analyses of HPAM and MANPS were acquired with an FEI Quanta 450 (FEI, USA). TG-DTG was carried out on an STA449 F3 synchronous thermal analyzer under a nitrogen flow rate of 60 mL min−1 with the heating rate of 10 °C min−1. It is worth noting that the temperature range was 40–800 °C.
9, 210 nm, 40 °C, 1.0 mL min−1. Scanning electron microscopy (SEM) analyses of HPAM and MANPS were acquired with an FEI Quanta 450 (FEI, USA). TG-DTG was carried out on an STA449 F3 synchronous thermal analyzer under a nitrogen flow rate of 60 mL min−1 with the heating rate of 10 °C min−1. It is worth noting that the temperature range was 40–800 °C.
2.4 Rheological properties
| Inorganic ions | Na+ | Mg2+ | Ca2+ | Cl− | CO32− | HCO3− | SO42− |
|---|---|---|---|---|---|---|---|
| Content (mg L−1) | 2903 | 150 | 236 | 5185 | 164 | 285 | 100 |
2.5 Displacement experiment
The displacement efficiencies of the two polymers, HPAM and MANPS, were evaluated by core flooding experiments. The injection pressure was recorded to calculate the resistance factor (RF) and residual resistance factor (RRF), and the method to obtain the results was as follows: | (1) |
 | (2) |
First, the water flooding was carried out at a speed of 0.7 mL min−1 until the water content reached 99%. The copolymer solution was then injected for displacement at the rate of 0.7 mL min−1. Finally, the water flooding was performed again until the water content was 99%. The EOR percentage was obtained as follows:
| EOR = E − Ew | (3) |
3 Results and discussion
3.1 Characterization
Before the tests below, the influencing conditions, such as monomer ratio, initiator ratio, temperature and pH, etc., of the synthetic polymer MANPS were optimized through experiments. The specific optimization schemes are shown in Tables S1 and S2 (ESI†), and Table 2 gives the optimal reaction conditions.![[double bond, length as m-dash]](https://www.rsc.org/images/entities/char_e001.gif) C and C
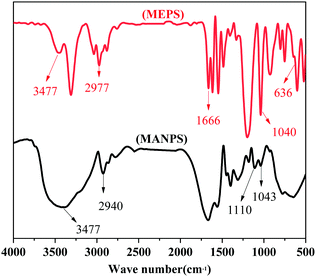
C and C![[double bond, length as m-dash]](https://www.rsc.org/images/entities/char_e001.gif) O, respectively. The copolymer MANPS exhibited strong absorption peaks at 3417 cm−1, 1665 cm−1 and 1110 cm−1, which respectively reflected the peak spectra of –OH, C
O, respectively. The copolymer MANPS exhibited strong absorption peaks at 3417 cm−1, 1665 cm−1 and 1110 cm−1, which respectively reflected the peak spectra of –OH, C![[double bond, length as m-dash]](https://www.rsc.org/images/entities/char_e001.gif) O and S
O and S![[double bond, length as m-dash]](https://www.rsc.org/images/entities/char_e001.gif) O. Additionally, another peak appeared at 636 cm−1, which was the bending vibration absorption peak of N–H in the amide. Based on IR spectroscopy, the sample structure was in line with the designed macromolecular structure, indicating that the functional monomer MEPS was successfully introduced into the backbone of MANPS, and the expected effect was achieved.
O. Additionally, another peak appeared at 636 cm−1, which was the bending vibration absorption peak of N–H in the amide. Based on IR spectroscopy, the sample structure was in line with the designed macromolecular structure, indicating that the functional monomer MEPS was successfully introduced into the backbone of MANPS, and the expected effect was achieved.
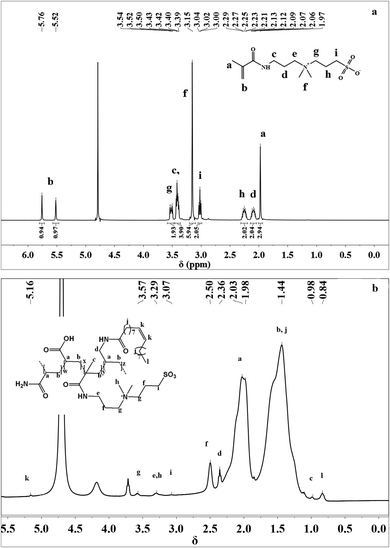
![[double bond, length as m-dash]](https://www.rsc.org/images/entities/char_e001.gif) CH2 proton peak, and the chemical shift at δ = 3.00–3.04 ppm was attributed to the –CH2–CH2–SO3– proton peak. The proton signals at 3.39–3.40 ppm showed the existence of –C(O)–NH–CH2– groups. The chemical shift at δ = 3.15 ppm was attributed to the –N+(CH3)2– proton peak, and the chemical shift at δ = 3.42–3.54 ppm was attributed to –CH2–N+(CH3)2–CH2–. The proton signals at 2.06–2.12 ppm were due to –C(O)–NH–CH2–CH2– groups. The chemical shift at δ = 1.97 ppm was attributed to the –CH2
CH2 proton peak, and the chemical shift at δ = 3.00–3.04 ppm was attributed to the –CH2–CH2–SO3– proton peak. The proton signals at 3.39–3.40 ppm showed the existence of –C(O)–NH–CH2– groups. The chemical shift at δ = 3.15 ppm was attributed to the –N+(CH3)2– proton peak, and the chemical shift at δ = 3.42–3.54 ppm was attributed to –CH2–N+(CH3)2–CH2–. The proton signals at 2.06–2.12 ppm were due to –C(O)–NH–CH2–CH2– groups. The chemical shift at δ = 1.97 ppm was attributed to the –CH2![[double bond, length as m-dash]](https://www.rsc.org/images/entities/char_e001.gif) C(CH3)– proton peaks. The proton signals at 2.23–2.29 ppm were due to –CH2–CH2–SO3– groups.
C(CH3)– proton peaks. The proton signals at 2.23–2.29 ppm were due to –CH2–CH2–SO3– groups.
The 1H NMR spectrum of MANPS is shown in Fig. 3(b). It can be seen that the –CH![[double bond, length as m-dash]](https://www.rsc.org/images/entities/char_e001.gif) CH– protons in the NAE monomer appeared at δ = 5.16 ppm. The proton signal at 3.57 ppm was due to –CH2–N+(CH3)2–CH2– groups. The signal at δ = 3.29 ppm was due to the proton in –CH3 connected to N+ and in –CH2 connected to –NH. The chemical shift at δ = 3.07 ppm was attributed to the –CH2–CH2–SO3– proton peak. The proton signal at 2.50 ppm was due to –CH2–CH2–SO3– groups. Additionally, the existence of the proton peak at δ = 2.36 ppm was due to –CO–NH–CH2–. The proton signal at 1.98–2.03 ppm showed the existence of [NH2–CO–CH–] groups and it was obvious that the protons of the –CH2– group of the main copolymer chain appeared at 1.44 ppm. The proton peak at δ = 0.84 ppm was due to –CH3 connected to –(CH2)7– groups.
CH– protons in the NAE monomer appeared at δ = 5.16 ppm. The proton signal at 3.57 ppm was due to –CH2–N+(CH3)2–CH2– groups. The signal at δ = 3.29 ppm was due to the proton in –CH3 connected to N+ and in –CH2 connected to –NH. The chemical shift at δ = 3.07 ppm was attributed to the –CH2–CH2–SO3– proton peak. The proton signal at 2.50 ppm was due to –CH2–CH2–SO3– groups. Additionally, the existence of the proton peak at δ = 2.36 ppm was due to –CO–NH–CH2–. The proton signal at 1.98–2.03 ppm showed the existence of [NH2–CO–CH–] groups and it was obvious that the protons of the –CH2– group of the main copolymer chain appeared at 1.44 ppm. The proton peak at δ = 0.84 ppm was due to –CH3 connected to –(CH2)7– groups.
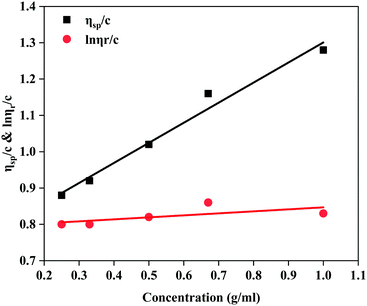
![[thin space (1/6-em)]](https://www.rsc.org/images/entities/char_2009.gif) ηr)/C vs. C are described in Fig. 4. Combining Fig. 4 and the formulae ηr = t/t0, ηsp = ηr − 1 and [η] = H/C0, it was determined that the intrinsic viscosity number of MANPS was 772 mg L−1.
ηr)/C vs. C are described in Fig. 4. Combining Fig. 4 and the formulae ηr = t/t0, ηsp = ηr − 1 and [η] = H/C0, it was determined that the intrinsic viscosity number of MANPS was 772 mg L−1.
![[thin space (1/6-em)]](https://www.rsc.org/images/entities/char_2009.gif) 4374.5; AAA = 1.2982 × 10⁷ × ρ + 38
4374.5; AAA = 1.2982 × 10⁷ × ρ + 38![[thin space (1/6-em)]](https://www.rsc.org/images/entities/char_2009.gif) 643.6; AMEPS = 4218.56 × ρ + 1105.9. Further, the conversion ratio of each component and its proportion in the copolymer were calculated from formula (4), and the results are shown in Table 3.
643.6; AMEPS = 4218.56 × ρ + 1105.9. Further, the conversion ratio of each component and its proportion in the copolymer were calculated from formula (4), and the results are shown in Table 3. | (4) |
| Entry | Molar ratio of reactants (%) | Molar composition (%) | ||||||
|---|---|---|---|---|---|---|---|---|
| AM | AA | MEPS | NAE | AM | AA | MEPS | NAE | |
| a All data are the average of three measurements with an error of ±0.1. | ||||||||
| MANPS | 69.93 | 29.56 | 0.28 | 0.23 | 69.99 | 29.58 | 0.25 | 0.18 |
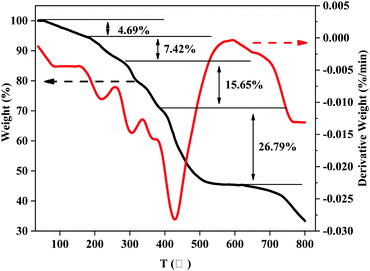
The first weight-loss stage with 4.69% was at 43–173 °C, which can be attributed to the loss of water, ethanol and other small molecules. The second stage was at 173–277 °C, with a 7.42% weight loss rate, which was estimated to be the decomposition of the side group, macromolecular chain and branching of MANPS. The third stage of weight loss at 277–383 °C was for the decomposition of the polymer backbone. The fourth stage occurred at 383–618 °C, which was probably due to the carbonization of the polymer particles. The last stage of weight loss caused by the further carbonization of polymer particles was above 618 °C.
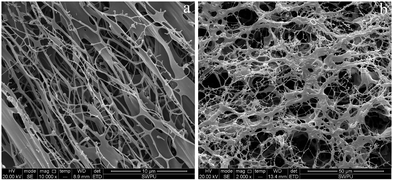
Intuitively, the microscopic appearance of both polymers showed a network structure with attached backbones. Most notably, the linkage backbone of HPAM was significantly weaker than that of MANPS with a distinct cavity network structure. This phenomenon can be attributed to the hydrophobic association, thus strengthening the tangle of molecular chains and creating a more robust backbone connection. In addition, the molecular chains in Fig. 6(a) were sparsely distributed without forming many crosslinking points or entangling with each other. In contrast, the branched chains in Fig. 6(b) were entangled with each other, thus forming a dense crosslinking network. The different micromorphologies of the two polymers indirectly confirmed the feasibility of the experiment and indicate the potential for the excellent properties of MANPS.
3.2 Rheological properties analysis of HPAM and MANPS
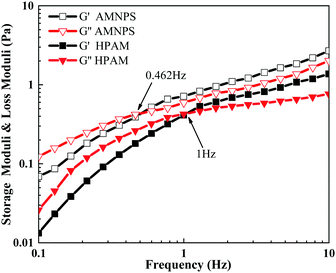
As shown in Fig. 7, at the scanning frequency of 0.1–10 Hz, with increased scanning frequency, the long molecular chains were more severely entangled, the storage modulus (G′) and the energy dissipation modulus (G′′) of HPAM and MANPS both showed a gradual increase. At the scanning frequency of 0.1–0.5 Hz, the growth of G′ of the copolymer MANPS was larger than that of G′′, and G′ < G′′, indicating that the copolymer solution was mainly viscous at low frequencies. However, when the scanning frequency exceeded 0.462 Hz (G′ > G′′), the solution of copolymer MANPS showed mainly elasticity at high frequencies. However, for HPAM, the demarcation point frequency at viscosity and elasticity occurred at 1 Hz. In addition, in the scanning frequency range of 0.1–10 Hz, the G′ and G′′ of the MANPS copolymer were higher as compared to HPAM, and the solution of MANPS demonstrated obvious elasticity at lower frequencies, which was more conducive to improving the oil displacement performance of the polymer solution. The reason the viscoelasticity of MANPS was better than that of HPAM was mainly that its hydrophobic groups aggregated in aqueous solution owing to hydrophobic interactions, thus inducing the separation of macromolecular chains. Intermolecular association generated a stable physical cross-linking network, which allowed MANPS to have excellent viscoelasticity.
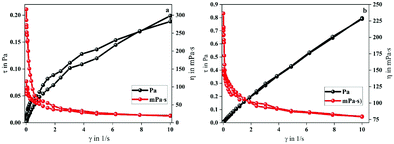
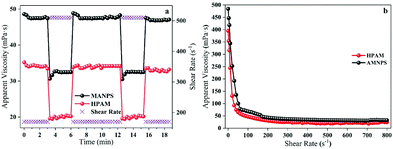
The larger area of the MANPS thixotropic ring indicated that the stability of the molecular structure of MANPS was better than that of HPAM. Moreover, from both figures we can see that the viscosity of both polymers decreased as the shear rate increased. However, when the shear rate gradually decreased, the viscosity of the two increased but the final viscosity value of MANPS was closer to the initial value. This shows that the cross-linked network formed by MANPS has a stable structure and strong spatial recovery, indirectly implying that the MANPS system would have excellent shear reversibility. Predictably, the use of the MANPS oil-displacing agent can greatly reduce the fluid flow resistance, which will make it more conducive to improving the displacement efficiency of low permeability reservoirs.
Shear reversibility. When the polymer solution is injected into the formation, due to the high shear rate, the easily broken molecular structure will lead to a lower apparent viscosity,41 resulting in a decrease in the oil displacement efficiency. Therefore, for the polymer to have excellent performance, on the one hand, it should have good shear sensitivity; on the other hand, its structure should not be destroyed. Fortunately, from the thixotropy experiment, we found that MANPS had good shear reversibility, and may be different from HPAM to some extent. The curves of the shear recovery of the polymers are shown in Fig. 9a. When the shear rate suddenly changed from 170 s−1 to 510 s−1, the viscosity of the polymer solution decreased significantly, which was attributed to the destruction of the associated spatial network structure under high shear. Nevertheless, when the shear rate recovered from 510 s−1 to 170 s−1, thanks to the re-formation of the space network, the viscosity of the polymer solution recovered immediately (Fig. 9a). For the MANPS polymer solution, the viscosity recovery rate reached 98.9% as compared to 96.9% for HPAM, indicating that MANPS performed better in shear recovery.
In summary, the excellent shear sensitivity and shear recovery properties of MANPS help it maintain a high viscosity and smoothly reach the formation without the effect of the high-speed rotation of the injection equipment.
Salt-resistance. In general, from Fig. 10a–c, the apparent viscosity of the MANPS solution began to show a decline with the increase in salinity, and then the downward trend suddenly subsided and some hills were seen due to the effect of the anti-polyelectrolyte. After the anti-polyelectrolyte effect, the viscosity dropped sharply and finally became stable. When NaCl, CaCl2 or MgCl2 (Fig. 10a–c) was added to the polymer solution, the viscosity retention of the MANPS solution was 50.67 mPa s, 38.9 mPa s and 38.04 mPa s, respectively (which was higher as compared to 40.59 mPa s, 22.67 mPa s, 23.98 mPa s for HPAM). This suggests that the salt resistance of MANPS was better than that of HPAM. Additionally, it is important to note here that the zwitterionic polymer MANPS had equal numbers of anions and cations,42,43 which can cause the inner chain anions and cations in the deionized water to attract each other and bend the molecular chain, leading to small hydrodynamic volume and low viscosity. However, in salt solution, the unequal numbers of zwitterions weakened the attraction of the inner chain of the molecule and the hydrodynamics interaction did not decrease but rise, showing the anti-polyelectrolyte effect.44 This result can be explained by the fact that under the action of the inorganic salt, the polarity of the solution was increased to enhance the hydrophobic association of the molecular side chains, and the structural strength of the dynamic physical crosslinking network was increased.
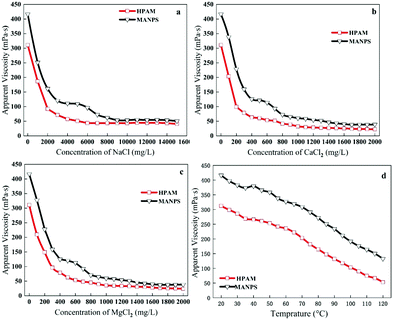 | ||
| Fig. 10 Anti-Na+ (a), Ca2+ (b), Mg2+ (c) performance of the polymer solution; polymer temperature resistance performance evaluation (d). | ||
Temperature-resistance. The experiment describes the change in the apparent viscosity of the 2000 mg L−1 MANPS polymer solution at different temperatures as compared with the HPAM solution.
The trend of the apparent viscosity with the change in temperature is shown in Fig. 10d. At 7.34 s−1, the apparent viscosity of HPAM and MANPS decreased with the increasing temperature but the apparent viscosity of MANPS was always higher than that of HPAM at the same temperature (Fig. 10a). This was because the physically cross-linked network structure of MANPS was more robust, so the degree of destruction was lower than that of HPAM. As the temperature reached 90 °C, the apparent viscosity of MANPS was 50.3 mPa s, which was higher than 25.0 mPa s of HPAM. When the temperature was 120 °C, the apparent viscosity of the MANPS was 45.8 mPa s, which was also higher than the 23.6 mPa s of HPAM. This phenomenon showed that MANPS had a significant improvement in temperature resistance as compared to HPAM.
3.3 Enhanced oil recovery of HPAM and MANPS
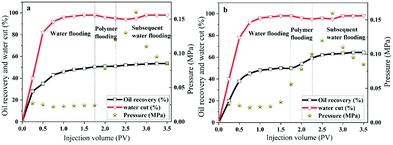
To compare the displacement effects of the two polymers HPAM and MANPS, a core displacement experiment was performed, and the results are shown in Fig. 11. Apparently, at the beginning of the injection, the water content, injection pressure and oil recovery rate all showed a sharp rise and then gradually stabilized with the injection of simulated formation water in the water flooding stage. The water drive of each core was harvested, and the oil recovery rates were 50.5% (a) and 50.0% (b), respectively. When the oil recovery rate could no longer increase in water flooding, the copolymer salt solution was injected into the cores, resulting in a larger injection pressure. With the decrease in the water content, the oil recovery of the HPAM and MANPS salt solution reached 51% (Fig. 11a) and 59% (Fig. 11b), respectively, in the polymer injection stage. Correspondingly, HPAM and MANPS increased the recovery to 53.5% and 64.4% in the final stage. Consequently, HPAM and MANPS can respectively increase oil recovery by 3.0% and 13.4%, which indicate that copolymer MANPS had the greater potential in practical oil flooding applications. Copolymer MANPS produced a hydrophobic association effect in aqueous solution,45,46 which made it retain high viscosity under high temperature and high salinity conditions, effectively reducing the oil–water mobility ratio and thus carrying more residual oil to improve the oil displacement performance.4 Conclusions
In this work, a zwitterionic polymer, MANPS, containing a hydrophobic long chain was prepared from AM, AA, NAE and MEPS. Its good rheological properties, thixotropic properties and shear recovery properties endowed it with huge potential for EOR. Its good temperature resistance and salt tolerance made it resistant to the high temperature and high salinity of the formation. The effects of the monomer addition ratio, reaction temperature, initiator addition amount and pH on the polymer were investigated systematically. FT-IR, 1H NMR, intrinsic viscosity, HPLC and SEM were applied to characterize the structure and molecular weight of MANPS. The viscoelasticity test results showed that the polymer had excellent viscoelastic properties. At the shear rates of 0.01 s−1 to 10 s−1, MANPS had better thixotropic properties than HPAM. At a shear rate of 505 s−1, the viscosity of the MAPNS solution was 33.87 mPa s, and the decline in the viscosity was 93.30%; at a shear rate of 170 s−1, the viscosity of the zwitterionic polymer was 47.1 mPa s at 120 °C, indicating its good shear sensitivity. Thermogravimetric analysis showed that the copolymer had good thermostability. The rheological results exhibited that when a certain amount of NaCl, CaCl2 and MgCl2 were added to the polymer solution, the viscosity retentions of the MANPS solution were 50.67 mPa s, 38.9 mPa s and 38.04 mPa s, respectively. The simulated oil displacement experiment showed that MANPS had a 10.4% higher oil displacement rate under the same concentration and test conditions as compared to HPAM, which indicates its potential for oil displacement.Conflicts of interest
There are no conflicts to declare.Acknowledgements
This work is supported by Southwest Petroleum University Graduate Teaching and Research Teaching Reform Project [18YJYB16], Science and Technology Innovation Seedling Project of Sichuan Province [2019092] (China). We also would like to express our gratitude to the editors and reviewers for the recommendations to improve the quality of this work.Notes and references
- W. T. Frankenberger and J. B. Johanson, J. Environ. Qual., 1982, 11, 602–607 CrossRef CAS.
- V. E. Galtsev, I. M. Ametov and O. Y. Grinberg, Fuel, 1995, 74, 670–673 CrossRef CAS.
- J. Yao, X. Deng, Y. Zhao, T. Han, M. Chu and J. Pang, Pet. Explor. Dev., 2013, 40, 161–169 CrossRef.
- M. Chahardowli, R. Farajzadeh and H. Bruining, J. Ind. Eng. Chem., 2016, 38, 50–60 CrossRef CAS.
- J. Sun, W. Du, X. Pu, Z. Zhou and B. Zhu, Chem. Pap., 2015, 69, 1598–1607 CAS.
- V. C. Santanna, F. Curbelo, T. C. Dantas, A. D. Neto, H. S. Albuquerque and A. Garnica, J. Pet. Sci. Eng., 2009, 66, 117–120 CrossRef CAS.
- H. Liu, C. Xiong, Z. Tao, Y. Fan, X. Tang and H. Yang, RSC Adv., 2015, 5, 33083–33088 RSC.
- S. Abdel-Azeim and M. Y. Kanj, Energy Fuels, 2018, 32, 3335–3343 CrossRef CAS.
- A. Samanta, K. Ojha, A. Sarkar and A. Mandal, Int. J. Oil Gas Coal Technol., 2013, 6, 245 CrossRef CAS.
- X. Li, Z. Xu, H. Yin and Y. Feng, Energy Fuels, 2017, 31, 2479–2487 CrossRef CAS.
- T. Li, T. Ci, L. Chen and L. Yu, Polym. Chem., 2013, 5, 979–991 RSC.
- K. Spildo and E. I. Sæ, Energy Fuels, 2015, 29, 5609–5617 CrossRef CAS.
- A. Ait-Kadi, P. J. Carreau and G. Chauveteau, J. Rheol., 1987, 31, 537–561 CrossRef CAS.
- K. C. Tam and C. Tiu, Colloid Polym. Sci., 1994, 272, 516–522 CrossRef CAS.
- A. Samanta, A. Bera and K. Ojha, J. Chem. Eng. Data, 2010, 55, 4315–4322 CrossRef CAS.
- Z. Zhang, J. Li and J. Zhou, Transp. Porous Media, 2011, 86, 199–214 CrossRef CAS.
- Y. Ruan, R. R. Davison and C. J. Glover, Fuel, 2003, 82, 1763–1773 CrossRef CAS.
- K. Lewandowska, J. Appl. Polym. Sci., 2007, 103, 2235–2241 CrossRef CAS.
- Z. Zhang, J. Li and J. Zhou, Transp. Porous Media, 2011, 86, 199–214 CrossRef CAS.
- M. S. Azad, Y. Dalsania and J. J. Trivedi, Can. J. Chem. Eng., 2018, 96, 2498–2508 CrossRef CAS.
- F. Candau, S. Biggs, A. Hill and J. Selb, Prog. Org. Coat., 1994, 24, 11–19 CrossRef CAS.
- N. Lai, W. Dong and Z. Ye, J. Appl. Polym. Sci., 2013, 129, 1888–1896 CrossRef CAS.
- G. Li, G. Zhang and L. Wang, Energy Fuels, 2013, 27, 6632–6636 CrossRef CAS.
- C. Wang, T. Yang, T. Wang and L. W. Qiu, Int. J. Biol. Macromol., 2018, 111, 169–177 CrossRef CAS PubMed.
- J. Ma, P. Cui, L. Zhao and R. H. Wang, Eur. Polym. J., 2002, 38, 1627–1633 CrossRef CAS.
- S. Banerjee, T. Maji, T. K. Paira and T. K. Mandal, Macromol. Rapid Commun., 2013, 34, 1480–1486 CrossRef CAS PubMed.
- L. Zheng, S. S. Harihara, Z. Wei, C. Li and Z. Yuan, React. Funct. Polym., 2017, 118, 51–61 CrossRef CAS.
- G. P. S. Ibrahim, A. M. Isloor, Inamuddin, A. M. Asiri, N. Ismail, A. F. Ismail and G. Ashraf, Sci. Rep., 2017, 7, 15889 CrossRef PubMed.
- L. D. Blackman, P. A. Gunatillake, P. Cass and K. Locock, Chem. Soc. Rev., 2019, 48, 757–770 RSC.
- Z. Ye, M. Feng and S. Gou, J. Appl. Polym. Sci., 2013, 130, 2901–2911 CrossRef CAS.
- S. Gou, Y. He, L. Zhou, P. Zhao, Q. Zhang, S. Li and Q. Guo, New J. Chem., 2015, 39, 9265–9274 RSC.
- P. Rani, G. Sen, S. Mishra and U. Jha, Carbohydr. Polym., 2012, 89, 275–281 CrossRef CAS PubMed.
- R. Zhao and C. W. Macosko, J. Rheol., 2002, 46, 145 CrossRef CAS.
- R. Zhao and C. W. Macosko, AIChE J., 2007, 53, 978–985 CrossRef CAS.
- L. Wang, J. Liu, S. Yuan, Y. Wang and Y. Xia, Energy Environ. Sci., 2016, 9, 224–231 RSC.
- S. Fujishige, Polym. J., 1987, 19, 297–300 CrossRef CAS.
- T. H. Mourey, S. R. Turner and M. Rubinstein, Macromolecules, 1992, 25, 2401–2406 CrossRef CAS.
- Q. Wu, S. Gou, Y. Fei, X. Yang, M. Liu and J. Huang, Polymers, 2019, 11, 1781 CrossRef CAS PubMed.
- K. Hosoya, K. Yoshizako, Y. Shirasu, K. Kimata, T. Araki, N. Tanaka and J. Haginaka, J. Chromatogr. A, 1996, 728, 139–147 CrossRef CAS.
- A. Viken, T. Skauge and K. Spildo, J. Appl. Polym. Sci., 2016, 133, 1097–4628 Search PubMed.
- F. Candau, S. Biggs, A. Hill and J. Selb, Prog. Org. Coat., 1994, 24, 11–19 CrossRef CAS.
- M. S. Kamal, A. S. Sultan, U. A. Almubaiyedh and I. A. Hussein, Polym. Rev., 2015, 21, 1–40 Search PubMed.
- P. Liu, Q. Chen, S. Wu, J. Shen and S. Lin, J. Membr. Sci., 2010, 350, 387–394 CrossRef CAS.
- G. S. George, E. B. Kamenska, E. D. Vassileva, I. P. Kamenova and V. T. Georgieva, Biomacromolecules, 2006, 7, 1329–1334 CrossRef PubMed.
- S. Kanagalingam, C. F. Ngan and J. Duhamel, Macromolecules, 2002, 35, 8560–8570 CrossRef CAS.
- L. Zheng, S. S. Harihara, Z. Wei, C. Li and Z. Yuan, React. Funct. Polym., 2017, 118, 51–61 CrossRef CAS.
- J. Mao, H. Tan, B. Yang, W. Zhang, X. Yang, Y. Zhang and H. Zhang, Polymers, 2018, 10, 2073–4360 Search PubMed.
- M. T. Ghannam, J. Appl. Polym. Sci., 2009, 112, 867–875 CrossRef CAS.
Footnote |
| † Electronic supplementary information (ESI) available. See DOI: 10.1039/d0nj01687j |
| This journal is © The Royal Society of Chemistry and the Centre National de la Recherche Scientifique 2020 |

