 Open Access Article
Three-dimensional paper-based microfluidic electrochemical integrated devices (3D-PMED) for wearable electrochemical glucose detection†
Qingpeng Cao a,
Bo Liang*a,
Tingting Tua,
Jinwei Weia,
Lu Fangb and
Xuesong Ye
 *a
*a
aBiosensor National Special Laboratory, Key Laboratory of Biomedical Engineering of Ministry of Education, College of Biomedical Engineering and Instrument Science, Innovation Center for Minimally Invasive Technique and Device, Zhejiang University, Hangzhou 310027, P. R. China. E-mail: yexuesong@zju.edu.cn; boliang1986@zju.edu.cn; Fax: +86 571 87951676; Tel: +86 571 87952756
bCollege of Life Information Science and Instrument Engineering, Hangzhou Dianzi University, Hangzhou 310018, P. R. China
First published on 14th February 2019
Abstract
Wearable electrochemical sensors have attracted tremendous attention in recent years. Here, a three-dimensional paper-based microfluidic electrochemical integrated device (3D-PMED) was demonstrated for real-time monitoring of sweat metabolites. The 3D-PMED was fabricated by wax screen-printing patterns on cellulose paper and then folding the pre-patterned paper four times to form five stacked layers: the sweat collector, vertical channel, transverse channel, electrode layer and sweat evaporator. A sweat monitoring device was realized by integrating a screen-printed glucose sensor on polyethylene terephthalate (PET) substrate with the fabricated 3D-PMED. The sweat flow process in 3D-PMED was modelled with red ink to demonstrate the capability of collecting, analyzing and evaporating sweat, due to the capillary action of filter paper and hydrophobicity of wax. The glucose sensor was designed with a high sensitivity (35.7 μA mM−1 cm−2) and low detection limit (5 μM), considering the low concentration of glucose in sweat. An on-body experiment was carried out to validate the practicability of the three-dimensional sweat monitoring device. Such a 3D-PMED can be readily expanded for the simultaneous monitoring of alternative sweat electrolytes and metabolites.
Introduction
Wearable sensors have attracted tremendous attention owing to their potential applications in personalized medicine through real-time continuous monitoring of an individual's health situation.1–4 Many wearable devices for physical and electrophysiological parameter measurement such as heart rate, blood oxygenation and electrocardiograms are commercially available.2,5 However, wearable chemical sensors are not so widely developed like physical ones due to their complicated operation principles and fabrication structures.6,7 Nevertheless, several research groups have recently developed wearable electrochemical devices that can measure biochemical analytes in sweat.8,9 Recently, epidermal sweat sensors for lactate,10 glucose11 and pH12 analysis in sweat have been demonstrated by J. Wang's group. They also constructed a skin-worn hybrid sensing device that offers simultaneous monitoring of lactate and electrocardiogram.13 These sensor patches were fabricated by screen-printing technology on temporary tattoo papers or flexible polyesters. Gao et al. proposed an integrated wearable sensor array fabricated on flexible polyethylene terephthalate (PET) substrate by photolithography and electron-beam deposition methods.14 The integrated wearable patch can simultaneously monitor metabolites and electrolytes in human sweat. Measurements of Ca2+ concentration and pH in body fluids has also been achieved by fabricating ion-selective electrodes on PET substrate.15However, previous studies mainly focused on flexible and stretchable property of epidermal devices.16,17 And less attention has been paid on fluid flow of sweat under the patch, which is important for real-time continuous analysis of sweat and long-term comfortability of skin-worn. Additionally, sweat accumulation under sensors will cause skin discomfort.18 To date, paper-based devices have been proposed for sweat metabolites monitoring, due to flexibility, foldability and rollability, low cost, and ease of use that are the intrinsic characteristics of paper-based devices.19–21 Beyond that, the capillary effect of paper helps the sweat flow in the paper-based devices, contributing to the sweat collection.22
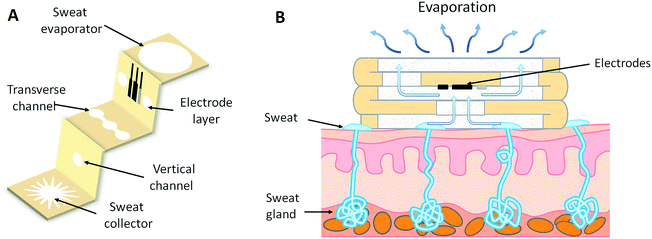
In this work, we developed a three-dimensional paper-based microfluidic electrochemical integrated device (3D-PMED) by simply folding a pre-patterned cellulose paper (Fig. 1). The patterned paper was fabricated by modified wax screen-printing. The 3D-PMED includes five layers: sweat collector, vertical channel, transverse channel, electrode layer and sweat evaporator (Fig. 1A). In addition, the electrodes fabricated by screen-printed, was attached onto the electrode layer of the 3D-PMED for measuring the analytes in sweat (Fig. 1A). Therefore, the folded patterned paper formed a 3D flow channel (Fig. 1B). Sweat on skin was absorbed by the collector and flow into the vertical channel with the help of capillary driving. Continuous sweat flow was driven by evaporation of sweat on the sweat evaporator, keeping fresh liquid flow across the electrodes and avoiding sweat accumulation in the device. The 3D-PMED could also separate the electrodes from the skin, to prevent direct mechanical contact between the sensor and skin. As a demonstration, we also fabricated a glucose sensor for monitoring the glucose in sweat based on the 3D-PMED. The resulting glucose sensor was evaluated extensively for its sensitivity, selectivity, and repeatability. Additionally, the sweat flow processes in 3D-PMED has been modelled with red ink to confirm the continuous flow of sweat in this device. Finally, 3D-PMED was applied to monitoring the glucose in sweat on the skin of subjects, who were asked to endure sustained physical exercise (cycling), in order to validate the practicability of the 3D-PMED. The corresponding sweat glucose temporal profiles were recorded via amperometric method.
Materials and methods
Chemicals
Glucose oxidase (GOx) from Aspergillus niger, L-lactate acid, ascorbic acid were obtained from Aladdin Ltd. 0.01 M phosphate-buffered saline (PBS) was purchased from Sangon Biotech (Shanghai) Co., Ltd. Glucose, chitosan, acetic acid, sodium chloride were obtained from Shanghai Hushi Laboratorial Equipment Co., Ltd. Nafion® 117 was obtained from Sigma-Aldrich. Silver/silver chloride ink was obtained from Yingman Nanotech Ltd. (Jiangsu, China). While Prussian blue/graphite ink (C2070424P2) was obtained from Gwent Inc. (Torfaen, UK). All reagents were used without further purification. Insulator ink was purchased from Jujo Chemical Co., Ltd. (Tokyo Japan).Device fabrication
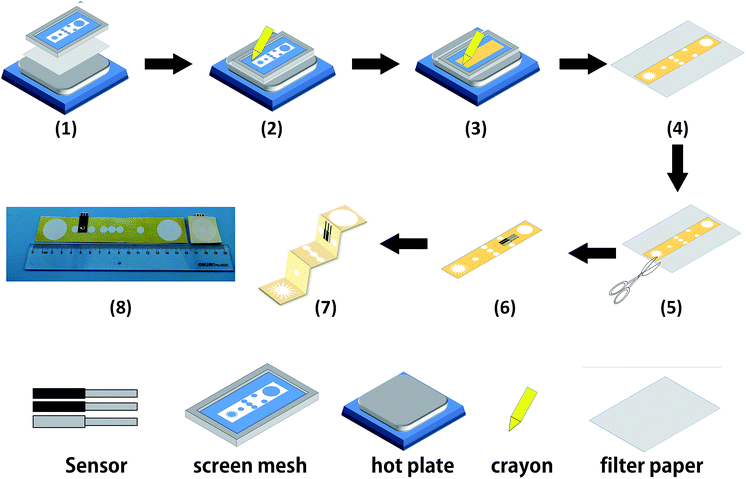
The cellulose paper was patterned by modified wax screen-printing, as shown schematically in Fig. 2.23 The 3D-PMED patterns were designed by CorelDRAW and outsourced for fabrication on screen mesh. The shape of the patterns was shown in the white areas on the screen, which allowed the wax through the mesh to form hydrophobic areas. Firstly, the filter paper was pasted on the back of the screen mesh (100 mesh nylon) to prevent the paper from sliding relative to the mesh. Both the filter paper and screen mesh were placed on a hot plate when the screen mesh was rubbed by a crayon (Fig. 2). The wax could penetrate into the paper easily under heating, which would form well-defined hydrophobic barriers on the paper. The appropriate temperature was set to be 50–55 °C. The wax, under the lower temperature, cannot penetrate through the filter paper. And the higher temperature would cause more lateral cross-flow of wax, resulting in the fuzzy of the patterns.24 After printing, distinct wax area was formed on the filter paper. And the whole process took about 4 minutes. Subsequently, the patterned filter paper was cut into rectangle shape (3 cm × 15 cm) according to the edge of the patterns and then folded into an origami structure with five equal parts (3 cm × 3 cm), including sweat collector, vertical channel, transverse channel, electrode layer and sweat evaporator. As with the 3D-PMED, the electrode patterns were designed by CorelDRAW and outsourced for fabrication on screen mesh (300 mesh nylon). The fabrication process of electrodes is similar to previous work with slight changes.25 It first involved screen-printing silver/silver chloride ink, followed by the Prussian blue/graphite ink, and finally the blue insulator layer. After each printing, the printed ink was cured at 90 °C for 15 min. Subsequently, the electrodes were pasted onto the electrode layer of the 3D-MEPD (Fig. 2 (6)). The working electrode had a round shape with a 2.5 mm diameter. And the reference and counter electrodes had part circle shapes with area of 2 mm2 and 19.4 mm2 respectively.Electrode modification
Glucose sensors were modified as follows.14,26 2 μL of Nafion (Nafion![[thin space (1/6-em)]](https://www.rsc.org/images/entities/char_2009.gif) :
:![[thin space (1/6-em)]](https://www.rsc.org/images/entities/char_2009.gif) ethanol = 1
ethanol = 1![[thin space (1/6-em)]](https://www.rsc.org/images/entities/char_2009.gif) :
:![[thin space (1/6-em)]](https://www.rsc.org/images/entities/char_2009.gif) 10) were drop-casted on the working electrode surface and followed to dry for 30 min. Nafion layer is critical to remove interferents present in sweat.27 Next, three μL of 5% chitosan solution in 3% acetic acid was cast and the electrode was left overnight at 4 °C. Following, we dropped 2 μL of GOx (10 mg mL−1) on the working electrode surface to dry for two hours and dropped 3 μL of 5% chitosan solution in 3% acetic acid. Finally, 2 μL of Nafion (Nafion
10) were drop-casted on the working electrode surface and followed to dry for 30 min. Nafion layer is critical to remove interferents present in sweat.27 Next, three μL of 5% chitosan solution in 3% acetic acid was cast and the electrode was left overnight at 4 °C. Following, we dropped 2 μL of GOx (10 mg mL−1) on the working electrode surface to dry for two hours and dropped 3 μL of 5% chitosan solution in 3% acetic acid. Finally, 2 μL of Nafion (Nafion![[thin space (1/6-em)]](https://www.rsc.org/images/entities/char_2009.gif) :
:![[thin space (1/6-em)]](https://www.rsc.org/images/entities/char_2009.gif) ethanol = 1
ethanol = 1![[thin space (1/6-em)]](https://www.rsc.org/images/entities/char_2009.gif) :
:![[thin space (1/6-em)]](https://www.rsc.org/images/entities/char_2009.gif) 10) were drop-casted on the working electrode surface to dry and stored at 4 °C for standby.
10) were drop-casted on the working electrode surface to dry and stored at 4 °C for standby.
Electrochemical assays
All electrochemical experiments were performed in an electrochemical workstation (μAutolab III, Metrohm, Switzerland). We used a three-electrode system for the amperometric sensors; the working and counter electrodes were printed using Prussian blue/graphite ink, and the reference was the printed Ag/AgCl electrode. In experiments, all solutions for the in vitro amperometric measurements were prepared in 0.01 M PBS (Sangon Biotech, Shanghai, China). Amperometric detection of hydrogen peroxide with Prussian Blue (PB) modified electrodes is the most effective catalyst for hydrogen peroxide electroreduction known.28 Moreover, the peculiar cubic geometry of the PB molecules seems to be the cause for an effective electrochemical selectivity. In fact, molecules with a molecular weight higher than H2O2, such as ascorbic acid and uric acid, cannot penetrate the PB lattice, and give a catalytic redox reaction. These two promising advantages have been used to obtain a sensitive and interference free probe for H2O2 detection.29 The large anodic overpotential of H2O2 at conventional printed electrodes could simultaneously give rise to electrocatalytic oxidation of the interferents, like uric acid and ascorbic acid in the sweat. Therefore, the printed biosensor was modified with Prussian blue, resulting in a decrease of the applied potential and the consequent avoidance of many electrochemical interferences.30 Here, the amperometric detection was performed using an applied potential of −0.1 V (versus an Ag/AgCl reference) in order to obtain the calibration curves and the on-body measurements.26,28,30,31Results
Characterization of the glucose sensor
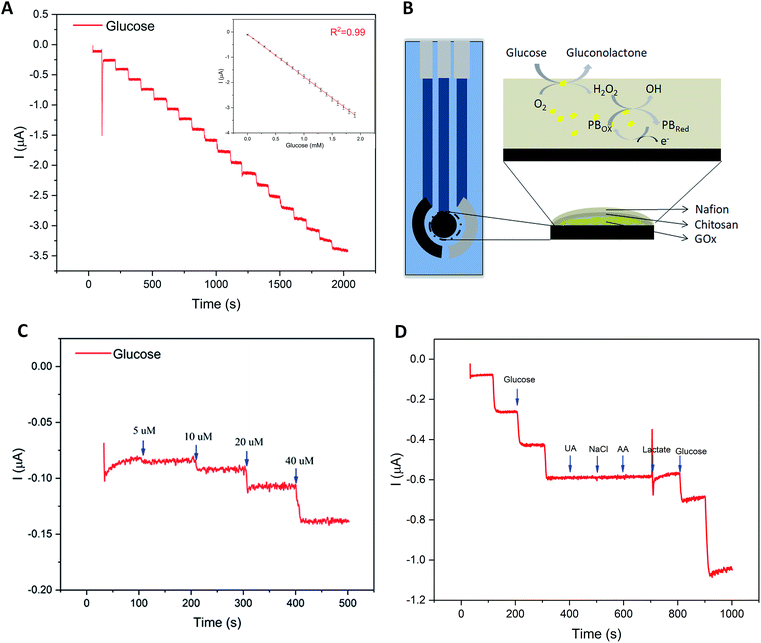
Glucose concentration in sweat, though much lower than that in blood, is widely recognized as an effective indicator to reveal the human blood glucose level.32–35 However, the fact of ultralow concentration (range: 0.25–1.5 mM) also makes it difficult to develop a practical sweat glucose sensor.35 In the study, several key analytical parameters must be evaluated in advance to achieve a high-performance sweat glucose sensor, such as sensitivity, linearity, and repeatability.36 Accordingly, the glucose sensor should offer a fast response time, selective and reproducible response, high sensitivity, and low detection limit. The glucose oxidase (GOx) was the core part of the glucose sensor, a widely used analytical enzyme, to improve the selectivity of glucose sensor (Fig. 3B). GOx catalyzes the oxidation of glucose to gluconolactone and generates hydrogen peroxide (H2O2) simultaneously, while H2O2 was electrochemically reduced directly on the surface of the Prussian Blue (PB) (Fig. 3B). Prussian blue is an efficient redox mediator for selective detection of hydrogen peroxide in the presence of oxygen and other interferents, due to the peculiar geometry of the PB molecules and very low catalytic potential at −0.1 V (versus Ag/AgCl reference).37–39Fig. 3A displays the amperometric response of the glucose sensor, with the addition of 10 μL 1 M glucose drops (concentrations: 0–1.9 mM, step: 0.1 mM) in a beaker filled with 10 mL 0.01 M PBS. During the process of measurement, the system was kept at room temperature with a magnetic stirrer. As shown in Fig. 3A, the results displayed a good linearity for glucose concentrations of 0–1.9 mM with a correlation coefficient of 0.99 that covered the range of glucose physiological concentrations in human sweat (range: 0.25–1.5 mM).36,40 And the sensitivity of glucose sensor reached up to 35.7 μA mM−1 cm−2 (the electrode area of 4.906 mm2) with a rapid response. The detection limit of the glucose sensor was also evaluated. The amperometric current response was shown in Fig. 3C with successive addition of 5 μM, 10 μM, 20 μM, 40 μM. Based on our computation, the limit of detection was low to 5 μM. The influence of interferents coexisting in human perspiration (2 μM UA, 0.1 mM NaCl, 2 μM AA, and 5 mM lactate) on the sensor response were investigated. Fig. 3D displayed the test results, which did not present any significant interference signals comparing to the glucose droplets. The fluctuation of the curve due to the addition of the high volume lactate was acceptable to our research. The glucose sensor inter-electrode reproducibility was evaluated. The standard deviations from five samples were not more than 10% (Table S1, ESI†). Such reproducibility is satisfactory considering the low cost electrode fabrication route. Therefore, the modified glucose sensor showed good performance.
The modelling of fluid flow in 3D-PMED
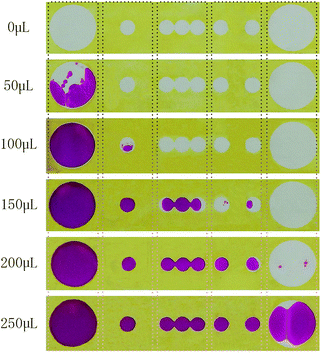
The fluid flow of sweat in 3D-PMED was modelled by dropping red ink onto the 3D-PMED and recording its real-time flow process. A 3D-PMED was sandwiched between two plastic plates, both of which had a hole for the entrance and export of ink. The sweat collector and sweat evaporator of 3D-PMED were aligned to the holes of the plates that were clamped with two clips. Successive addition of red ink (volume: 50 μL, 100 μL, 150 μL, 200 μL, 250 μL) was performed onto the surface of sweat collector of 3D-PMED. The photograph of modelling process shown in Fig. S1,† illustrated the whole manufacture. Due to the effect of capillary of filter paper, the flowing of ink finished in a second. After that, 3D-PMED was unfolded as shown in Fig. 4. The results displayed that the red ink followed the channels of 3D-PMED from the collector to evaporator. The desired hydrophobic barriers were successfully generated by our modified wax screen-printing strategy. Therefore, clear boundary formed between the hydrophobic barriers and the hydrophilic channels. As shown in Fig. 4, the first drop of red ink (50 μL) just stayed onto the sweat collector, though covering large area of sweat collector. The sweat collector was aimed at covering more sweat pores to collect as much perspiration as possible. Along with increasing of the drops, the ink permeated through the vertical channel onto the next layer. Finally, the red ink almost filled the whole chambers.According to the above modelling of ink flowing in 3D-PMED, it was verified that the 3D-PMED had the capacity of draining the sweat on human skin, when applied on monitoring of human perspiration. With such prominent characteristics, the 3D-PMED could be a promising solution for sweat accumulation under sensors.
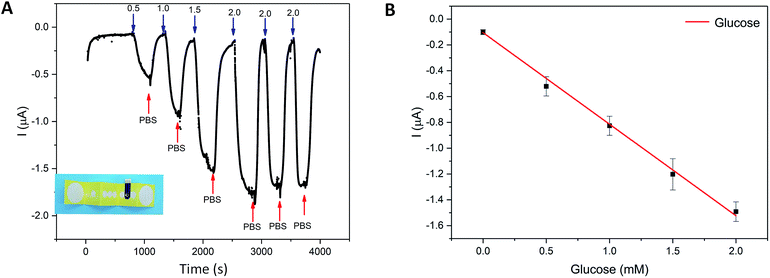
The glucose sensing experiments in 3D-PMED
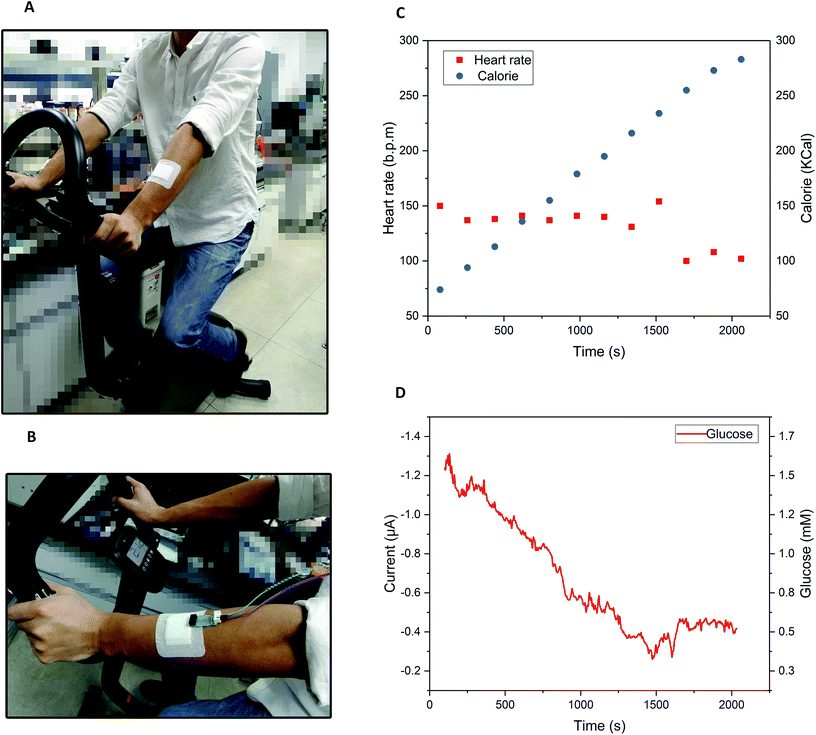
The integration of the glucose sensor with the 3D-PMED was evaluated by measurement of glucose and real-time monitoring sweat glucose on human skin. As described above, the 3D-PMED was sandwiched between two plastic plates with the integration of the modified glucose sensor. The glucose sensor was connected to the electrochemical workstation. Fig. 5 displayed amperometric current response at −0.1 V (vs. Ag/AgCl reference electrode) with alternant injecting of glucose (successive addition of 0.5 mM, 1.0 mM, 1.5 mM, 2.0 mM glucose) and PBS. Considering the slow evaporation of fluid, a block filter paper was placed onto the sweat evaporator to increase the flowing of fluid. The interval between each dropping was set to be 500s to refresh the fluid sufficiently. Due to the slow permeation of fluid, the curves were not flat after 500s interval (Fig. 5A). Fig. 5B showed the linear calibration plot with the sensitivity up to 17.49 μA mM−1 cm−2. The results displayed a good repeatability and linearity in concentration ranging from 0–1.9 mM. However, the sensitivity of the glucose sensor in 3D-PMED decreased due to the difference between the beaker system and 3D-PMED. And the possible reason was that the unstirred system in 3D-PMED was relatively static to the stirred one in a beaker. In a 3D-PMED system, the non-faradaic current was merely derived from mass transport by diffusion, whereas in the stirred beaker system the non-faradaic current arises from both diffusion and convection. So the current response in the 3D-PMED was lower than that in the stirred beaker. The reproducibility of the glucose sensor in 3D-PMED was evaluated, as shown in Table S2.† The standard deviation was acceptable among 0.02–0.12. Though, the performance of the sensor in 3D-PMED was acceptable to monitor the glucose in sweat.Then, the 3D-PMED and glucose sensor were integrated as a practical sweat monitoring device that was evaluated on human skin (Fig. 6). In order to aid the 3D-PMED device folding and prevent delamination of the device from the skin, a ventilate band (60 mm × 80 mm) was put onto the device back on the forearm of subject (Fig. 6A and B). All subjects signed a consent form after being informed that the acquired data would be used for research purposes only. The experiments were approved by the Zhejiang University Ethical Committee. The simultaneous on-body measurement of glucose in sweat was performed using the electrochemical workstation during physical activity on a cycle ergometer. The protocol involved a 10 min warming up, 25 min cycling at constant power and 10 min break. Before exercise, the subjects were asked to drink 200 mL honey water (honey![[thin space (1/6-em)]](https://www.rsc.org/images/entities/char_2009.gif) :
:![[thin space (1/6-em)]](https://www.rsc.org/images/entities/char_2009.gif) water = 1
water = 1![[thin space (1/6-em)]](https://www.rsc.org/images/entities/char_2009.gif) :
:![[thin space (1/6-em)]](https://www.rsc.org/images/entities/char_2009.gif) 19, volume ratio) to raise the blood glucose. After digesting for 10 min, the subjects started warming up. The measurement began at the end of warming up, aiming at the sufficient sweat the subjects had perspired. Meanwhile, the real-time heart rate and the calorie the subjects consumed were recorded by the multifunctional cycle ergometer. After warm-up, the heart rate had risen, and then stayed close to this value during the whole cycling (Fig. 6C). The calorie consumed by subjects kept rising linearly, which indicated the constant intensity of exercise (Fig. 6C). On account of the blood glucose consumption during exercise, the glucose in sweat decreased gradually till the end of cycling, with fluctuation range from 1.5 mM to 0.4 mM (Fig. 6D). During the break, the heart rate recovered to 100 BPM, and the glucose level also went up a bit and levelled off for the regulation of blood glucose (Fig. 6D). All data was shown in Fig. S2 in ESI.† Due to the differences in blood glucose level and metabolism between individuals, the current curve and heart rate during the process of cycling showed the variances. The results showed the glucose concentration in sweat changed dynamically with the exercises. Ignoring the differences among three subjects, the concentration change of glucose in sweat could clearly indicate the level of exercise through the whole process. That also indicated that the 3D-PMED exhibited a good performance and could be readily used for on-body measurement.
19, volume ratio) to raise the blood glucose. After digesting for 10 min, the subjects started warming up. The measurement began at the end of warming up, aiming at the sufficient sweat the subjects had perspired. Meanwhile, the real-time heart rate and the calorie the subjects consumed were recorded by the multifunctional cycle ergometer. After warm-up, the heart rate had risen, and then stayed close to this value during the whole cycling (Fig. 6C). The calorie consumed by subjects kept rising linearly, which indicated the constant intensity of exercise (Fig. 6C). On account of the blood glucose consumption during exercise, the glucose in sweat decreased gradually till the end of cycling, with fluctuation range from 1.5 mM to 0.4 mM (Fig. 6D). During the break, the heart rate recovered to 100 BPM, and the glucose level also went up a bit and levelled off for the regulation of blood glucose (Fig. 6D). All data was shown in Fig. S2 in ESI.† Due to the differences in blood glucose level and metabolism between individuals, the current curve and heart rate during the process of cycling showed the variances. The results showed the glucose concentration in sweat changed dynamically with the exercises. Ignoring the differences among three subjects, the concentration change of glucose in sweat could clearly indicate the level of exercise through the whole process. That also indicated that the 3D-PMED exhibited a good performance and could be readily used for on-body measurement.
Conclusions
A three-dimensional paper-based microfluidic electrochemical integrated device was firstly proposed here for constructing wearable sweat monitoring devices. 3D-PMED is fabricated to form a 3D-flow channel by folding a patterned filter paper. It includes five layers: sweat collector, vertical channel, transverse channel, electrode layer and sweat evaporator. Sweat on skin was absorbed by the collector and flow into the vertical channel with the help of capillary driving. Such a device structure is designed for sweat collection, sweat circulation, and sensor isolation in sweat monitoring. And this three-dimensional structure of the wearable paper-based microfluidic devices could effectively control the flow of the sweat, which perfectly solved the problem of the sweat accumulation under the device. Additionally, the 3D-PMED has been integrated with a screen-printing glucose sensor for detecting glucose in sweat. In conclusion, the 3D-PMED has been shown to be a practical device in monitoring the glucose in human sweat. It has the characteristics of simplicity, low cost, and ease-of-use. Also, some challenges remained to be solved, such as the stability of sensor and the channel size of the device. In the future, we will downsize the device to improve the comfort of wearing and integrate with lactate sensor, pH electrodes, and sodium sensor. Meanwhile, a flexible printed circuit board should be developed for wireless monitoring.Conflicts of interest
There are no conflicts to declare.Acknowledgements
This work was financially supported by the National Natural Science Foundation of China (61501400, 81501555), National Key R&D Program of China (No. 2017YFF0210803), Natural Science Foundation of Zhejiang Province (LY18H180006), China Postdoctoral Science Foundation (2015M571879), Special Foundation of China Postdoctoral Science (2016T90541).References
- Y. Khan, A. E. Ostfeld, C. M. Lochner, A. Pierre and A. C. Arias, Adv. Mater., 2016, 28, 4373–4395 CrossRef CAS PubMed
.
- T. Tran Quang and N.-E. Lee, Adv. Mater., 2016, 28, 4338–4372 CrossRef PubMed
.
- D.-H. Kim, N. Lu, R. Ma, Y.-S. Kim, R.-H. Kim, S. Wang, J. Wu, S. M. Won, H. Tao, A. Islam, K. J. Yu, T.-i. Kim, R. Chowdhury, M. Ying, L. Xu, M. Li, H.-J. Chung, H. Keum, M. McCormick, P. Liu, Y.-W. Zhang, F. G. Omenetto, Y. Huang, T. Coleman and J. A. Rogers, Science, 2011, 333, 838–843 CrossRef CAS PubMed
.
- M. Bariya, H. Y. Y. Nyein and A. Javey, Nature Electronics, 2018, 1, 160–171 CrossRef
.
- S. C. Mukhopadhyay, IEEE Sens. J., 2015, 15, 1321–1330 Search PubMed
.
- A. J. Bandodkar, I. Jeerapan and J. Wang, ACS Sens., 2016, 1, 464–482 CrossRef CAS
.
- J. Heikenfeld, A. Jajack, J. Rogers, P. Gutruf, L. Tian, T. Pan, R. Li, M. Khine, J. Kim, J. Wang and J. Kim, Lab Chip, 2018, 18, 217–248 RSC
.
- A. J. Bandodkar, W. Jia and J. Wang, Electroanalysis, 2015, 27, 562–572 CrossRef CAS
.
- J. R. Windmiller and J. Wang, Electroanalysis, 2013, 25, 29–46 CrossRef CAS
.
- W. Jia, A. J. Bandodkar, G. Valdes-Ramirez, J. R. Windmiller, Z. Yang, J. Ramirez, G. Chan and J. Wang, Anal. Chem., 2013, 85, 6553–6560 CrossRef CAS PubMed
.
- A. J. Bandodkar, W. Jia, C. Yardimci, X. Wang, J. Ramirez and J. Wang, Anal. Chem., 2015, 87, 394–398 CrossRef CAS PubMed
.
- A. J. Bandodkar, V. W. Hung, W. Jia, G. Valdés-Ramírez, J. R. Windmiller, A. G. Martinez, J. Ramírez, G. Chan, K. Kerman and J. Wang, Analyst, 2013, 138, 123–128 RSC
.
- A. J. Bandodkar, J.-M. You, N.-H. Kim, Y. Gu, R. Kumar, A. M. V. Mohan, J. Kurniawan, S. Imani, T. Nakagawa, B. Parish, M. Parthasarathy, P. P. Mercier, S. Xu and J. Wang, Energy Environ. Sci., 2017, 10, 1581–1589 RSC
.
- W. Gao, S. Emaminejad, H. Y. Y. Nyein, S. Challa, K. Chen, A. Peck, H. M. Fahad, H. Ota, H. Shiraki and D. Kiriya, Nature, 2016, 529, 509–514 CrossRef CAS PubMed
.
- H. Y. Y. Nyein, W. Gao, Z. Shahpar, S. Emaminejad, S. Challa, K. Chen, H. M. Fahad, L.-C. Tai, H. Ota and R. W. Davis, ACS Nano, 2016, 10, 7216–7224 CrossRef CAS PubMed
.
- X. Huang, Y. Liu, K. Chen, W. J. Shin, C. J. Lu, G. W. Kong, D. Patnaik, S. H. Lee, J. F. Cortes and J. A. Rogers, Small, 2014, 10, 3083–3090 CrossRef CAS PubMed
.
- A. J. Bandodkar, R. Nunez-Flores, W. Jia and J. Wang, Adv. Mater., 2015, 27, 3060–3065 CrossRef CAS PubMed
.
- K. Reynolds, A. Darrigrand, D. Roberts, J. Knapik, J. Pollard, K. Duplantis and B. Jones, J. Am. Acad. Dermatol., 1995, 33, 626–630 CrossRef CAS PubMed
.
- A. Economou, C. Kokkinos and M. Prodromidis, Lab Chip, 2018, 18, 1812–1830 RSC
.
- Z. H. Nie, F. Deiss, X. Y. Liu, O. Akbulut and G. M. Whitesides, Lab Chip, 2010, 10, 3163–3169 RSC
.
- R. Liu, C. Zhang and M. Liu, Sens. Actuators, B, 2015, 216, 255–262 CrossRef CAS
.
- Z. H. Nie, C. A. Nijhuis, J. L. Gong, X. Chen, A. Kumachev, A. W. Martinez, M. Narovlyansky and G. M. Whitesides, Lab Chip, 2010, 10, 477–483 RSC
.
- W. Guan, M. Liu and C. Zhang, Biosens. Bioelectron., 2016, 75, 247–253 CrossRef CAS PubMed
.
- Y. Yao and C. Zhang, Biomed. Microdevices, 2016, 18, 92 CrossRef PubMed
.
- Y. Yao and C. Zhang, Sensors, 2016, 16, 1231 CrossRef PubMed
.
- J. R. Sempionatto, T. Nakagawa, A. Pavinatto, S. T. Mensah, S. Imani, P. Mercier and J. Wang, Lab Chip, 2017, 17, 1834–1842 RSC
.
- D. Baba, A. S. Nugraha, M. Iqbal, J. Bo, C. Li, A. A. Alshehri, J. You, V. Malgras, Y. Yamachi and T. Asahi, RSC Adv., 2018, 8, 10446–10449 RSC
.
- N. A. Sitnikova, A. V. Mokrushina and A. A. Karyakin, Electrochim. Acta, 2014, 122, 173–179 CrossRef CAS
.
- F. Ricci, A. Amine, C. S. Tuta, A. A. Ciucu, F. Lucarelli, G. Palleschi and D. Moscone, Anal. Chim. Acta, 2003, 485, 111–120 CrossRef CAS
.
- F. Ricci and G. Palleschi, Biosens. Bioelectron., 2005, 21, 389–407 CrossRef CAS PubMed
.
- A. A. Karyakin, E. E. Karyakina and L. Gorton, Talanta, 1996, 43, 1597–1606 CrossRef CAS
.
- A. Abellan-Llobregat, I. Jeerapan, A. Bandodkar, L. Vidal, A. Canals, J. Wang and E. Morallon, Biosens. Bioelectron., 2017, 91, 885–891 CrossRef CAS PubMed
.
- J. Moyer, D. Wilson, I. Finkelshtein, B. Wong and R. Potts, Diabetes Technol. Ther., 2012, 14, 398–402 CrossRef CAS PubMed
.
- K. Sakaguchi, Y. Hirota, N. Hashimoto, W. Ogawa, T. Hamaguchi, T. Matsuo, J.-i. Miyagawa, M. Namba, T. Sato, S. Okada, K. Tomita, M. Matsuhisa, H. Kaneto, K. Kosugi, H. Maegawa, H. Nakajima and A. Kashiwagi, J. Diabetes Sci. Technol., 2013, 7, 678–688 CrossRef PubMed
.
- H. Lee, C. Song, Y. S. Hong, M. S. Kim, H. R. Cho, T. Kang, K. Shin, S. H. Choi, T. Hyeon and D.-H. Kim, Sci. Adv., 2017, 3, e1601314 CrossRef PubMed
.
- H. Yao, A. J. Shum, M. Cowan, I. Laehdesmaeki and B. A. Parviz, Biosens. Bioelectron., 2011, 26, 3290–3296 CrossRef CAS PubMed
.
- F. Ricci, A. Amine, G. Palleschi and D. Moscone, Biosens. Bioelectron., 2003, 18, 165–174 CrossRef CAS PubMed
.
- J. Adkins, K. Boehle and C. Henry, Electrophoresis, 2015, 36, 1811–1824 CrossRef CAS PubMed
.
- M. P. O'Halloran, M. Pravda and G. G. Guilbault, Talanta, 2001, 55, 605–611 CrossRef
.
- X. Xuan, H. S. Yoon and J. Y. Park, Biosens. Bioelectron., 2018, 109, 75–82 CrossRef CAS PubMed
.
Footnote |
| † Electronic supplementary information (ESI) available. See DOI: 10.1039/c8ra09157a |
| This journal is © The Royal Society of Chemistry 2019 |

