 Open Access Article
Multiscale atomistic simulation of metal nanoparticles under working conditions
Jifeng
Du
ab,
Jun
Meng
ab,
Xiao-Yan
Li
ab,
Beien
Zhu
ac and
Yi
Gao
 *ac
*ac
aDivision of Interfacial Water and Key Laboratory of Interfacial Physics and Technology Shanghai Institute of Applied Physics, Chinese Academy of Sciences, Shanghai, 201800, China. E-mail: gaoyi@sinap.ac.cn
bUniversity of Chinese Academy of Sciences, Beijing, 100049, China
cZhangjiang Laboratory, Shanghai Advanced Research Institute, Chinese Academy of Sciences, Shanghai, 201210, China
First published on 11th June 2019
Abstract
With the fast development of in situ experimental methodologies, dramatic structure reconstructions of nanomaterials that only occur under reaction conditions have been discovered in recent years, which are critical for their application in catalysis, biomedicine, and biosensors. A big challenge for theoreticians is thus to establish reliable models to reproduce the experimental observations quantitatively, and further to make predictions beyond experimental conditions. Herein, we briefly summarize the recent theoretical advances involving the quantitative predictions of equilibrium shapes of metal nanoparticles under reaction conditions and the real-time simulations of nanocrystal transformations. The comparisons between the theoretical and experimental results are presented. This minireview not only helps researchers understand the in situ observations at the atomic level, but also is beneficial for prescreening and optimizing the NPs for practical use.
1 Introduction
Metal nanoparticles (NPs) play crucial roles in heterogeneous catalysis due to their unique physical and chemical properties.1–3 The structure of a NP is one of the major factors determining its functionality. NPs may undergo structural evolution when exposed to reactive environments.4–6 In the past decade, a number of in situ experiments have shown that the structures of NPs under reaction conditions could be completely different from those under vacuum, which leads to different catalytic properties.7–17 On the other hand, many NPs with unique nanostructures, such as hollow nanocages, nanodendrites, nanorods, nanowires, etc.,18–22 have been synthesized to facilitate catalytic reactions. However, these novel synthesized nanostructures are metastable and tend to lose their unique structures after long-time operation under real working conditions. Therefore, investigation of whether metastable nanostructures can last long enough and retain their pre-defined structures and functionality under working conditions is urgently needed. However, it is still challenging to perform in situ studies on catalytic systems in all aspects due to the high-cost instrumental setup, limited time-resolution and time scale, and complex reaction conditions.23–26 To understand and even to predict how heterogeneous catalysts change their sizes and shapes with time during chemical reactions becomes an urgent task for theoreticians.In recent years, with the promotion of computational capacity, significant progress has been achieved in simulating large and complex catalytic systems at the atomic level.27–29 However, these theoretical studies are mostly focused on model systems with ideal structures30,31 and within very-limited size/time scales.32,33 To quantitatively simulate the equilibrium shape of NPs under reaction conditions and the nonequilibrium nanocrystal transformation, new theoretical methods are highly demanded.
In this review, we briefly summarize the recent theoretical developments in simulating equilibrium structures and the structural evolution of metal NPs under working conditions up to the long-time scale (∼hours) and on the nanosize scale (10 nm and above).34–39 In addition, their applications and the comparison to the state-of-the-art in situ environmental transmission electron microscope (ETEM) observations are also reviewed. The theoretical progress will be beneficial for understanding and predicting experimental observations of nanomaterials under real environments in the future.
2 Theoretical models
2.1 Equilibrium shapes of metal NPs under reaction conditions
According to the Wulff theory, the equilibrium shape of a NP is determined by the surface tension of each facet. When gas adsorption is involved, the surface tension γhkl should be revised.Barmparis et al. defined the interfacial tension γinthkl as below (eqn (1)) to study the shape of Au NPs with the adsorption of CO molecules40 and thiolate groups,41 respectively.
 | (1) |
In 2016, Zhu et al. proposed a Multiscale Structure Reconstruction (MSR) model based on the DFT, the Langmuir adsorption isotherm, and the Wulff construction.34 In this model, θ at a given temperature (T) and water vapour pressure (P) was quantitatively described by the Langmuir adsorption isotherm, which led to the precise prediction of shape evolution of metal NPs in water vapour environments.
After that, a more generalized approach was established by replacing the Langmuir adsorption isotherm with the Fowler–Guggenheim (F–G) adsorption isotherm, which included the lateral interaction between adsorbates.35,42 This developed model gave successful predictions in the following cooperative studies with experimental observations (more details will be discussed in the next section).
With further extension, the MSR model was also applied to predict the equilibrium shape of metal NPs in mixed gas environments. It showed that the partial pressure was also an important factor to determine the metal NPs' structures besides T and the total pressure of the mixed gas.36
The reactive environment not only affects the NPs but also interacts with the support surface. For supported NPs, the environmental effect can change the interface between the metal and the support, which is crucial in many reactions. To include the support effect, the Wulff–Kaischew theorem was adopted in the MSR model,37 and the contact-surface tension in environments (γEc-s) was calculated as follows:
 | (2) |
2.2 Real-time simulation of nanocrystal transformation
Kinetic Monte Carlo is a popular and powerful tool to describe a variety of dynamic phenomena involved in surface science. For instance, Barcaro et al. performed a KMC simulation of island nucleation to study the diffusion of Pd clusters on the MgO surface.43 The growth of Au NPs in solution and also the etching process of Au nanostructures could be well simulated by KMC.44,45 Besides, chemical reaction kinetics has been a good subject for KMC simulation.46 In recent years, a series of studies by Gao's group showed that KMC with a well-fitted nearest-bond model could describe the nonequilibrium structural transformation of both metals and alloys very well.In the “rejection-free” KMC simulation, for simulating the real-time evolution of a nanocrystal, the algorithm is written as follows:
1. Make a box containing Ntot lattice sites.
2. Choose the initial state S0 and set the time t = 0.
3. Sum over the rates (rtot) of all possible moves through which a selected atom diffuses to its empty nearest-neighbour (NN) lattice site using eqn (3).
4. Calculate the time of occurrence of transition from S0 to the new state (S1), ΔtS0→S1, based on rtot (eqn (4)).
5. Choose the atom i to move according to the proportion of rsite to rtot.
6. Choose the empty site j for the selected atom i to occupy according to the proportion of rij to rsite.
7. Calculate time t by the accumulation of ΔtS0→S1.
8. Update the initial state S0 with S1 and return to step 3.
The equations used in the KMC algorithm are listed below:
 | (3) |
 | (4) |
The calculation of rij at temperature T is carried out by using the following equation:
 | (5) |
 | (6) |
This equation satisfies the principle of microscopic reversibility by fitting with the Brönsted–Evans–Polanyi relationships and had achieved success in studying the atomic diffusion of Au.47 The Ef and Eb are the formation and bonding energies of the move. To evaluate Eb and Ef precisely and efficiently for KMC simulation, we consider moving a metal atom from site i to site j, and they are calculated as follows:
| Eb = CNiε | (7) |
| Ef = CNjε | (8) |
 | (9) |
3 Quantitative comparison with experiments
3.1 Structural evolution of metal NPs in reactive environments
To prove the reliability of the MSR model, it has been compared with in situ experiments quantitatively under different conditions.Cu/ZnO/Al2O3 catalysts are widely applied in the industrial production of methanol from synthesis gas mixtures (H2/CO2/CO). As early as in 2002, Hansen et al. applied ETEM to report the first experimental observation of reversible reshaping of Cu NPs on a ZnO substrate under water vapour.10 To reproduce this result, Zhu et al. employed the MSR model to simulate the equilibrium shapes of metal NPs in a water vapor environment.34 The calculated equilibrium shapes of Cu NPs under vacuum and in water vapour (∼425 K, 125 Pa) agreed with the experimental observations quantitatively, as shown in Fig. 1a.10,34 The simulations indicated that the stronger adsorption and higher coverage of water molecules on the Cu(110) surface reduced the surface energy of this surface more than that in Cu(100) and Cu(111) surfaces, which eventually induced the reshaping of Cu NPs with increased Cu(110) facet fraction under water vapor.
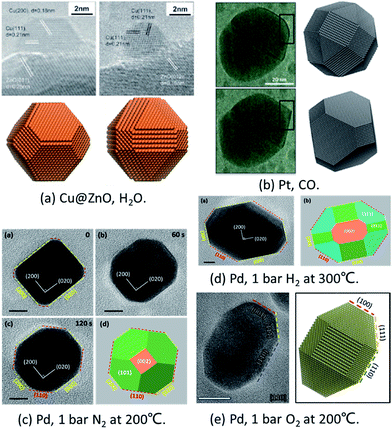 | ||
| Fig. 1 Comparison of in situ TEM images and theoretical predictions. (a) Shapes of Cu@ZnO with and without water vapour. Experiment results are adapted with permission from ref. 10. Copyright 2002 The American Association for the Advancement of Science. Theoretical results are adapted with permission from ref. 34. Copyright 2016 The American Chemical Society. (b) Pt NP morphology in oscillatory CO oxidation. Experiment results are adapted with permission from ref. 17. Copyright 2014 Nature Publishing Group. Theoretical results are adapted with permission from ref. 35. Copyright 2017 The American Chemical Society. (c) Pd NPs under 1 bar O2 at 200 °C. (d) Pd NPs under 1 bar H2 at 300 °C. The images in (c) and (d) are adapted with permission from ref. 48. Copyright 2017 The Royal Society of Chemistry. (e) Pd NPs under 1 bar N2 at 200 °C. Adapted with permission from ref. 49. Copyright 2018 The Royal Society of Chemistry. | ||
To explain the oscillation of Pt NPs under CO reported by Vendelbo et al.,17 Zhu et al.35 applied the Fowler–Guggenheim (F–G) adsorption isotherm to replace the Langmuir adsorption isotherm to take into account the strong interaction between CO molecules. When CO adsorbs on the (110) facet, the repulsion is weaker which allows more CO to adsorb. As a result, the higher CO coverage stabilizes the (110) facets. Thus, the simulated results clearly showed that the Pt NPs’ shape was faceted under lower CO pressure (<100 Pa) and was round under higher CO pressure (>100 Pa) with more open facets ((110) facet) (as shown in Fig. 1b), which was well consistent with the experiments.17
Recently, the reshaping of Pt NPs under O2, H2, and N2 up to ambient pressure was thoroughly investigated by the combination of ETEM experiments and the MSR model. The shape changes of Pd NPs from spherical to truncated cubes under 1 bar O2 and H2 were both observed experimentally and predicted theoretically (Fig. 1c and d).48 Later on, the unexpected refacetting process of Pd NPs under 1 bar N2 at elevated temperatures was predicted by the theoretical model and confirmed in experiments (Fig. 1e).49
In a very recent study, the in situ HAADF-STEM observation of change of Au NPs from an octahedron to round morphology during cooling under 105 Pa O2 was reported (Fig. 2a).50 The observed reshaping gives firm evidence that the Au NPs offer direct adsorption sites for the molecular oxygen under the conditions of atmospheric pressure and at room temperatures, which is crucial for understanding the CO oxidation mechanism on supported Au NPs under real conditions.
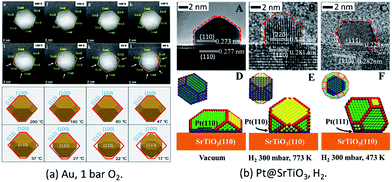 | ||
| Fig. 2 (a) Au NPs on r-TiO2(110) surfaces under O2 at atmospheric pressure. Adapted with permission from ref. 50. Copyright 2019 The American Chemical Society. (b) The morphology structure of Pt(110)/SrTiO3(110) (A, B, D, and E) and Pt(111)/SrTiO3(110) (C and F). Adapted with permission from ref. 37. Copyright 2018 Wiley-VCH Verlag GmbH & Co. KGaA, Weinheim. | ||
For supported metal NPs under reaction conditions, the simulation of the structure of Pt/SrTiO3(110) was successfully performed under similar conditions to those of the in situ ETEM experiments. Through theoretical modeling, the dynamic information of the changed perimeter interface in reactive environments was obtained quantitatively, which is currently difficult to obtain directly from experimental observations (Fig. 2b).37
3.2 Real-time simulations of nanocrystal transformations
As a reverse process of growth, the dissolution of Au NPs in a redox environment was monitored by Ye et al. using a liquid-cell transmission electron microscope (TEM).45 The observed short-lived nonequilibrium nanocrystals were then analyzed and rationalized in a KMC simulation. This work displayed the power of the combined approach of TEM and KMC in the studies of nonequilibrium nanocrystal transformations, as we can see from more examples below.
In the work of Tang et al., the transformation of a Pd@Pt alloy from a core–shell structure to a mixed alloy structure during a heating process was monitored by using in situ aberration-corrected scanning TEM. The initial core–shell NP had an ultrathin Pt shell with 4 atomic layers. The NP was heated with a sequence of annealing steps (300 °C, 400 °C, 500 °C, and 600 °C). It was observed that the transformation of the Pd@Pt NP went through two periods, as shown in Fig. 3a. The first one was a refacetting process in which it changed from a cubic structure to a truncated structure with diffusion of atoms from {110} facets to {100} facets, which exposed the Pd core in the {110} direction. There was no alloying during this process and the alloying only began at higher temperatures.
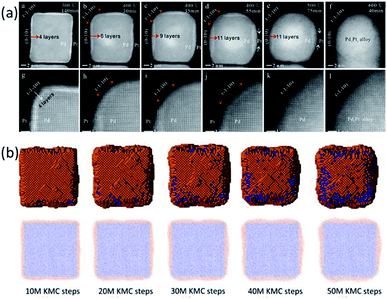 | ||
| Fig. 3 (a) TEM images of the Pd@Pt alloy at 300 °C, 400 °C, 500 °C, and 600 °C. (b) KMC simulation snapshots and cross-sections at 400 °C with different simulation steps. Adapted with permission from ref. 58. Copyright 2018 Elsevier Ltd. | ||
To interpret the experimental observations of Pd@Pt core–shell NPs, a KMC simulation at 400 °C was performed for a 9 nm Pd@Pt NP with a shell thickness of 4 Pt atomic layers.58 In this system, more than 45![[thin space (1/6-em)]](https://www.rsc.org/images/entities/char_2009.gif) 000 atoms were considered, and the experimental results at macroscopic time scales were fully reproduced, as shown in Fig. 3b. It revealed that the step-wise transformation pathway was because the surface diffusion barriers are smaller than the bulk migration barriers. The refacetting of the nanocube and the exposure of Pd atoms at the edges were to reduce the surface energies.
000 atoms were considered, and the experimental results at macroscopic time scales were fully reproduced, as shown in Fig. 3b. It revealed that the step-wise transformation pathway was because the surface diffusion barriers are smaller than the bulk migration barriers. The refacetting of the nanocube and the exposure of Pd atoms at the edges were to reduce the surface energies.
Further combined theoretical and experimental studies showed that the directed exposure of the core atoms can be controlled by manipulating the shell thickness, which provides a way to synthesize unique partial-core–shell nanoalloys for special catalytic applications.
Apart from the Pd@Pt NPs, the KMC model also worked very well for an Au@Pd core–shell alloy.59 In the experiments, a well-designed Pd@Au core–shell NP was observed to transform into a uniform alloy particle in ETEM (Fig. 4a). The initial structure is a round core–shell structure. Fast refacetting occurs below 200 °C, changing the round shape to a facetted one. Further increasing heating temperature induced a similar alloying process to that observed in the case of Pd@Pt, i.e., an alloying process above 500 °C after rounding of the NPs at 400 °C. The transformation pathway of a 7 nm Au@Pd NP, containing 11![[thin space (1/6-em)]](https://www.rsc.org/images/entities/char_2009.gif) 993 atoms, from a core–shell structure to mixed alloys was simulated at 600 °C for 20 million KMC steps (Fig. 4b). The simulated transition pathway agreed with the in situ experimental observations very well. It helps to understand that the round–facetted–round shape change is caused by the same tendency to reduce the surface energy and due to the extremely low speed of metal atoms' inter-diffusion at low temperatures.
993 atoms, from a core–shell structure to mixed alloys was simulated at 600 °C for 20 million KMC steps (Fig. 4b). The simulated transition pathway agreed with the in situ experimental observations very well. It helps to understand that the round–facetted–round shape change is caused by the same tendency to reduce the surface energy and due to the extremely low speed of metal atoms' inter-diffusion at low temperatures.
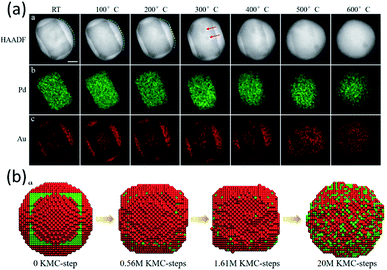 | ||
| Fig. 4 (a) Surface transformation, atomic redistribution and alloying process of Au@Pd core–shell NPs in TEM observation. (b) Atomic KMC simulations of the Pd@Au NP transformation process from a core–shell structure to mixed alloys at 600 °C. Adapted with permission from ref. 59. Copyright 2019 The Royal Society of Chemistry. | ||
In the work of Vara et al., the thermal stability of Pt-based nanocages was studied using high-resolution TEM with in situ heating.60 They observed hole enlargement and the creation of nanoframes in all the nanocages at elevated temperatures (Fig. 5a) and rationalized the phenomena from the point of view of surface free energy.
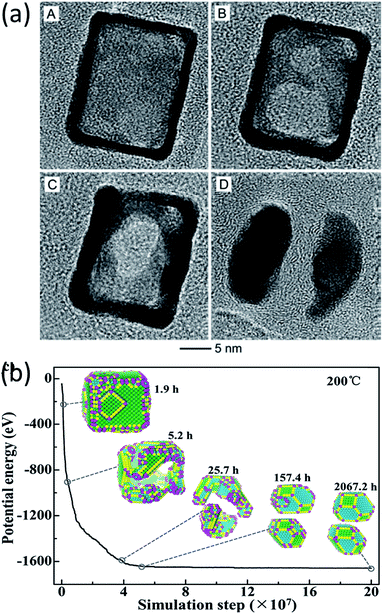 | ||
| Fig. 5 (a) TEM images of a Pt hollow nanocube disintegrating at elevated temperature. Adapted with permission from ref. 60. Copyright 2018 Wiley-VCH Verlag GmbH & Co. KGaA, Weinheim. (b) Structure evolution simulation of a Pt hollow nanocube at 200 °C. Adapted with permission from ref. 38. Copyright 2018 Wiley-VCH Verlag GmbH & Co. KGaA, Weinheim. | ||
The structural evolution of a hollow Pt NP with an initial cubic structure at temperatures of 100 °C, 200 °C, and 400 °C was simulated in the time range of seconds, hours and years. The simulated results showed that the transformation goes through three stages, as can be seen in Fig. 5b. It changes from a cubic nanocage to a chamfer nanobox, a nanoframe, and eventually into two NPs. This transformation pathway agreed with the in situ experimental observations very well.
Through the extensive studies of hollow NPs with different sizes and shapes of different metal species, it was revealed that the instability of a hollow nanocage was attributed to the faster refacetting of the outer shell than the inner shell. Based on this understanding, a highly stable hollow nanocrystal at high temperatures was designed.
4 Conclusions and perspective
With the help of in situ techniques, the evolution of nanocatalysts can be precisely captured and even visualized directly under some reaction conditions, which can amplify (even overturn) our understanding of the atomic mechanism of catalytic reactions. However, limited by time/spatial resolution and complex reaction conditions of the experiments, more detailed information is still missing, which urgently requires the participation of theoretical modeling. In this mini-review, we briefly summarized the recent progress of the multi-scale atomistic modeling of metal NPs under working conditions.With the MSR and real-time KMC model, ETEM observations can be quantitatively reproduced and the physical insight behind the reshaping of metal NPs under reaction conditions has been revealed. More importantly, these models can fill the gap in the study of the reconstruction of any interesting catalytic NP at any given condition. The precise predictions of the equilibrium shapes of Au/Cu/Pt/Pd metal NPs in various environments such as H2O, CO, NO, CO/NO, O2, H2, N2, etc. have been reported in the literature along with a wide range of temperature and pressure. The studies of other catalytic systems, such as Ru,61 Rh, and Co, are under way. It can be foreseen that the use of modeling could work as a guide for experimentalists to perform purposeful in situ studies.
To facilitate the in situ study of NPs under working environments, Gao's group developed the Multiscale Operando Simulation Package (MOSP),62 a software package to simulate structural evolution. It is designed with an interactive user interface in a simple style for the easy-use of both experimental and theoretical scientists on a desktop/laptop within an affordable time period (seconds for the equilibrium structures and hours for dynamic evolutions). With MOSP, the shape evolution of various metal NPs in different gas/liquid, single/multi-component, temperature, pressure, and support systems can be quantitatively predicted. The real-time simulations of nanocrystal transformations at elevated temperatures are possible as well. MOSP is designed to be a useful tool for understanding and reproducing in situ experimental observations. It also provides critical information for designing high-efficiency catalysts.
Conflicts of interest
There are no conflicts to declare.Acknowledgements
This work is supported by the National Natural Science Foundation of China (11604357, 21773287, 11574340). B. Z. thanks the Natural Science Foundation of Shanghai (16ZR1443200) and the Youth Innovation Promotion Association CAS.Notes and references
- G. Ertl, H. Knözinger and J. Weitkamp, “Heterogeneous Catalysis” Robert Welch Conferences on Chemical Research, 1981, vol. 25, p. 179 Search PubMed.
- A. T. Bell, Science, 2003, 299, 1688–1691 CrossRef CAS PubMed.
- M. Valden, X. Lai and D. W. Goodman, Science, 1998, 281, 1647–1650 CrossRef CAS.
- F. Tao and M. Salmeron, Science, 2011, 331, 171–174 CrossRef CAS PubMed.
- F. Tao and P. A. Crozier, Chem. Rev., 2016, 116, 3487–3539 CrossRef CAS PubMed.
- Y. Jiang, Z. Zhang, W. Yuan, X. Zhang, Y. Wang and Z. Zhang, Nano Res., 2018, 11, 42–67 CrossRef.
- P. Thostrup, E. Christoffersen, H. Lorensen, K. W. Jacobsen, F. Besenbacher and J. K. Nørskov, Phys. Rev. Lett., 2001, 87, 126102 CrossRef CAS PubMed.
- K. B. Rider, K. S. Hwang, M. Salmeron and G. A. Somorjai, Phys. Rev. Lett., 2001, 86, 4330 CrossRef CAS PubMed.
- L. Österlund, P. Rasmussen, P. Thostrup, E. Lægsgaard, I. Stensgaard and F. Besenbacher, Phys. Rev. Lett., 2001, 86, 460 CrossRef PubMed.
- P. L. Hansen, J. B. Wagner, S. Helveg, J. R. Rostrup-Nielsen, B. S. Clausen and H. Topsøe, Science, 2002, 295, 2053–2055 CrossRef CAS PubMed.
- S. R. Longwitz, J. Schnadt, E. K. Vestergaard, R. T. Vang, E. Lægsgaard, I. Stensgaard, H. Brune and F. Besenbacher, J. Phys. Chem. B, 2004, 108, 14497–14502 CrossRef CAS.
- R. T. Vang, J.-G. Wang, J. Knudsen, J. Schnadt, E. Lægsgaard, I. Stensgaard and F. Besenbacher, J. Phys. Chem. B, 2005, 109, 14262–14265 CrossRef CAS PubMed.
- P. Nolte, A. Stierle, N. Jin-Phillipp, N. Kasper, T. Schulli and H. Dosch, Science, 2008, 321, 1654–1658 CrossRef CAS PubMed.
- F. Tao, S. Dag, L.-W. Wang, Z. Liu, D. R. Butcher, M. Salmeron and G. A. Somorjai, Nano Lett., 2009, 9, 2167–2171 CrossRef CAS PubMed.
- F. Tao, S. Dag, L.-W. Wang, Z. Liu, D. R. Butcher, H. Bluhm, M. Salmeron and G. A. Somorjai, Science, 2010, 327, 850–853 CrossRef CAS PubMed.
- H. Yoshida, Y. Kuwauchi, J. R. Jinschek, K. Sun, S. Tanaka, M. Kohyama, S. Shimada, M. Haruta and S. Takeda, Science, 2012, 335, 317–319 CrossRef CAS PubMed.
- S. Vendelbo, C. F. Elkjær, H. Falsig, I. Puspitasari, P. Dona, L. Mele, B. Morana, B. Nelissen, R. Van Rijn and J. Creemer, Nat. Mater., 2014, 13, 884 CrossRef CAS PubMed.
- H. Cao, X. Qian, C. Wang, X. Ma, J. Yin and Z. Zhu, J. Am. Chem. Soc., 2005, 127, 16024–16025 CrossRef CAS PubMed.
- B. Lim, M. Jiang, P. H. Camargo, E. C. Cho, J. Tao, X. Lu, Y. Zhu and Y. Xia, Science, 2009, 324, 1302–1305 CrossRef CAS PubMed.
- L. Zhang, L. T. Roling, X. Wang, M. Vara, M. Chi, J. Liu, S.-I. Choi, J. Park, J. A. Herron and Z. Xie, Science, 2015, 349, 412–416 CrossRef CAS PubMed.
- Y. Xia, Y. Xiong, B. Lim and S. E. Skrabalak, Angew. Chem., Int. Ed., 2009, 48, 60–103 CrossRef CAS PubMed.
- S. Guo, S. Dong and E. Wang, ACS Nano, 2009, 4, 547–555 CrossRef PubMed.
- W. Albrecht, A. van de Glind, H. Yoshida, Y. Isozaki, A. Imhof, A. van Blaaderen, P. E. de Jongh, K. P. de Jong, J. Zečević and S. Takeda, Ultramicroscopy, 2018, 193, 97–103 CrossRef CAS PubMed.
- S. Takeda, Y. Kuwauchi and H. Yoshida, Ultramicroscopy, 2015, 151, 178–190 CrossRef CAS PubMed.
- M. L. Taheri, E. A. Stach, I. Arslan, P. A. Crozier, B. C. Kabius, T. LaGrange, A. M. Minor, S. Takeda, M. Tanase and J. B. Wagner, Ultramicroscopy, 2016, 170, 86–95 CrossRef CAS PubMed.
- S. Takeda and H. Yoshida, Microscopy, 2013, 62, 193–203 CrossRef CAS PubMed.
- Y.-G. Wang, Y. Yoon, V.-A. Glezakou, J. Li and R. Rousseau, J. Am. Chem. Soc., 2013, 135, 10673–10683 CrossRef CAS PubMed.
- R. Ouyang, J.-X. Liu and W.-X. Li, J. Am. Chem. Soc., 2013, 135, 1760–1771 CrossRef CAS PubMed.
- J.-C. Liu, Y.-G. Wang and J. Li, J. Am. Chem. Soc., 2017, 139, 6190–6199 CrossRef CAS PubMed.
- Z.-H. Zeng, J. L. Da Silva and W.-X. Li, Phys. Chem. Chem. Phys., 2010, 12, 2459–2470 RSC.
- Z. Li, F. Gao and W. T. Tysoe, J. Phys. Chem. C, 2010, 114, 16909–16916 CrossRef CAS.
- J. L. Fajín, A. Bruix, M. N. D. Cordeiro, J. R. Gomes and F. Illas, Phys. Chem. Chem. Phys., 2012, 137, 034701 Search PubMed.
- D. Tang and C. Hu, J. Phys. Chem. Lett., 2011, 2, 2972–2977 CrossRef CAS.
- B. Zhu, Z. Xu, C. Wang and Y. Gao, Nano Lett., 2016, 16, 2628–2632 CrossRef CAS PubMed.
- B. Zhu, J. Meng and Y. Gao, J. Phys. Chem. C, 2017, 121, 5629–5634 CrossRef CAS.
- J. Meng, B. Zhu and Y. Gao, J. Phys. Chem. C, 2018, 122, 6144–6150 CrossRef CAS.
- M. Duan, J. Yu, J. Meng, B. Zhu, Y. Wang and Y. Gao, Angew. Chem., 2018, 130, 6574–6579 CrossRef.
- X. Y. Li, B. Zhu, R. Qi and Y. Gao, Adv. Theory Simul., 2019, 2, 1800127 CrossRef.
- X.-Y. Li, B. Zhu and Y. Gao, 2018, arXiv preprint arXiv:1811.08945.
- G. D. Barmparis and I. N. Remediakis, Phys. Rev. B: Condens. Matter Mater. Phys., 2012, 86, 085457 CrossRef.
- G. D. Barmparis, K. Honkala and I. N. Remediakis, J. Chem. Phys., 2013, 138, 064702 CrossRef PubMed.
- E. Guggenheim and R. Fowler, Statistical Thermodynamics: a Version of Statistical Mechanics for Students of Physics and Chemistry, The University Press, Cambridge, 1939 Search PubMed.
- G. Barcaro, A. Fortunelli, F. Nita and R. Ferrando, Phys. Rev. Lett., 2005, 95, 246103 CrossRef CAS PubMed.
- C. H. Turner, Y. Lei and Y. Bao, Nanoscale, 2016, 8, 9354–9365 RSC.
- X. Ye, M. R. Jones, L. B. Frechette, Q. Chen, A. S. Power, P. Ercius, G. Dunn, G. M. Rotskoff, S. C. Nguyen, V. P. Adiga, A. Zettl, E. Ranani, P. L. Geissler and A. P. Alivisatos, Science, 2016, 354, 874–877 CrossRef CAS PubMed.
- J. Qian, Q. An, A. Fortunelli, R. L. Nielsen and W. A. Goddard III, J. Am. Chem. Soc., 2018, 140, 6288–6297 CrossRef CAS PubMed.
- X. He, F. Cheng and Z.-X. Chen, Sci. Rep., 2016, 6, 33128–33137 CrossRef CAS PubMed.
- X. Zhang, J. Meng, B. Zhu, J. Yu, S. Zou, Z. Zhang, Y. Gao and Y. Wang, Chem. Commun., 2017, 53, 13213–13216 RSC.
- X. Zhang, J. Meng, B. Zhu, W. Yuan, H. Yang, Z. Zhang, Y. Gao and Y. Wang, Chem. Commun., 2018, 54, 8587–8590 RSC.
- A. Chmielewski, J. Meng, B. Zhu, Y. Gao, H. Guesmi, H. Prunier, D. Alloyeau, G. Wang, C. Louis and L. Delannoy, ACS Nano, 2019, 13, 2024–2033 CAS.
- R. Ferrando, J. Jellinek and R. L. Johnston, Chem. Rev., 2008, 108, 845–910 CrossRef CAS PubMed.
- G. Tréglia, B. Legrand and F. Ducastelle, Europhys. Lett., 1988, 7, 575–580 CrossRef.
- F. Baletto, C. Mottet and R. Ferrando, Phys. Rev. Lett., 2003, 90, 135504–135508 CrossRef CAS PubMed.
- W. Vervisch, C. Mottet and J. Goniakowski, Phys. Rev. B, 2002, 65, 245411–245420 CrossRef.
- J. Creuze, H. Guesmi, C. Mottet, B. Zhu and B. Legrand, Surf. Sci., 2015, 639, 48–53 CrossRef CAS.
- B. Zhu, H. Guesmi, J. Creuze, B. Legrand and C. Mottet, Phys. Chem. Chem. Phys., 2015, 17, 28129–28136 RSC.
- A. Bruma, R. Ismail, L. O. Paz-Borbón, H. Arslan, G. Barcaro, A. Fortunelli, Z. Y. Li and R. Johnston, Nanoscale, 2013, 5, 646–652 RSC.
- M. Tang, B. Zhu, J. Meng, X. Zhang, W. Yuan, Z. Zhang, Y. Gao and Y. Wang, Mater. Today Nano, 2018, 1, 41–46 CrossRef.
- Z. Wu, M. Tang, X. Li, S. Luo, W. Yuan, B. Zhu, H. Zhang, H. Yang, Y. Gao and Y. Wang, Phys. Chem. Chem. Phys., 2019, 21, 3134–3139 RSC.
- M. Vara, X. Wang, J. Howe, M. Chi and Y. Xia, ChemNanoMat, 2018, 4, 112–117 CrossRef CAS.
- L. Liu, M. Yu, B. Hou, Q. Wang, B. Zhu, L. Jia and D. Li, Nanoscale, 2019, 11, 8037–8046 RSC.
- The MOSP can be downloaded from the website, http://www.mosp.top.
| This journal is © The Royal Society of Chemistry 2019 |
