 Open Access Article
Investigation of photocurrents resulting from a living unicellular algae suspension with quinones over time†
Guillaume
Longatte
*a,
Adnan
Sayegh
a,
Jérôme
Delacotte
a,
Fabrice
Rappaport‡
b,
Francis-André
Wollman
b,
Manon
Guille-Collignon
a and
Frédéric
Lemaître
 *a
*a
aPASTEUR, Département de chimie, École Normale Supérieure, PSL University, Sorbonne Université, CNRS, 75005 Paris, France. E-mail: guillaume.longatte@wanadoo.fr; frederic.lemaitre@ens.fr
bLaboratory of Membrane and Molecular Physiology at IBPC, UMR7141 CNRS/ Sorbonne Université, 13 rue Pierre et Marie Curie, 75005 Paris, France
First published on 31st August 2018
Abstract
Plants, algae, and some bacteria convert solar energy into chemical energy by using photosynthesis. In light of the current energy environment, many research strategies try to benefit from photosynthesis in order to generate usable photobioelectricity. Among all the strategies developed for transferring electrons from the photosynthetic chain to an outer collecting electrode, we recently implemented a method on a preparative scale (high surface electrode) based on a Chlamydomonas reinhardtii green algae suspension in the presence of exogenous quinones as redox mediators. While giving rise to an interesting performance (10–60 μA cm−2) in the course of one hour, this device appears to cause a slow decrease of the recorded photocurrent. In this paper, we wish to analyze and understand this gradual fall in performance in order to limit this issue in future applications. We thus first show that this kind of degradation could be related to over-irradiation conditions or side-effects of quinones depending on experimental conditions. We therefore built an empirical model involving a kinetic quenching induced by incubation with quinones, which is globally consistent with the experimental data provided by fluorescence measurements achieved after dark incubation of algae in the presence of quinones.
1. Introduction
Sunlight is the most abundant and sustainable source of energy available on Earth.1 That is why strategies have been developed for many years in order to take advantage of solar energy. In this respect, photosynthesis, the biological process evolved by nature to feed the biosphere with reduced carbon, is nowadays a source of inspiration for implementing new and promising conversion strategies. However, despite the very high efficiency of the photochemical converters Photosystems I and II, only a few percent of the total energy available from sunlight is converted into chemical energy.2,3 This apparently disappointing performance leads to two opposite considerations.4 On the one hand, it could suggest that directly exploiting a very complex system like photosynthesis is not the easiest way to harness solar energy. As a consequence, chemical and electrochemical tools can be used to perform “artificial photosynthesis”, i.e. to build photoelectrochemical systems mimicking the basic principles of photosynthesis.5,6 On the other hand, this lack of efficiency could also suggest that photosynthesis is an unexploited fuel-producing factory. From this point of view, electrochemical tools can be used to harvest electrons from “real” photosynthetic systems (particularly integral and whole systems and under high-light conditions), i.e. to benefit from “natural photosynthesis”.In the case of natural photosynthesis, an outer collecting electrode is used for harvesting the electrons from the given photosynthetic organism. Nevertheless, the implemented strategies and electrochemical configurations strongly depend on the photosynthetic targets. Immobilization of isolated photosynthetic subunits is the most popular way to favour the electrochemical communication between the photosynthetic chain and the electrode. This can be achieved with isolated PSII and PSI,7–13 with thylakoid membranes,14–20 or even with isolated chloroplasts.21 In many cases, electron relays are often required to enhance the extraction. This is why redox polymers, nanotubes or nanoparticles, and soluble mediators (mainly quinones or Fe(CN)63−) are involved in helping with the electron shuttle from the biological target to the electrode. However, the stability of the system in this approach can be questionable because of the modification of the biological environment and the lack of cell growth. To circumvent this issue, intact biological systems (cyanobacteria, algae…) are also implemented.22–27 They can be adsorbed onto the electrode surface or used in suspension. Indeed, a suspension is preferable because it potentially ensures the culture and proliferation of the photosynthetic organisms during the photosynthetic electron harvesting. However studies involving cell suspensions on a preparative scale are rather scarce,28–34 probably because electrical connectivity is made much more difficult due to natural barriers such as membranes or inner compartments that limit direct electron transfer or prevent an exogenous mediator from easily accessing its target.
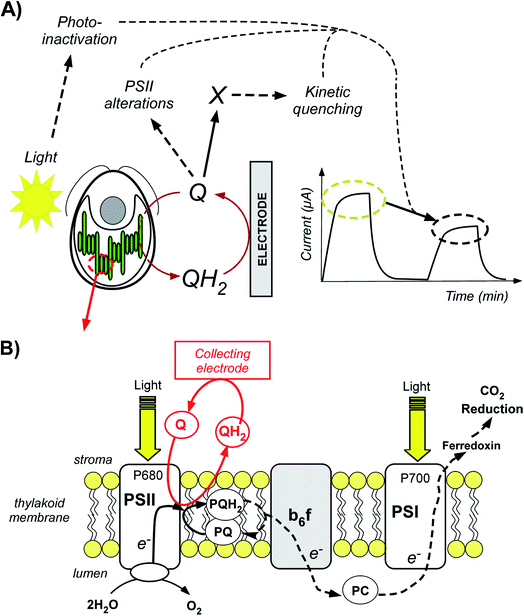
This is why we recently implemented a set-up involving a suspension of unicellular algae Chlamydomonas reinhardtii on a preparative scale (i.e. conditions where all of the suspension is involved) with a high surface area carbon electrode.35,36 Exogenous quinones were used as electron carriers and were selected after comparing and understanding their PSII acceptor behavior as a function of their concentration and illumination conditions.37,38 The recorded photocurrents were encouraging in terms of magnitude (10–60 μA cm−2) and duration (30 min). However, even though experimental dependences suggested a process that, as a whole, is controlled by the photosynthetic electron extraction, the photocurrents were lower than anticipated,35 and not fully consistent with the expected electrocatalytic mechanism involving Michaelis–Menten kinetics.39 This suggests that concomitant phenomena occurred during the extraction and contributed to progressively alter the system. In this work, we thus wish to investigate these competitive and deleterious phenomena for minimizing them in future applications. By means of electrochemical and fluorescence measurements, we will show that the degradation in terms of performance over time may depend on the experimental conditions and can be attributed to light illumination (photoinactivation) and/or poisoning effects induced by the quinones (Fig. 1A). In the context of photosynthetic microbial fuel cells, this work raises scarcely addressed questions on the long-term effects of quinones and sheds light on this kind of system.
2. Results and discussion
2.1. Time evolution of photocurrent with 2,6-DCBQ
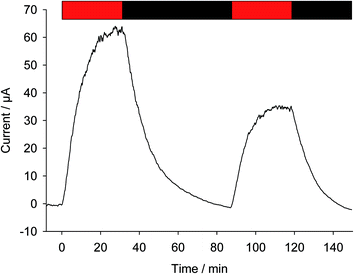
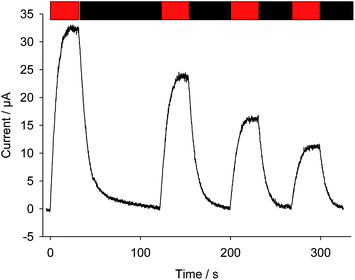
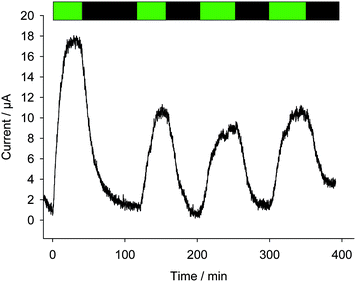
As previously described, bioelectricity can be produced from a suspension of Chlamydomonas reinhardtii algae in the presence of exogenous quinones (Fig. 1A).35 From a mechanistic point of view (Fig. 1B), the quinones (Q) will be prone to access the photosynthetic chain located in the thylakoid membrane inside the chloroplast as they are PSII acceptors.40 Under light illumination, Q will undergo reduction by extracting electrons from the level of PSII in the photosynthetic electron transfer chain. The resulting hydroquinone (QH2) is then oxidized at the collecting electrode surface (QH2 = Q + 2e− + 2H+), thus leading to a photocurrent that slowly reaches a quasi-steady state. Fig. 2 displays a representative chronoamperogram recorded during red light illumination (30 min) of a suspension of Chlamydomonas reinhardtii ΔpetA algae with 2,6-DCBQ (100 μmol L−1). This strain is considered to focus on the electron harvesting at the level of the PSII site (see the Experimental section). One way to estimate the stability of the system is to apply a second light pulse. After the application of a second light pulse, a lower steady-state photocurrent value was measured (Fig. 2).41 This is an unexpected result that was not predicted by our previous models that only took into account the redox recycling of quinones by illuminated algae on a preparative scale.35,39 Therefore, this decrease should result from a lower photochemical rate in the biological system (i.e. the rate of quinone reduction by PSII) during the second pulse. This lower photochemical rate should be related to alterations of the biological system during the experiment. On the one hand, algae are under quite strong light conditions during which photoinactivation can occur. For instance, under high-light conditions, Photosystem II cannot fully release its charge due to rate limiting steps in the electron transfer chain that are located downstream of Photosystem II. As a consequence PSII does not reach its maximal turnover rate and photoinhibition (i.e. the formation of reactive species which can damage the photosynthetic chain) can result from the reduced species accumulation.42 On the other hand, the algae are continuously incubated with exogenous quinones. Quinones act as redox mediators but could produce deleterious effects as well. Indeed, quinones are often good Michael acceptors that may be able to react (directly or indirectly) with essential macromolecules (e.g. proteins, lipids, and DNA).43,44 Thus, further investigation of the effect of quinone incubation on algae in suspension in the dark will be required to fully understand their effects.2.2. Effects of quinone incubation
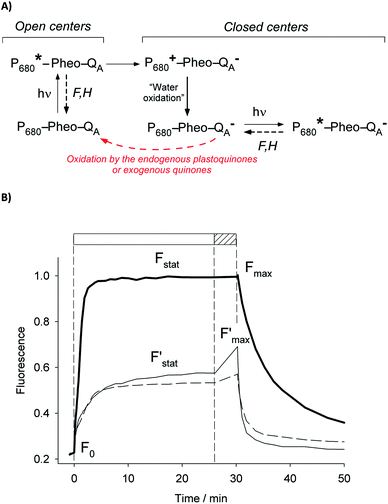 | ||
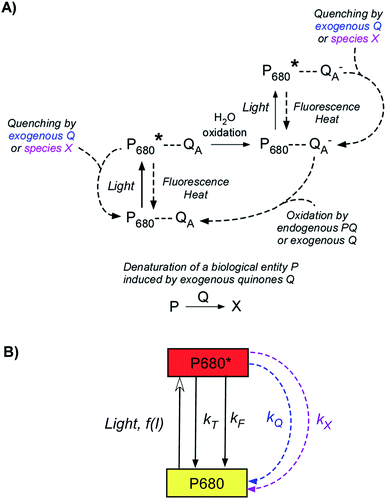
| Fig. 3 (A) Overview of the different pathways within Photosystem II after light excitation. Relaxation can occur by fluorescence (F) or heat (H) emission (such pathways mainly include relaxations of excited chlorophyll antenna; see the Fig. 1 legend. For more clarity, only the decays from the excited state of P680 are displayed). Additionally, a charge separation occurs from the reduction of the primary acceptor QA by P680 through pheophytin (Pheo). The oxidized P680+ then induces the oxidation of water. The electron transfer along the chain will then proceed by means of the plastoquinone pool (see Fig. 1). Exogenous quinones are PSII acceptors and can extract photosynthetic electrons by oxidizing QA− or the plastoquinone pool. (B) Fluorescence induction curves (see the text) achieved with a suspension of Chlamydomonas reinhardtii (ΔpetA mutants; 107 cells per mL). The solid lines correspond to typical curves without any addition of exogenous quinones (solid thick line) or in the presence of 2,6 DCBQ (solid thin and dashed lines; 25 μmol L−1). The thin solid line corresponds to a curve recorded just after the addition of quinones. The dashed line displays the induction curve after 3 h of pre-incubation with the quinone. The fluorescence values are normalized with respect to the maximum value Fmax. The shape of the induction curve is related to the illumination sequence. Firstly, a continuous illumination is applied (top rectangle in white). The initial fluorescence level, F°, is related to a situation in which all the QA centers are in an oxidized state ((A) left). Then, the photosynthetic activity begins. Some open QA centers are reduced to closed QA− centers which may be oxidized by endogenous plastoquinones or exogenous quinones ((A) right). This leads to a higher steady-state fluorescence level (Fstat) that results from the relaxation of open (QA) and closed (QA−) centers ((A) left and right). Secondly, the supersaturating pulse (top hatched rectangle) prevents the oxidation of QA−, thus leading to a maximum fluorescence level (Fmax). | ||
The ratio of open centers Φ is defined as the proportion of oxidized PSII sites. It can be calculated with the F0, Fstat and Fmax values (Φ = (Fmax − Fstat)/(Fmax – F0)) and yields the redox state of the PSII acceptors.37,38 As reported in previous studies, this is a good estimate of an exogenous PSII acceptor efficiency.47 As an example, adding exogenous quinones to the algae suspension leads to an increase in Φ, due to electron transfer between the reduced PSII sites and the added quinones (Fig. 3A).37,38 In this work, we focus on the PSII state by means of the ΔpetA mutant which is devoid of a major electron carrier, the cytochrome b6f complex, downstream of the plastoquinone pool which is the reservoir of electron acceptors for PSII. In the absence of exogenous quinones, the electron transfer chain is thus interrupted downstream of PSII, so Fmax and Fstat values are very similar, thus leading to Φ ∼ 0. Additionally, quinones are also able to perform fluorescence quenching by interacting directly with excited chlorophyll (the chlorophyll excitation (Chl + hν → Chl*) is followed by an electron transfer from the excited state of chlorophyll to quinone and the formation of a charge transfer complex (Chl* + Q → [Chl*⋯Q] → [Chl+,Q−]). In apolar media like thylakoid membranes, the separation of the ion pair is not favored and the charge transfer complex is rather assumed to decay to the ground state: [Chl+,Q−] → Chl + Q).48,49 Following the Stern–Volmer law, this quenching can be estimated by using maximum fluorescence levels before and after quinone addition (Fmax and  respectively) according to
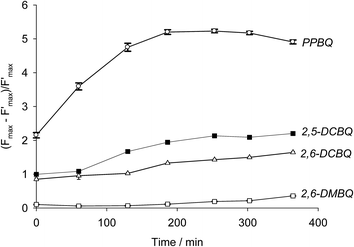
 as a function of time. It confirms that the fluorescence quenching endured by the algae progressively increases during quinone incubation (Fig. 4). These experimental results suggest that, assuming that chlorophylls are not altered, an additional (and not light dependent) quenching is induced by the exogenous quinones during long-term incubation.50 This led us to consider the presence of a second fluorescence quencher (named X, concentration CX) that could be slowly produced from a process initiated by the quinone (named Q, concentration CQ) during the incubation (like the denaturation of a biological entity). From the excitation/relaxation pathways summarized in Fig. 5A, a corresponding mathematical model can be established, one that relies on the simplified scheme displayed in Fig. 5B. It takes into account how the fluorescence quencher could modify the fluorescence levels related to the intact photosynthetic mechanism. Globally, the usual pathways following the excited P680 (fluorescence kF, heat kT, quenching by quinones kQ) are complemented with a new quenching induced by species X. Using the quasi-steady state approximation applied for the excited state P*680, the fluorescence
  (in the presence of quinones) is expressed by eqn (1):
 | (1) |
 | (2) |
Considering both eqn (1) and (2) leads to eqn (3):
 | (3) |
Two constants, KQ and KX, are defined below and correspond to quenching constants for Q and X respectively:
 | (4) |
 | (5) |
The  parameter is expressed as a global quenching parameter that can be calculated from the fluorescence measurements introduced above. In the present case, this parameter depends on both quinone and quencher concentrations, CQ and CX. It thus takes into account the two kinds of quenching. The first constant, already published elsewhere, is the instantaneous quenching due to quinones under light experiments.37 The second constant, which depends on the concentration of X, is related to a kinetic quenching due to the quinone incubation (and the subsequent formation of X) during a given dark period. As a consequence, a new quenching term, named QX, can be defined and viewed as a kinetic quenching that can be deduced from the time-dependent global quenching
  by subtracting the initial quenching due to the quinone.
 | (6) |
By assuming that quencher X results from the denaturation of a biological entity through a first order reaction (involving a rate constant k), the concentrations of this entity and X can be expressed as e−kt and 1 − e−kt, respectively. Eqn (7) can be eventually written as
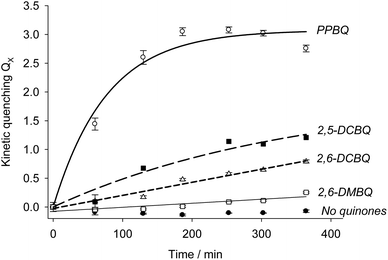
| QX = KXCX = KX(1 − e−kt) | (7) |
Modeling using eqn (7) was thus attempted from the experimental data. The results are summarized in Table 1 and Fig. 6. In the case of PPBQ, a quite good agreement is observed between the theoretical curve and the experimental data. The kinetic quenching QX appears relatively fast and saturates at a value of KX = 3.0 ± 0.1. In other cases, the kinetic quenching is unfortunately too slow to perform reliable calculations of the quenching constant KX from the fluorescence measurements (Fig. 6). Nevertheless, according to the modeling reported here, the kinetic quenching does not result from the exogenous quinones themselves but from a biological degradation product. In other words, the quenching constant KX should be quite similar for all the investigated quinones. This assumption can be used to fit the data for 2,5-DCBQ or 2,6-DCBQ using this value of KX and eqn (7), and thus to deduce the rate constant k for both cases (Table 1). Interestingly, in the 2,6-DMBQ case (i.e. a redox mediator with low efficiency to harvest electrons from PSII37), the kinetic quenching is particularly slow, thus leading to a peculiar data treatment to calculate the rate constant k (see ESI Fig. S1†).
| Added quinones | k (s−1) | R 2 |
|---|---|---|
| PPBQ | (2.4 ± 0.6) × 10−4 | 0.97 |
| 2,5-DCBQ | (2.5 ± 0.2) × 10−5 | 0.95 |
| 2,6-DCBQ | (1.4 ± 0.1) × 10−5 | 0.97 |
| 2,6-DMBQ | (6.0 ± 1.0) × 10−6 | 0.96 |
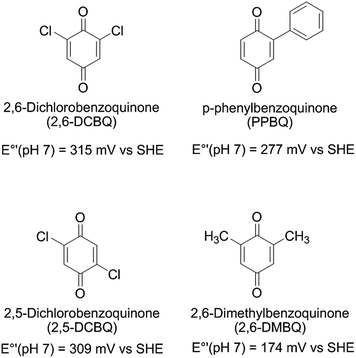
The differences in quinones can largely be summarized by electrophilicity. Taking PPBQ, DCBQs and 2,6-DMBQ as examples and the midpoint potentials (Q/QH2) at pH 7 that have been reported in the literature (Scheme 1),37,51,52 we can find a general trend in electrophilicity according to a higher E°′ value:53 DCBQs, PPBQ, and DMBQ (from highest to lowest). Thus, DCBQs are more able to react with nucleophiles than PPBQ, which exhibits better partitioning into membranes and may quench chlorophylls directly (because this phenomenon occurs within membranes, i.e. in a hydrophobic medium). On the other hand, 2,6-DMBQ is less electrophilic and less lipophilic,37 and is thus less likely to lead to kinetic quenching or an alteration of PSII. Despite its relatively poor ability to accept electrons from PSII,37 this suggests a further investigation of its use in photoelectrochemical fuel cells in which the electron harvesting will be moderate when remaining stable over time.
It is of note that kinetic quenching seems to occur faster for PPBQ when compared to the other quinones. Because PPBQ is the highest chlorophyll fluorescence quencher and the most expected lipophilic molecule among all the investigated quinones,37 it may suggest that the kinetic quenching is also related to partitioning phenomena, in contrast to the electron harvesting that may be mainly controlled in this range of concentration by electron transfer rather than mass transport.37,38 It thus raises the question if the kinetic quenching is also related to the progressive diffusion of exogenous quinones over time. This cannot be fully excluded but our data about the chlorophyll quenching by quinones (this work and ref. 37 and 38) suggest that the timescale of quinone diffusion is shorter than that of our experiments. This thus supports the assumption of a new quencher formation rather than that of the slow diffusion of quinones within the chloroplast.
Additionally, it is worth mentioning that the reported effects probably resulted from the oxidized form Q rather than from oxidative stress induced by reduced forms like hydroquinone QH2 or semiquinone Q−. If considering the redox potential of the O2/O2− couple (−155 mV vs. SHE), redox potentials of the Q/QH2 and Q/Q− couples are too positive to lead to the formation of the superoxide anion through the reaction between reduced forms of quinones and dioxygen.54 Furthermore, similar experiments were performed with the hydroquinone form. No large effect was observed under these conditions (see Fig. S4 in the ESI†).
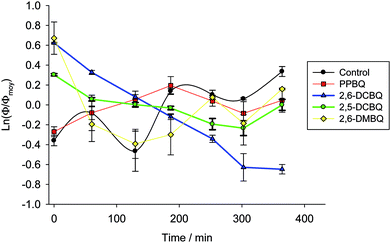
To summarize, we figured out two possible side effects of quinones (production of a second quencher X and alteration of the fraction of PSII open centers). Additionally, the expected PSII accepting behavior may be related to the decrease of the steady-state photocurrent after the second light pulse for 2,6-DCBQ. Because the kinetic quenching rapidly saturates without any changes of the ratio of open centers, PPBQ is a suitable quinone for investigating the effects of successive light illuminations on photocurrents under conditions where the system no longer evolves by side-effects of quinones.
2.3. Photocurrents as a function of time with PPBQ
![[thin space (1/6-em)]](https://www.rsc.org/images/entities/char_2009.gif) 000–15
000–15![[thin space (1/6-em)]](https://www.rsc.org/images/entities/char_2009.gif) 000 s), a more accurate analysis remains difficult to achieve since making comparisons for both quinones under the same conditions is not strictly feasible.
000 s), a more accurate analysis remains difficult to achieve since making comparisons for both quinones under the same conditions is not strictly feasible.
| 2,6-DCBQ | PPBQ | |||||||
|---|---|---|---|---|---|---|---|---|
| Current (μA) | Decrease (%) | Area (μC) | Decrease (%) | Current (μA) | Decrease (%) | Area (μC) | Decrease (%) | |
| Pulse 1 | 64.0 ± 6.0 | — | (1.33 ± 0.10) × 105 | — | 33.1 ± 3.0 | — | (7.18 ± 0.70) × 104 | — |
| Pulse 2 | 35.3 ± 3.4 | 45 | (6.77 ± 0.70) × 104 | 49 | 24.6 ± 2.5 | 26 | (4.73 ± 0.40) × 104 | 34 |
| Pulse 3 | — | — | — | — | 16.8 ± 2.0 | 32 | (3.14 ± 0.30) × 104 | 34 |
| Pulse 4 | — | — | — | — | 11.7 ± 1.0 | 31 | (2.14 ± 0.20) × 104 | 32 |
This trend is quantitatively confirmed by complementary fluorescence measurements. As evidenced above, the maximum kinetic quenching value KX is close to 3. Furthermore, the maximum fluorescence level following the supersaturating pulse without any kinetic quenching,  , can be expressed as follows:
 | (8) |
A new kinetic quenching parameter can thus be written:
 | (9) |
 | (10) |
Combining eqn (5) and (10) leads to
 | (11) |
The KQ value has already been determined ((2.37 ± 0.19) × 104 L mol−1) previously.37 Under our conditions, if taking into account the lost quinone amount in other compartments (14.3 μmol L−1; see details in ref. 37), KQCQ is close to 2 and helps calculate the  value which is eventually equal to 1. Moreover, eqn (9) shows that
  tends to
  when saturation is reached (CX → 1). Assuming a correlation between the steady-state photocurrent and the kinetic quenching in the case of PPBQ under moderate illumination, it thus means that the initial photocurrent (first pulse) should be two times higher than the photocurrent recorded after saturation of the poisoning (second pulse). Considering a magnitude of 10 μA during the second pulse, the first photocurrent intensity would be close to 20 μA, i.e. close to the experimental value of 17 μA (the slight discrepancy may be explained by the fact that the kinetic quenching effect started before the first pulse). However, we cannot exclude that photoinactivation still occurs during the first two pulses. Indeed, photoinactivation is usually related to the photochemical rate (a high photochemical rate should induce more photoinactivation). Thus, during the first pulse and the higher photocurrent, the photoinactivation rate may be quite high, thus preventing the efficacy of reparation pathways, subsequently decreasing the photochemical rate such that it would not be high enough to induce a significant photoinactivation during the next light pulses.
To summarize, these experiments globally confirmed that three phenomena can explain the photocurrent decrease at relatively long timescales. Of note, under moderate illumination conditions with PPBQ over long timescales, the photocurrent remains constant after successive pulses. These peculiar conditions (no photoinactivation, saturated kinetic quenching and no alteration of open centers) allow one to examine photosynthetic electron harvesting only controlled by an electrocatalytic mechanism involving Michaelis–Menten kinetics.35,39
3. Experimental section
3.1. Cell culture
Chlamydomonas reinhardtii ΔpetA mutants correspond to cells lacking the cytochrome b6f complex (see the photosynthetic chain displayed in Fig. 1).56 The cytochrome b6f complex is a quinol:plastocyanin oxidoreductase. Its absence prevents the reoxidation of the plastoquinol PQH2 generated by the light-induced turnovers of PSII, thus leading to the fast arrest of light-driven electron flow. In the context of quinones used as redox mediators and PSII acceptors, this cell model allows one to assess their ability to drive the electron flow downstream of Photosystem II and monitor it by fluorescence measurements.37 Cells were grown in Tris Acetate Phosphate medium (TAP): Tris base (20 mmol L−1), NH4Cl (7 mmol L−1), MgSO4 (0.83 mmol L−1), CaCl2 (0.45 mmol L−1), K2HPO4 (1.65 mmol L−1), and KH2PO4 (1.05 mmol L−1) at 25 °C under rather dim light conditions (50 μE m−2 s−1) to a final concentration of 107 cells per mL.3.2. Photocurrent measurements
3.3. Fluorescence measurements
All fluorescence measurements have been performed as previously described in ref. 37 and 38 (actinic light: I° = 340 μE m−2 s−1; supersaturating pulse = 5000 μE m−2 s−1). The actinic light induces the PSII excitation. The supersaturating pulse of excitation light has a much higher intensity than that of the continuous illumination beam. Therefore, the rate at which light is absorbed by PSII largely exceeds that in the subsequent steps downstream from PSII, thus promoting the full reduction of the quinone primary electro-acceptor QA to QA− (closed centers). Because the cell model lacks the b6f complex and the supersaturating pulse is long enough to fully reduce all electron acceptors (250 ms), no further electron transfer can occur. Each experiment was repeated three times.Incubation periods were achieved under dark conditions and gentle stirring in order to avoid aggregation either in the presence of quinones (2,6-DCBQ, PPBQ, 2,5-DCBQ or 2,6-DMBQ, see Scheme 1) or in the absence of quinones as a control experiment. Fluorescence measurements were performed every hour for each sample (V = 2 mL).
4. Conclusions
In conclusion, we demonstrated through fluorescence and electrochemical measurements that during photosynthetic electron harvesting from a unicellular algae suspension with quinones, a decrease in terms of performance took place because of three different phenomena. The first one is related to the light conditions, i.e. to possible photoinactivation. The other two are side-effects due to the added quinones as redox mediators. On the one hand, a kinetic quenching is observed for all the quinones, especially for PPBQ. On the other hand, an alteration of the ratio of open centers is also observed for chloroquinones that may lead to the decrease of the photochemical rate and a corresponding decrease of recorded photocurrents. Controlling the experimental conditions (nature of the quinone, incubation time, and excitation light) discriminate the different kinds of degradation (from quinones or from light). Therefore, a compromise needs to be found at long timescales between the ability of the quinone to harvest electrons and its poisoning effect. As an example, poor PSII acceptor quinones like DMBQ will not induce any alteration but will require appropriate mutations of the photosynthetic organism to increase its ability to extract electrons from the exogenous quinone acceptor.36To the best of our knowledge, investigations of quinone effects on these biophotoelectrochemical cells are rather scarce. While the different mechanisms of action still remain to be investigated in detail, the results reported here pave the way for future optimizations of quinone use for harvesting bioelectricity from photosynthetic organisms.
Conflicts of interest
There are no conflicts to declare.Acknowledgements
This work has been supported in part by CNRS (UMR8640 and UMR7141), Ecole Normale Supérieure, French Ministry of Research, Faculté des Sciences et Ingénierie – Sorbonne Université, the “Fondation Pierre-Gilles de Gennes pour la Recherche” FPGG0049 and the “Initiative d’Excellence” program from the French State (Grant “DYNAMO”, ANR-11-LABX-0011-01). G. L. and M. G.-C. are thankful for the Institut Universitaire de France Fellowship Program. Dr Alison Tebo is gratefully acknowledged for helpful comments.Notes and references
- N. S. Lewis and D. G. Nocera, Proc. Natl. Acad. Sci. U. S. A., 2006, 103, 15729–15735 CrossRef PubMed.
- R. E. Blankenship, D. M. Tiede, J. Barber, G. W. Brudvig, G. Fleming, M. Ghirardi, M. R. Gunner, W. Junge, D. M. Kramer, A. Melis, T. A. Moore, C. C. Moser, D. G. Nocera, A. J. Nozik, D. R. Ort, W. W. Parson, R. C. Prince and R. T. Sayre, Science, 2011, 332, 805–809 CrossRef PubMed.
- X. G. Zhu, S. P. Long and D. R. Ort, in Annu. Rev. Plant Biol., ed. S. Merchant, W. R. Briggs and D. Ort, 2010, vol. 61, pp. 235–261 Search PubMed.
- J. Barber, Chem. Soc. Rev., 2009, 38, 185–196 RSC.
- E. S. Andreiadis, M. Chavarot-Kerlidou, M. Fontecave and V. Artero, Photochem. Photobiol., 2011, 87, 946–964 CrossRef PubMed.
- J. Qi, W. Zhang and R. Cao, Adv. Energy Mater., 2018, 8, 1701620 CrossRef.
- A. Badura, D. Guschin, B. Esper, T. Kothe, S. Neugebauer, W. Schuhmann and M. Rogner, Electroanalysis, 2008, 20, 1043–1047 CrossRef.
- S. C. Feifel, K. R. Stieger, H. Lokstein, H. Lux and F. Lisdat, J. Mater. Chem. A, 2015, 3, 12188–12196 RSC.
- V. Hartmann, T. Kothe, S. Poller, E. El-Mohsnawy, M. M. Nowaczyk, N. Plumere, W. Schuhmann and M. Rogner, Phys. Chem. Chem. Phys., 2014, 16, 11936–11941 RSC.
- D. Mersch, C. Y. Lee, J. Z. Zhang, K. Brinkert, J. C. Fontecilla-Camps, A. W. Rutherford and E. Reisner, J. Am. Chem. Soc., 2015, 137, 8541–8549 CrossRef PubMed.
- O. Yehezkeli, R. Tel-Vered, J. Wasserman, A. Trifonov, D. Michaeli, R. Nechushtai and I. Willner, Nat. Commun., 2012, 3 Search PubMed.
- T. Kothe, S. Poeller, F. Zhao, P. Fortgang, M. Roegner, W. Schuhmann and N. Plumere, Chem.–Eur. J., 2014, 20, 11029–11034 CrossRef PubMed.
- K. P. Sokol, D. Mersch, V. Hartmann, J. Z. Zhang, M. M. Nowaczyk, M. Rogner, A. Ruff, W. Schuhmann, N. Plumere and E. Reisner, Energy Environ. Sci., 2016, 9, 3698–3709 RSC.
- K. Hasan, Y. Dilgin, S. C. Emek, M. Tavahodi, H.-E. Akerlund, P.-A. Albertsson and L. Gorton, ChemElectroChem, 2014, 1, 131–139 CrossRef.
- J. O. Calkins, Y. Umasankar, H. O'Neill and R. P. Ramasamy, Energy Environ. Sci., 2013, 6, 1891–1900 RSC.
- H. Hamidi, K. Hasan, S. C. Emek, Y. Dilgin, H.-E. Akerlund, P.-A. Albertsson, D. Leech and L. Gorton, ChemSusChem, 2015, 8, 990–993 CrossRef PubMed.
- S. Larom, D. Kallmann, G. Saper, R. Pinhassi, A. Rothschild, H. Dotan, G. Ankonina, G. Schuster and N. Adir, Photosynth. Res., 2015, 126, 161–169 CrossRef PubMed.
- G. Pankratova, D. Pankratov, K. Hasan, H. E. Akerlund, P. A. Albertsson, D. Leech, S. Shleev and L. Gorton, Adv. Energy Mater., 2017, 7 Search PubMed.
- R. I. Pinhassi, D. Kallmann, G. Soper, S. Larom, A. Linkov, A. Boulouis, M. A. Schottler, R. Bock, A. Rothschild, N. Adir and G. Schuster, PLoS One, 2015, 10 CrossRef PubMed.
- M. Rasmussen, A. Shrier and S. D. Minteer, Phys. Chem. Chem. Phys., 2013, 15, 9062–9065 RSC.
- K. Hasan, R. D. Milton, M. Grattieri, T. Wang, M. Stephanz and S. D. Minteer, ACS Catal., 2017, 7, 2257–2265 CrossRef.
- K. Hasan, K. V. R. Reddy, V. Essmann, K. Gorecki, P. O. Conghaile, W. Schuhmann, D. Leech, C. Hagerhall and L. Gorton, Electroanalysis, 2015, 27, 118–127 CrossRef.
- K. Hasan, H. B. Yildiz, E. Sperling, P. O. Conghaile, M. A. Packer, D. Leech, C. Hagerhall and L. Gorton, Phys. Chem. Chem. Phys., 2014, 16, 24676–24680 RSC.
- K. Hasan, E. Cevik, E. Sperling, M. A. Packer, D. Leech and L. Gorton, Adv. Energy Mater., 2015, 5, 1501100 CrossRef.
- L. Darus, T. Sadakane, P. Ledezma, S. Tsujimura, I. Osadebe, D. Leech, L. Gorton and S. Freguia, J. Electrochem. Soc., 2017, 164, H3037–H3040 CrossRef.
- K. Hasan, V. Grippo, E. Sperling, M. A. Packer, D. Leech and L. Gorton, ChemElectroChem, 2017, 4, 412–417 CrossRef.
- N. Sekar, Y. Umasankar and R. P. Ramasamy, Phys. Chem. Chem. Phys., 2014, 16, 7862–7871 RSC.
- A. Anderson, A. Laohavisit, I. K. Blaby, P. Bombelli, C. J. Howe, S. S. Merchant, J. M. Davies and A. G. Smith, Plant Biotechnol. J., 2016, 14, 22–28 CrossRef PubMed.
- P. Bombelli, R. W. Bradley, A. M. Scott, A. J. Philips, A. J. McCormick, S. M. Cruz, A. Anderson, K. Yunus, D. S. Bendall, P. J. Cameron, J. M. Davies, A. G. Smith, C. J. Howe and A. C. Fisher, Energy Environ. Sci., 2011, 4, 4690–4698 RSC.
- R. W. Bradley, P. Bombelli, D. J. Lea-Smith and C. J. Howe, Phys. Chem. Chem. Phys., 2013, 15, 13611–13618 RSC.
- B. De Caprariis, P. De Filippis, A. Di Battista, L. Di Palma and M. Scarsella, in Ibic2014: 4th International Conference on Industrial Biotechnology, ed. E. Bardone, M. Bravi and T. Keshavarz, 2014, vol. 38, pp. 523–528 Search PubMed.
- L. F. Huang, J. Y. Lin, K. Y. Pan, C. K. Huang and Y. K. Chu, Int. J. Mol. Sci., 2015, 16, 19308–19325 CrossRef PubMed.
- X. M. Li, T. X. Liu, K. Wang and T. D. Waite, Environ. Sci. Technol., 2015, 49, 1392–1399 CrossRef PubMed.
- Z. A. Chen, Y. X. Lyu, K. Y. Wang, X. L. Dong, M. C. Deng, C. M. Bai, Y. P. Xu, W. Zhang and Z. M. Liu, Int. J. Hydrogen Energy, 2013, 38, 13045–13049 CrossRef.
- G. Longatte, F. Rappaport, F. A. Wollman, M. Guille-Collignon and F. Lemaitre, Electrochim. Acta, 2017, 236, 327–332 CrossRef.
- H. Y. Fu, D. Picot, Y. Choquet, G. Longatte, A. Sayegh, J. Delacotte, M. Guille-Collignon, F. Lemaitre, F. Rappaport and F. A. Wollman, Nat. Commun., 2017, 8, 15274 CrossRef PubMed.
- G. Longatte, H. Y. Fu, O. Buriez, E. Labbe, F. A. Wollman, C. Amatore, F. Rappaport, M. Guille-Collignon and F. Lemaitre, Biophys. Chem., 2015, 205, 1–8 CrossRef PubMed.
- G. Longatte, F. Rappaport, F. A. Wollman, M. Guille-Collignon and F. Lemaitre, Photochem. Photobiol. Sci., 2016, 15, 969–979 RSC.
- G. Longatte, M. Guille-Collignon and F. Lemaitre, ChemPhysChem, 2017, 18, 2643–2650 CrossRef PubMed.
- S. Izawa, in Methods Enzymol., ed. A. San Pietro, 1980, pp. P413-434 Search PubMed.
- A continuous illumination over several hours leads to a progressive decrease of the photocurrent until reaching the baseline level (see ref. 35). This way of estimating the stability of the system was not considered here because it cannot help to distinguish light-dependent and light-independent phenomena.
- T. Roach and A. Krieger-Liszkay, Curr. Protein Pept. Sci., 2014, 15, 351–362 CrossRef PubMed.
- J. L. Bolton and T. Dunlap, Chem. Res. Toxicol., 2017, 30, 13–37 Search PubMed.
- J. L. Bolton, M. A. Trush, T. M. Penning, G. Dryhurst and T. J. Monks, Chem. Res. Toxicol., 2000, 13, 135–160 Search PubMed.
- R. Delosme, P. Joliot and J. Lavorel, C. R. Hebd. Seances Acad. Sci., 1959, 249, 1409–1411 Search PubMed.
- B. Genty, J. M. Briantais and N. R. Baker, Biochim. Biophys. Acta, 1989, 990, 87–92 CrossRef.
- K. Maxwell and G. N. Johnson, J. Exp. Bot., 2000, 51, 659–668 CrossRef PubMed.
- K. K. Karukstis, S. C. Boegeman, J. A. Fruetel, S. M. Gruber and M. H. Terris, Biochim. Biophys. Acta, 1987, 891, 256–264 CrossRef.
- K. K. Karukstis, S. M. Gruber, J. A. Fruetel and S. C. Boegeman, Biochim. Biophys. Acta, 1988, 932, 84–90 CrossRef.
- S. Hay, B. B. Wallace, T. A. Smith, K. P. Ghiggino and T. Wydrzynski, Proc. Natl. Acad. Sci. U. S. A., 2004, 101, 17675–17680 CrossRef PubMed.
- V. Petrouleas and B. A. Diner, Biochim. Biophys. Acta, 1987, 893, 126–137 CrossRef.
- C. Preston and C. Critchley, Photosynth. Res., 1988, 16, 187–202 CrossRef PubMed.
- X. W. Guo and H. Mayr, J. Am. Chem. Soc., 2014, 136, 11499–11512 CrossRef PubMed.
- Y. Song and G. R. Buettner, Free Radical Biol. Med., 2010, 49, 919–962 CrossRef PubMed.
- The photocurrent recorded with 2,6-DCBQ is almost double the one with PPBQ. Indeed, the different conditions (high incubation time for PPBQ) make comparison difficult. This may result from several reasons. For instance, the high incubation time with PPBQ allows the kinetic quenching to take place and leads to a lower photocurrent. Nevertheless, other explanations are not related to the side-effects of the quinones. This rather suggests that 2,6-DCBQ is intrinsically more able to harvest electrons from PSII than PPBQ. This trend was already observed in previous fluorescence measurements (see ref. 37) where the percentage of open centers Φ (i.e. the extraction yield) was displayed as a function of the quinone concentration. The initial slope ρ0 and the maximum value of Φ were shown to be higher for 2,6-DCBQ (4.1 × 10⁻² μmol−1 L and 0.58) than for PPBQ (1.7 × 10⁻² μmol−1 L and 0.48, respectively). While the redox potentials (Q/QH2 couple) are rather similar, they show a good correlation with the maximum value of Φ (when the electron transfer controls the extraction) according to Marcus theory (see ref. 38). Furthermore, the differences in terms of the initial slope ρ0 are related to conditions where the mass transfer limits the harvesting. In our case, this probably results from a higher affinity of the dichloroquinone with the QB pocket.
- B. Rimbault, D. Esposito, D. Drapier, Y. Choquet, D. Stern and F. A. Wollman, Mol. Gen. Genet., 2000, 264, 486–491 CrossRef PubMed.
Footnotes |
| † Electronic supplementary information (ESI) available. See DOI: 10.1039/c8sc03058h |
| ‡ F. Rappaport passed away before completion of this manuscript. His co-authors wish to dedicate this article to his memory. |
| This journal is © The Royal Society of Chemistry 2018 |

