Speciation and kinetic study of iron promoted sugar conversion to 5-hydroxymethylfurfural (HMF) and levulinic acid (LA)†
Yuan
Jiang
ab,
Linan
Yang
ab,
Christine M.
Bohn
ab,
Guannan
Li
a,
Dong
Han
c,
Nathan S.
Mosier
bde,
Jeffrey T.
Miller
f,
Hilkka I.
Kenttämaa
ab and
Mahdi M.
Abu-Omar
*abf
aBrown Laboratory, Department of Chemistry, Purdue University, 560 Oval Drive, West Lafayette, IN 47907, USA
bThe Center for direct Catalytic Conversion of Biomass to Biofuels (C3Bio), Purdue University, Discovery Park, 1203 West State Street, West Lafayette, IN 47907, USA
cMaurice J. Zucrow Laboratories, School of Mechanical Engineering, Purdue University, 500 Allison Road, West Lafayette, IN 47907, USA
dSchool of Agricultural and Biological Engineering, Purdue University, West Lafayette, IN 47907, USA
eLaboratory of Renewable Resources Engineering, Purdue University, West Lafayette, IN 47907, USA
fDepartment of Chemical Engineering, Purdue University, 480 Stadium Mall Dr., West Lafayette, IN 47907, USA. E-mail: mabuomar@purdue.edu
First published on 17th August 2015
Abstract
Cellulose, a major component of renewable biomass, is a polymer of glucose. Abundant and cheap iron salts promote the conversion of glucose to 5-hydroxymethylfurfural (HMF) and levulinic acid (LA). In this study, glucose transformations catalyzed by iron(III) chloride (FeCl3) in aqueous and in biphasic media (water and 2-methyltetrahydrofuran (MeTHF)) were investigated. Speciation via mass spectrometry (MS), UV-Vis, and X-ray absorption spectroscopy (XAS) show that FeIII is reduced to FeII (over 95%) readily in the early stage of carbohydrate conversion. The reaction time profiles of reactants (glucose and fructose) as well as products (HMF and LA) were modeled using MATLAB to obtain reaction rate constants. The contributions of iron and the intrinsic Brønsted acidity of iron salts in the sugar conversion are discussed. The kinetic study of sugar conversion indicated that the water–MeTHF biphasic system hinders the conversion of sugars to humins and unknown byproducts and increases the yields of HMF and LA. By adjusting concentrations of FeII and Brønsted acidity, yields of 88% LA (FeCl3, pH = 1) or 56% HMF (FeSO4, pH = 2) from glucose in a water–MeTHF biphasic system are achieved. The optimized reaction conditions proved effective in the conversion of milled poplar biomass to LA (53% yield based on glucose content) and furfural (64% yield based on xylan content) using iron salt, outperforming aluminum and chromium salts.
Introduction
The dramatic growth of human society (9.6 billion people projected by 2050) and increasing greenhouse gas emissions necessitate the utilization of sustainable chemistry to replace nonrenewable chemicals and fuels in use today.1–4 Nonfood biomass is a renewable source of carbon and as a result its conversion to platform chemicals such as 5-hydroxymethylfurfural (HMF) and levulinic acid (LA) is of great interest.5–9 Currently, Brønsted acids are used. Typical industrial conditions employ dilute mineral acid of 1–10% which equates to 0.10–1.0 M in concentration. Concentrated mineral acids raise concerns about storage and corrosion of equipment, as well as high capital cost.10,11 Various Lewis acids have been studied for carbohydrate conversion. Zhao et al. reported 70% yield of HMF from glucose using CrCl2 in ionic liquid.12 Choudhary et al. obtained 59% HMF and 46% levulinic acid in water (NaCl)/THF biphasic medium using CrCl3 and HCl.8 Hu et al. demonstrated the use of SnCl4 in ionic liquid to afford 64% yield of HMF from glucose.13 However, Cr and Sn are toxic, and ionic liquids are expensive specialty solvents.14 Therefore, a more environmentally benign catalyst system is needed for the production of HMF and levulinic acid.Iron chloride hexahydrate (FeCl3) as a cheap and earth-abundant catalyst for carbohydrates conversion has attracted much interest. Abou-Yousef et al. obtained 60% total yield of furan derivatives (HMF, FHMK, and FF) from cellulose using FeCl3 in 1-ethyl-3-methylimidazolium chloride ([EMIM]Cl) ionic liquid.15 Guan and co-workers studied the complete catalytic cycle of the reaction of glucose conversion to 5-hydroxymethylfurfural (HMF) by FeCl3 in 1-butyl-3-methylimidazolium chloride ([BMIM]Cl) ionic liquid using density functional theory (DFT) calculations.16 Zhang et al. converted xylose, xylan and corncob into furfural by employing FeCl3 in γ-valerolactone (GVL).17 However, the above methods do not identify the active species experimentally, they involve the use of expensive solvents, and they do not report kinetics on the pertinent reaction pathways.
Besides the effectiveness of catalysts, the solvent system plays an important role in improving yields and selectivity of HMF and levulinic acid. Although many high boiling point solvents, such as dimethylsulfoxide (DMSO), N,N-dimethylformide (DMF), and ionic liquids (ILs) afford high conversion, their drawback is the cost and energy demand of the separation process.18–20 While water may appear ideal, using pure water is not a viable option because the products are not stable in water and easily form undesirable polymeric byproducts with sugars.21–23 In organic solvent with water (a biphasic medium), the products can be extracted away from the active phase (water and catalyst) as they are formed, preventing formation of unwanted byproducts. An added advantage to this method is easy recycling of the active catalytic aqueous phase.18,24
In this work, we investigated FeCl3 for glucose conversion to 5-hydroxymethylfurfural (HMF) and levulinic acid in both aqueous medium and water/2-methyltetrahydrofuran (MeTHF) biphasic solvent system. We show compelling evidence for FeII being the active catalytic species in the reaction. Until now, FeIII was thought to be the main active sites. The speciation of iron under the relevant reaction conditions was elucidated by mass spectrometry (MS), UV-Vis, and operando X-ray absorption spectroscopy (XAS). The kinetics of glucose and fructose reactions in both solvent systems were defined and rate constants of the pertinent reaction pathways were successfully modeled by MATLAB. This study provides new insight into the interplay among the various reaction steps, and illuminates the role of the reaction medium (solvent effect), which can help identify avenues that favor HMF or levulinic acid production.
Materials and methods
Reagents
Glucose, fructose, HMF, levulinic acid, formic acid, hydrochloric acid (37 wt%), sulfuric acid (51 wt%), 2-methyltetrahydrofuran (MeTHF), FeCl3·6H2O, FeCl2, Fe2(SO4)3·xH2O, FeSO4·7H2O were purchased from Sigma-Aldrich and used as received.Typical reaction
A 1.0 mL aqueous solution of 0.10 M iron salt and 0.25 M substrate (glucose, fructose, or HMF) was added to a 10 mL glass microwave reaction vessel (CEM Discover SP/S-class microwave reactor, CEM Corporation) along with a small Teflon coated stir bar. For biphasic reaction systems 3.0 mL of MeTHF was then added to the vessel. Using the fixed power control method, reactions were heated to 140–200 °C at 100 or 200 watts of microwave power for up to 240 minutes. Reaction times began once the set temperature was achieved as registered by the instrument's IR temperature sensor. Reactions were quenched by a Nitrogen gas flow which cooled the system to 60 °C.After reaction, the organic phase was isolated from the aqueous phase. Aqueous samples were filtered through a polypropylene syringe filter with 0.2 m pores and organic samples were filtered through a glass wool plug prior to analysis. The aqueous phase was analyzed by high-performance liquid chromatography (HPLC) using a Water e-2696 Separations Module equipped with an Aminex HPX-87H column (300 × 7.8 mm) set at 70 °C. The chromatograph is equipped with a reflective index on a Water 2412 Refractive Index Detector calibrated with external standards. A 0.005 M sulfuric acid solution was employed as the mobile phase at a flow rate of 0.6 mL min−1. Standard calibration curves were made from the pure substances. Glucose, fructose, formic acid, levulinic acid, and HMF eluted at 9.643, 10.295, 14.104, 16.605, 31.323 min, respectively. Aqueous pH measurements were taken using an Accument AB15/15+ pH meter (±0.01 pH units) calibrated with standard buffer solutions.
The organic phase was concentrated to a few hundred microliters. The concentrated organic layer was analyzed by 1H NMR (Bruker ARX400, qnp probe, 32 scans) using deuterated acetone (Cambridge Isotope Laboratories, 99.9%) and an internal standard of N,N-dimethylformamide (Macron, 99.8%). The NMR data for HMF and levulinic acid is as follows. 5-Hydroxymethylfurfural (C6H6O3) 1H NMR (400 MHz, acetone-D6): δ 9.59 (s, 1H), 7.38 (d, J = 3.4 Hz, 1H), 6.58 (d, J = 3.4 Hz, 1H), 4.72 (dd, J = 5.6, 6.6 Hz, 1H), 4.63 (d, J = 6.0 Hz, 2H). Levulinic acid (C5H8O3) 1H NMR (400 MHz, acetone-D6): δ 2.72 (t, J = 6.5 Hz, 2H), 2.50 (t, J = 6.5 Hz, 2H), 2.12 (s, 3H). Integration and analysis of NMR spectra was performed with MestReNova version 8.1.
Conversion of the reactant, yield, and selectivity of the products were calculated following eqn (1)–(3) below:
 | (1) |
 | (2) |
 | (3) |
Here, products are HMF, levulinic acid, or formic acid. Reactants include glucose, fructose, or HMF.
General instrumentation
UV-vis spectroscopy was carried out on a Hewlett-Packard 8453 diode array spectrophotometer at room temperature using 1.00 cm cells. The aqueous solution of each reaction sample was diluted 500-fold with water. Powder X-ray diffraction (XRD) experiments were performed on a Rigaku SmartLab X-ray Diffractometer using a copper K alpha X-ray source. The method is grazing incidence X-ray diffraction with a grazing incidence angle of 0.5 degrees.Mass spectrometry (MS)
All mass spectrometric experiments were carried out in a Thermo Scientific linear quadruple ion trap mass spectrometer (LTQ). An electrospray ionization (ESI) source was used for ion generation. The aqueous solution of each reactant or reaction mixture was diluted 50-fold with water. The diluted solutions were directly introduced into the ESI source by using a Hamilton Gastight syringe at a flow rate of 20 μL min−1. The ESI experiments were carried out in the positive ion mode. The structures of most of the ions were examined by using MS2 experiments, i.e., by isolating them and subjecting them to collision-activated dissociation (CAD). When necessary, the fragment ions formed were subjected to subsequent isolation and CAD events to obtain structural information (MS3 experiment). All mass spectra acquired were an average of at least 40 scans.X-ray absorption spectroscopy (XAS)
X-ray absorption measurements were acquired on the insertion device beam line (10-ID) of the Materials Research Collaborative Access Team (MRCAT) at the Advanced Photon Source, Argonne National Laboratory. The data was collected in transmission quick scan mode where the monochromator was scanned continuously during the measurements. Insertion device experiments utilized a cryogenically cooled double-crystal Si (111) monochromator in conjunction with an uncoated glass mirror to minimize the presence of harmonics. The ionization chambers were optimized for the maximum current with linear response (∼1010 photons detected per s) with 10% absorption (N2) in the incident ion chamber and 70% absorption in the transmission detector. An Fe foil spectrum (edge energy 7112 eV) was acquired simultaneously with each measurement for energy calibration. Samples were prepared in a cell made of Vespel polymer equipped with a screw top and O-ring fitting.25 The Fe concentration was adjusted to be 0.10 M with a path length of 3.5 mm. The cell was heated using an in-house designed electrical aluminium block heater.The edge energy of the X-Ray absorption near edge structure (XANES) spectrum was determined from the inflection point in the edge, i.e., the maximum in the first derivative of the XANES spectrum. The pre-edge energy was determined from the maximum of the pre-edge peak. EXAFS fits of the Fe species were modelled using experimental phase shift and backscattering amplitudes, which were obtained from Fe(III) acetylacetonate (6 Fe–O at 1.99 Å). Standard procedures based on WINXAS 3.1 software were used to fit the XANES and EXAFS data.26 The EXAFS parameters were obtained by a least square fit in k-space of the k2-weighted isolated first shell Fourier Transform data using Δk = 2.5–9.4 Å−1 and ΔR = 1.0–2.0 Å. Linear combination fitting of XANES data was used to determine the fraction of FeII and FeIII for the in situ study using 0.10 M aqueous solutions of FeCl2 and FeCl3 at RT in He and air, respectively.
Results and discussion
Speciation of iron salts as determined by MS
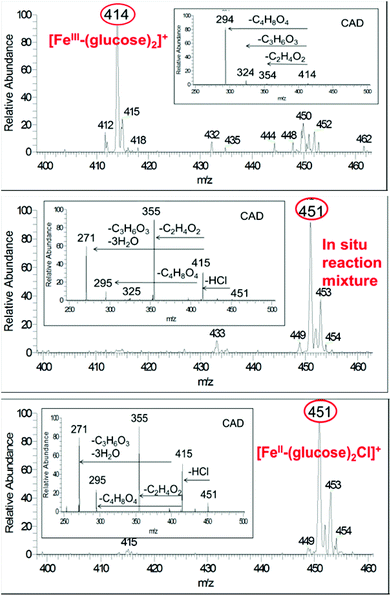
Under ambient conditions, mass spectra of solutions of FeCl3 and glucose have a dominant ion peak at m/z 414, which corresponds to [Fe3+ + 2glucose − 2H+]+ (Fig. 1a). In comparison, solutions of FeCl2 and glucose give m/z 451 and 453, which corresponds to [Fe2+ + 2glucose + Cl−]+ (Fig. 1c). These assignments have been confirmed by CAD (ESI†). Fructose is an isomer of glucose and the same dominant ions of m/z 414 and 451 (and 453) were observed in the mass spectra of FeIII and FeII solutions with fructose, respectively. CAD spectrum is substantially different from that for glucose (ESI†). Upon CAD, ions of m/z 414 for FeIII-glucose yields fragment ions of m/z 294 (100%), m/z 324 (8%) and m/z 354 (2%). In contrast, CAD of isolated peak at m/z 414 for FeIII-fructose yield ions of m/z 324 (100%) and m/z 396 (10%). CAD of isolated peak at m/z 451 for FeII-glucose yields ions of m/z 355 (100%), 271 (80%), 295 (22%) and 415 (50%), while CAD for FeII-fructose yields ions of m/z 415 (100%) and additional ions of m/z 271 (8%) and 325 (8%). Therefore, mass spectrometry can distinguish the prevalent oxidation state of iron, (III) versus (II), as well as differentiate between the sugar isomers glucose versus fructose. This provides a powerful tool to follow speciation under catalytic reaction conditions.Upon microwave heating of FeCl3 and glucose solution, the abundance of the ion m/z 414 decreases and that of m/z 451 (corresponding to FeII) becomes the dominant ion (Fig. 1a and b). The same behavior is observed for fructose but faster. The abundance of ion m/z 414 decreases and that of m/z 451 reaches a maximum in a matter of a few seconds after microwave heating is initiated. The mass spectra of conventionally heated reactions showed identical behavior, but requiring longer reaction times (ESI†). In summary, small amount of the sugar (glucose or fructose) at elevated temperature reduces the starting FeIII to FeII and the resulting FeII persists throughout the reaction, and is responsible for carbohydrate conversion throughout the reaction.
Absorption spectra
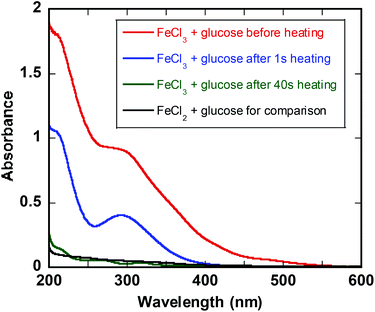
The UV-Vis spectrum of FeIII in glucose solution shows characteristic absorption band at 300 nm (Fig. 2). Immediately after heating at 140 °C the band at 300 nm decreases and after ca. 1 min the UV-vis spectrum is featureless and superimposable to that of FeII in glucose solution (Fig. 2). The same behavior is observed for iron fructose solutions (ESI†).Quantification of FeIII reduction at elevated temperature
To further confirm the oxidation state of the dominant iron species in solution, X-ray absorption spectroscopy (XAS) was conducted on reaction samples (operando). The XANES spectra demonstrated that FeIII is completely converted to FeII at 140 °C for glucose (Fig. 3). The same behavior is observed for fructose (ESI†). The reduction of iron under microwave heating at 140 °C was faster (2 min) than thermal heating (16 min). These results are consistent with UV-vis spectra and the observation that the yellow solution of initial FeIII-fructose solution turns colorless within seconds after heating. However, in reactions with glucose small amount of orange precipitate is formed. Filtration and analysis of the precipitate by powder X-ray diffraction (XRD) revealed that the solid spectrum matches that of Akaganéite, which is an iron(III) oxide-hydroxide/chloride mineral with the general formula FeIIIO(OH,Cl) (ESI†). This precipitate re-dissolves readily after 2 min at 140 °C, resulting in essentially complete conversion of FeIII to FeII.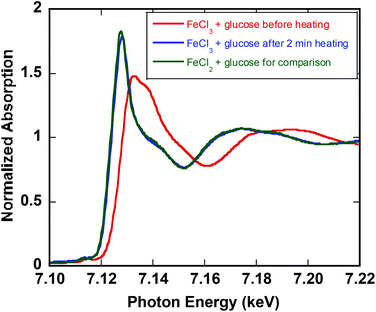 | ||
| Fig. 3 Fe K-edge XANES from 7.09 to 7.16 keV for 0.10 M FeCl3 and 0.25 M glucose (red), after 2 min heating at 140 °C (blue), and 0.10 M FeCl2 and glucose (green) for comparison. | ||
The reaction chemistry of FeIII reduction
Since water and microwave heating alone do not result in FeIII reduction to FeII (ESI†), the sugars (glucose and fructose) or their initial products must be responsible for iron reduction. The timescale of iron reduction is much faster than that of substrate conversion to products. While HMF does reduce FeIII to FeII at elevated temperature (ESI†), HMF is formed in negligible amounts over the first minute of reaction, which cannot correspond to over 95% reduction of FeIII. Furthermore, by experimental quantification of the sugar (glucose or fructose) conversion after 1 min of reaction, we find that only ca. 3% of the sugar is consumed over that initial period in which FeIII is reduced to FeII; however, in that initial time, formic acid is formed prior to any formation of levulinic acid. Formic acid by itself does not dissolve or reduce FeIII even after several minutes of heating at 140 °C. On the basis of these findings, we propose the reaction in eqn (4) for the reduction of FeIII. While the amount of formic acid quantified by HPLC in the early stage of the reaction was found to be less than that theoretically predicted by eqn (4), it is known that formic acid is not stable at elevated temperatures.27–29 Using different FeIII starting concentrations gave different amounts of formic acid as well as different [H3O+] as measured by the pH values of the solution after iron reduction (Table 1). These observations are consistent with the proposed reaction in eqn (4).| C6H12O6 + 12Fe(aq)3+ + 6H2O → 6CH2O2 + 12Fe(aq)2+ + 12H(aq)+ | (4) |
| [Fe(aq)3+]/M | [CH2O2]/M | pH | ||
|---|---|---|---|---|
| Calc.b | Measuredc | Calc.b | Measuredd | |
| a 0.25 M glucose, different concentrations of FeCl3, at 140 °C microwave heating for 2 min. Quenched reaction solution was analyzed by HPLC. b Calculated values based on amount of FeIII reduced per eqn (4). c Experimentally measured by HPLC after 2 min microwave heating. d Measured pH values at 25 °C after 2 min microwave heating. | ||||
| 0.10 | 0.050 | 0.020 | 1.00 | 0.98 |
| 0.025 | 0.0125 | 0.0028 | 1.60 | 1.64 |
| 0.010 | 0.005 | 0.0006 | 2.00 | 1.90 |
Reaction kinetics and mechanistic pathways for the dehydration of glucose and fructose promoted by iron salts
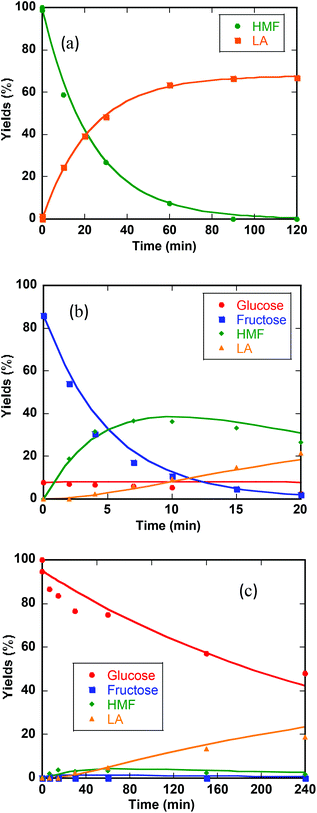
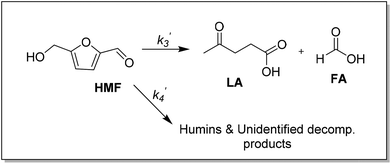
Previous studies of glucose conversion catalyzed by Lewis acids have been shown to occur by isomerization to fructose, followed by dehydration to HMF. The latter can be hydrolyzed further to levulinic acid (LA) and formic acid (FA).8,24 Some reports have suggested direct conversion of glucose to HMF in the presence of strong Brønsted acids such as HCl, H2SO4 and H3PO4.30–33 Accumulation of significant amount of fructose as observed for CrCl3 promoted conversion of glucose was used as evidence that Lewis acids catalyze isomerization and hence favor conversion via fructose.8,21 In contrast the use of FeCl3 in aqueous medium at 140 °C with glucose shows negligible accumulation of fructose (Fig. 4c). Even though glucose and fructose have identical molar masses, we are able to distinguish the two by MSn CAD experiments based on their association with iron and fragmentation patterns. As discussed above, FeIII is reduced to FeII very early on in the reaction. Ion of m/z 451 in the mass spectrum of the reaction mixture at 2 min reaction time corresponds to [FeII(sugar)2Cl]+ where sugars in the complex containing both glucose and fructose. In the CAD spectrum of isolated m/z 451, a small amount of the fragment at m/z 325 (5% relative abundance) is observed (Fig. 1b), indicating that intermediacy through fructose cannot be ruled out. Humins and undesirable products originate mainly from the decomposition of fructose and HMF.8,23,34,35The kinetics of the conversion of glucose promoted by iron was studied in aqueous solution at 140 °C. The major products are HMF and LA. A typical conversion profile is shown in Fig. 4c. The reaction was quenched at different intervals and reactant (glucose) and products (fructose, HMF, LA, and FA) were quantified by HPLC. Reaction kinetics of each component of the reaction was also investigated independently. Starting with HMF, the major products were LA and FA (Fig. 4a). The kinetics is first order in [HMF]. When starting with FeIII, it was reduced to FeII in the early stages of the reaction. Selectivity for LA versus humins and other unidentified products enabled the determination of the two parallel pathways represented by k′3 and k′4 in Scheme 1.
A study of the kinetics starting with fructose showed dehydration to HMF rapidly (10 min) followed by a slower conversion of HMF to LA (Fig. 4b). Very small amount of glucose was detected early on in the reaction and remained essentially constant throughout the conversion of fructose (Fig. 4b). Modeling of the kinetics (MATLAB) required k′2 and k′5 in addition to k′3 and k′4, which were determined independently from reactions starting with HMF (Scheme 2). The formation of glucose dictates k′−1 is operative but its smaller proportion relative to k′2 and k′5 prohibited its determination with any precision.
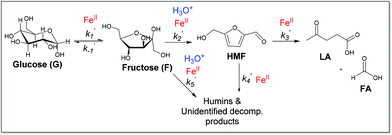 | ||
| Scheme 2 Proposed mechanism of glucose and fructose conversion promoted by iron, showing hydronium ion participation in fructose dehydration to HMF (k′2) and degradation to humins (k′5). | ||
The kinetics of glucose conversion (Fig. 4c) can be modeled satisfactorily by addition of k′1 (Scheme 2). There was no improvement in kinetic modelling by adding pathways as direct conversion of glucose to HMF or degradation of glucose to humins and unidentifiable products. Therefore, these pathways are deemed unnecessary and insignificant in their contribution. The ODE (ordinary differential equations) used in the kinetic fittings are shown as eqn (5)–(8). Summary of the observed rate constants is given in Table 2 at different starting FeCl3 concentrations.
 | (5) |
 | (6) |
 | (7) |
 | (8) |
Dependence on iron versus H3O+
In measuring the observed rate constants in Table 2 at different starting iron concentrations (ESI†), we were attempting to discern the dependence of each of the reaction steps on the concentration of iron versus that of hydronium ion. Starting with either glucose or fructose and using only [H3O+] affords lower conversion compared to that in the presence of iron. Furthermore, as long as the pH is adjusted to match the value obtained when starting with FeIII salts, reactions catalyzed by FeII salts and HCl give comparable conversion and kinetics as that starting with FeIII (ESI†). This observation is in agreement with all spectroscopic observations detailed thus far that FeIII is reduced very early on in the reaction (after 1 min under microwave heating) to FeII. Therefore, we suggest that if the change in the observed rate constants in Table 2 is close to a factor of 4, this is taken as in agreement with the step being mainly dependent on FeII concentration, while H3O+ only contributes very little in the kinetics. However, if the change in the observed rate constant is much higher than 4, both FeII and H3O+ contribute to the kinetics of the reaction. The observed rate constants k′1, k′3, and k′4 change by a factor of ca. 4 consistent with mainly dependence on FeII. k′5 Changes by a factor of ca. 8 indicating contribution from both iron and hydronium ion; also k′2 changes by a factor of 6 as both iron and hydronium affect the kinetics of fructose reaction to HMF and other decomposition products (Scheme 2). This result is consistent with previous reports when applying other Lewis acids.8,9,36Monophasic versus biphasic, effect of solvent on reaction kinetics and selectivity
It has been observed previously that using an organic solvent enhances the yields of HMF.18,36–43 In part yield improvements were contributed to the higher solubility of the dehydration products such as HMF in the organic phase and hence by extracting the product away from the aqueous catalytic phase, further degradation of HMF to undesirable products was assumed to be inhibited. To test this hypothesis quantitatively, we conducted kinetic studies on fructose dehydration in water![[thin space (1/6-em)]](https://www.rsc.org/images/entities/char_2009.gif) :
:![[thin space (1/6-em)]](https://www.rsc.org/images/entities/char_2009.gif) MeTHF (1
MeTHF (1![[thin space (1/6-em)]](https://www.rsc.org/images/entities/char_2009.gif) :
:![[thin space (1/6-em)]](https://www.rsc.org/images/entities/char_2009.gif) 3 v/v). Products were analyzed in both phases to obtain total concentrations as a function of time. The same kinetic model employed for monophasic aqueous solution (Scheme 2 and eqn (5)–(8)) was employed and found to be satisfactory (ESI†).
3 v/v). Products were analyzed in both phases to obtain total concentrations as a function of time. The same kinetic model employed for monophasic aqueous solution (Scheme 2 and eqn (5)–(8)) was employed and found to be satisfactory (ESI†).
The observed rate constants for the biphasic systems are compared to those observed in water in Table 3. Reduction in k′3 and k′4 are expected as HMF in the biphasic system is removed from the aqueous catalytic phase and hence its subsequent hydration to LA and FA as well as decomposition to other products is significantly reduced. A small enhancement in fructose conversion to HMF (k′2) is observed; again as fructose is mainly present in the aqueous phase change in the kinetics of its dehydration is mainly unaffected by MeTHF. However, significant reduction in the rate of fructose conversion to humins and other byproducts (k′5) was not expected. In fact the change in k′5 specifically is most responsible for enhanced yield of HMF in the biphasic system, k′5 (in water)/k′5 (in water![[thin space (1/6-em)]](https://www.rsc.org/images/entities/char_2009.gif) :
:![[thin space (1/6-em)]](https://www.rsc.org/images/entities/char_2009.gif) MeTHF) = 15. This finding suggests that the effect of a secondary solvent (biphasic system) is much more than protecting the dehydrated product (HMF or LA) by extracting it away from the active aqueous phase. Rather the secondary solvent affects profoundly the kinetics of side undesirable reactions of the carbohydrate in the active aqueous phase. The co-solvent must be interacting directly with the carbohydrate substrate, the iron catalyst, and/or the active species resulting from coordination of the carbohydrate to iron, and via such direct interactions MeTHF molecules in water suppress the kinetics of undesirable side reactions of fructose. These observations partly agree with an earlier reported observation that an improvement in the selectivity to HMF over zeolites after addition of organic solvent (MIBK) is attributed to the suppression of humins formation by filling of the pores of zeolite with MIBK.44
MeTHF) = 15. This finding suggests that the effect of a secondary solvent (biphasic system) is much more than protecting the dehydrated product (HMF or LA) by extracting it away from the active aqueous phase. Rather the secondary solvent affects profoundly the kinetics of side undesirable reactions of the carbohydrate in the active aqueous phase. The co-solvent must be interacting directly with the carbohydrate substrate, the iron catalyst, and/or the active species resulting from coordination of the carbohydrate to iron, and via such direct interactions MeTHF molecules in water suppress the kinetics of undesirable side reactions of fructose. These observations partly agree with an earlier reported observation that an improvement in the selectivity to HMF over zeolites after addition of organic solvent (MIBK) is attributed to the suppression of humins formation by filling of the pores of zeolite with MIBK.44
![[thin space (1/6-em)]](https://www.rsc.org/images/entities/char_2009.gif) :
:![[thin space (1/6-em)]](https://www.rsc.org/images/entities/char_2009.gif) MeTHF solventa
MeTHF solventa
| Observed rate constants (×103)/s−1 | k ′2 | k ′3 | k ′4 | k ′5 |
|---|---|---|---|---|
| a Conditions: 0.25 M starting substance (fructose or HMF) and 0.10 M FeCl3, at 140 °C microwave heating. In a biphasic system, 3 ml MeTHF was added to 1 ml aqueous solution additionally. Aqueous solutions were analyzed by HPLC, and organic solutions were analyzed by 1H NMR. | ||||
| Water (monophasic) | 2.2 | 0.48 | 0.23 | 1.0 |
Water![[thin space (1/6-em)]](https://www.rsc.org/images/entities/char_2009.gif) : :![[thin space (1/6-em)]](https://www.rsc.org/images/entities/char_2009.gif) MeTHF (biphasic) MeTHF (biphasic) |
3.3 | 0.07 | 0.06 | 0.065 |
Since conversion of HMF to LA is mainly catalyzed by iron and iron is present mainly in the aqueous phase, further reactions of HMF are slowed down in presence of a MeTHF phase. However, the partitioning of the HMF reaction to LA versus undesirable products (k′3/k′4) remains roughly comparable irrespective of solvent, a ratio of 2 in water and 1.2 in water![[thin space (1/6-em)]](https://www.rsc.org/images/entities/char_2009.gif) :
:![[thin space (1/6-em)]](https://www.rsc.org/images/entities/char_2009.gif) MeTHF.
MeTHF.
Despite the enhanced kinetics of the biphasic medium, the use of MeTHF comes with one disadvantage. Careful investigation of the GC showed two peaks at 7.5 and 4.2 min in addition to HMF and LA. Further investigation and characterization of these peaks by GC/MS demonstrated that these peaks originate from the conversion of small amount of the MeTHF solvent to (Z)-3-penten-1-ol (4.2 min) and 1,4-pentanediol (7.5 min) under the reaction conditions. Previous literature also reported similar observations.45–47 Control experiments without glucose or fructose and in the presence of iron resulted in formation of these two products (ESI†). Therefore, in biphasic reactions some of the organic solvent MeTHF is lost to ring opening products, but the amount of the decomposed solvent is smaller than 1% of MeTHF.
Optimization of reaction conditions for selective products
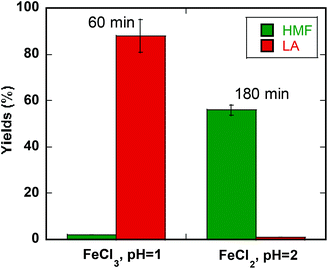
Based on our kinetics studies and the effect of MeTHF in suppressing fructose side reactions, we investigated several conditions that would allow selection for a desirable product. Speciation studies allow us to adjust concentrations of Lewis acidity (FeII) and Brønsted acidity (H3O+) separately in order to get HMF or LA selectively. We have also taken into consideration the time of reaction to minimize time required for conversion and balancing conversion versus selectivity. At high conversion and faster kinetics, the highest yield and selectivity of levulinic acid (LA) of 88% with 100% glucose conversion can be achieved in biphasic medium (water![[thin space (1/6-em)]](https://www.rsc.org/images/entities/char_2009.gif) :
:![[thin space (1/6-em)]](https://www.rsc.org/images/entities/char_2009.gif) MeTHF) at 200 °C in 60 min (pH = 1) with FeCl3 (Fig. 5).48 The highest yield and selectivity for HMF (56%) can be achieved in a biphasic solution at higher pH (pH = 2) in 180 min with FeSO4 (Fig. 5).
MeTHF) at 200 °C in 60 min (pH = 1) with FeCl3 (Fig. 5).48 The highest yield and selectivity for HMF (56%) can be achieved in a biphasic solution at higher pH (pH = 2) in 180 min with FeSO4 (Fig. 5).
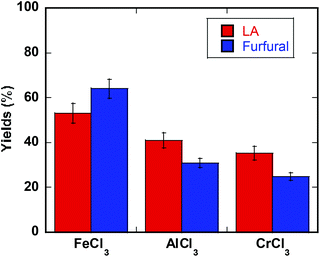
The optimized reaction conditions (180 °C, 200 watts microwave heating, biphasic medium H2O![[thin space (1/6-em)]](https://www.rsc.org/images/entities/char_2009.gif) :
:![[thin space (1/6-em)]](https://www.rsc.org/images/entities/char_2009.gif) MeTHF) proved promising for conversion of intact biomass promoted by FeCl3. Milled poplar (WT717) gave 53% yield of LA (based on glucose content in biomass) and 64% yield of furfural (based on xylan content in biomass). These results were compared under identical conditions with AlCl3 and CrCl3 catalyzed reactions (Fig. 6).48 The favorable performance of iron demonstrates its promising utilization in selective conversion of intact biomass to molecules such as HMF, furfural, and LA, which can be used to make liquid fuels and high value chemicals.
MeTHF) proved promising for conversion of intact biomass promoted by FeCl3. Milled poplar (WT717) gave 53% yield of LA (based on glucose content in biomass) and 64% yield of furfural (based on xylan content in biomass). These results were compared under identical conditions with AlCl3 and CrCl3 catalyzed reactions (Fig. 6).48 The favorable performance of iron demonstrates its promising utilization in selective conversion of intact biomass to molecules such as HMF, furfural, and LA, which can be used to make liquid fuels and high value chemicals.
Conclusions
Iron salts such as FeCl3 promote conversion of glucose and fructose to HMF and levulinic acid. Under microwave heating at 140 °C the starting FeIII(aq) is reduced readily within 1 min to FeII(aq). According to mass spectrometry of reaction mixtures, the major iron species in solution is present as [FeII(sugar)2Cl]+ and CAD experiments can distinguish glucose versus fructose complexes of iron(II). The reaction pathway for conversion of glucose proceeds via isomerization to fructose as the rate-determining step followed by faster conversion of fructose to HMF and humins (unidentified side products) in a ratio of 2![[thin space (1/6-em)]](https://www.rsc.org/images/entities/char_2009.gif) :
:![[thin space (1/6-em)]](https://www.rsc.org/images/entities/char_2009.gif) 1, respectively. FeII is involved in the hydration of HMF and its decomposition to humins in a split ratio of 2
1, respectively. FeII is involved in the hydration of HMF and its decomposition to humins in a split ratio of 2![[thin space (1/6-em)]](https://www.rsc.org/images/entities/char_2009.gif) :
:![[thin space (1/6-em)]](https://www.rsc.org/images/entities/char_2009.gif) 1. While isomerization of glucose, hydration of HMF to LA, and decomposition of HMF mainly depend on iron, dehydration of fructose and its degradation to humins are promoted by iron as well as the hydronium ion (pH).
1. While isomerization of glucose, hydration of HMF to LA, and decomposition of HMF mainly depend on iron, dehydration of fructose and its degradation to humins are promoted by iron as well as the hydronium ion (pH).
In biphasic medium of water![[thin space (1/6-em)]](https://www.rsc.org/images/entities/char_2009.gif) :
:![[thin space (1/6-em)]](https://www.rsc.org/images/entities/char_2009.gif) MeTHF, higher yields and selectivity are achieved as a result of slower kinetics for HMF reactions, but more importantly due to the previously unrealized suppression of fructose degradation to humins in the active aqueous phase as a result of having MeTHF present. Speciation studies allow us to adjust concentrations of Lewis acidity (FeII) and Brønsted acidity (H3O+) separately, and our quantitative kinetic analysis enabled the realization of conditions that provide up to 88% selectivity for LA (FeCl3, pH = 1, 60 min) and 56% for HMF (FeSO4, pH = 2, 180 min). Furthermore, iron shows under these conditions (180 °C, 200 watts microwave heating, and biphasic medium) promising results for conversion of intact poplar biomass to furfural, HMF, and levulinic acid. The drawback to the use of MeTHF as a co-solvent is some decomposition in the presence of iron and acidic pH at these elevated temperatures to (Z)-3-penten-1-ol and 1,4-pentanediol.
MeTHF, higher yields and selectivity are achieved as a result of slower kinetics for HMF reactions, but more importantly due to the previously unrealized suppression of fructose degradation to humins in the active aqueous phase as a result of having MeTHF present. Speciation studies allow us to adjust concentrations of Lewis acidity (FeII) and Brønsted acidity (H3O+) separately, and our quantitative kinetic analysis enabled the realization of conditions that provide up to 88% selectivity for LA (FeCl3, pH = 1, 60 min) and 56% for HMF (FeSO4, pH = 2, 180 min). Furthermore, iron shows under these conditions (180 °C, 200 watts microwave heating, and biphasic medium) promising results for conversion of intact poplar biomass to furfural, HMF, and levulinic acid. The drawback to the use of MeTHF as a co-solvent is some decomposition in the presence of iron and acidic pH at these elevated temperatures to (Z)-3-penten-1-ol and 1,4-pentanediol.
Structural characterization of the iron carbohydrate complexes and understanding the molecular basis for how MeTHF alters the decomposition kinetics of fructose may enable better design of yet more selective systems, by using an earth abundant and cheap Fe.
Abbreviations
| CAD | Collision-activated dissociation |
| LQIT | Linear quadrupole ion trap |
| ESI | Electrospray ionization |
| HMF | 5-Hydroxymethylfurfural |
| LA | Levulinic acid |
| MeTHF | 2-Methyltetrahydrafuran |
| FeII or FeIII | The aqueous ion dissolved from the chloride or sulphate salt |
Acknowledgements
We gratefully acknowledge financial support by the Center for Direct Catalytic Conversion of Biomass to Biofuels (C3Bio), an Energy Frontier Research Center funded by the U.S. Department of Energy, Office of Science, Office of Basic Energy Sciences under Award Number DE-SC0000997. We thank James R. Gallagher, Guanghui Zhang and Andrew Bean Getsoian for their valuable input and help with XAS experiments, Bobby Balow for his help with XRD experiments, Silei Xiong for her advice with MATLAB, and Shuo Liu for helpful discussion.Notes and references
- J. S. Luterbacher, D. Martin Alonso and J. A. Dumesic, Green Chem., 2014, 16, 4816 RSC
.
- S. A. Connor , The Independent, Aug 3, 2009.
- D. M. Alonso, J. Q. Bond and J. A. Dumesic, Green Chem., 2010, 12, 1493 RSC
.
- M. Stöcker, Angew. Chem., Int. Ed., 2008, 47, 9200 CrossRef PubMed
.
- Y. Román-Leshkov, C. J. Barrett, Z. Y. Liu and J. A. Dumesic, Nature, 2007, 447, 982 CrossRef PubMed
.
- H. Jadhav, C. M. Pedersen, T. Sølling and M. Bols, ChemSusChem, 2011, 4, 1049 CrossRef CAS PubMed
.
- B. F. M. Kuster, Starch/Stärke, 1990, 42, 314 CrossRef CAS
.
- V. Choudhary, S. H. Mushrif, C. Ho, A. Anderko, V. Nikolakis, N. S. Marinkovic, A. I. Frenkel, S. I. Sandler and D. G. Vlachos, J. Am. Chem. Soc., 2013, 135, 3997 CrossRef CAS PubMed
.
- T. Wang, M. W. Nolte and B. H. Shanks, Green Chem., 2014, 16, 548 RSC
.
- L. Kupiainen, J. Ahola and J. Tanskanen, Chem. Eng. Res. Des., 2011, 89, 2706 CrossRef CAS
.
- Y. Román-Leshkov, J. N. Chheda and J. A. Dumesic, Science, 2006, 312, 1933 CrossRef PubMed
.
- H. Zhao, J. E. Holladay, H. Brown and Z. C. Zhang, Science, 2007, 316, 1597 CrossRef CAS PubMed
.
- S. Hu, Z. Zhang, J. Song, Y. Zhou and B. Han, Green Chem., 2009, 11, 1746 RSC
.
- P. G. Jessop, Green Chem., 2011, 13, 1391 RSC
.
- H. Abou-Yousef, E. B. Hassan and P. Steele, J. Fuel Chem. Technol., 2013, 41, 214 CrossRef CAS
.
- J. Guan, Q. Cao, X. Guo and X. Mu, Comput. Theor. Chem., 2011, 963, 453 CrossRef CAS
.
- L. Zhang, H. Yu, P. Wang and Y. Li, Bioresour. Technol., 2014, 151, 355 CrossRef CAS PubMed
.
- B. Saha and M. M. Abu-Omar, Green Chem., 2014, 16, 24 RSC
.
- M. Ohara, A. Takagaki, S. Nishimura and K. Ebitani, Appl. Catal., A, 2010, 383, 149 CrossRef CAS
.
- K. B. Sidhpuria, A. L. Daniel-da-Silva, T. Trindade and J. A. P. Coutinho, Green Chem., 2011, 13, 340 RSC
.
- S. Jia, K. Liu, Z. Xu, P. Yan, W. Xu, X. Liu and Z. C. Zhang, Catal. Today, 2014, 234, 83 CrossRef CAS
.
- T. S. Hansen, J. Mielby and A. Riisager, Green Chem., 2011, 13, 109 RSC
.
- F. S. Asghari and H. Yoshida, Ind. Eng. Chem. Res., 2006, 45, 2163 CrossRef CAS
.
- Y. Yang, C. Hu and M. M. Abu-Omar, Green Chem., 2012, 14, 509 RSC
.
- R. C. Nelson and J. T. Miller, Catal. Sci. Technol., 2012, 2, 461 CAS
.
- T. Ressler, J. Synchrotron Radiat., 1998, 5, 118 CrossRef CAS PubMed
.
- H. W. Gibson, Chem. Rev., 1969, 69, 673 CrossRef CAS
.
- N. Akiya and P. E. Savage, AIChE J., 1998, 44, 405 CrossRef CAS
.
- C. Fellay, N. Yan, P. J. Dyson and G. Laurenczy, Chemistry, 2009, 15, 3752 CrossRef CAS PubMed
.
- J. N. Chheda, Y. Román-Leshkov and J. A. Dumesic, Green Chem., 2007, 9, 342 RSC
.
- Y. Yang, C. Hu and M. M. Abu-Omar, J. Mol. Catal. A: Chem., 2013, 376, 98 CrossRef CAS
.
- B. Cinlar, T. Wang and B. H. Shanks, Appl. Catal., A, 2013, 450, 237 CrossRef CAS
.
- N. S. Mosier, C. M. Ladisch and M. R. Ladisch, Biotechnol. Bioeng., 2002, 79, 610 CrossRef CAS PubMed
.
- J. Shen and C. E. Wyman, AIChE J., 2012, 58, 1 CrossRef
.
- R. Weingarten, G. A. Tompsett, W. C. Conner and G. W. Huber, J. Catal., 2011, 279, 174 CrossRef CAS
.
- T. Wang, Y. J. Pagán-Torres, E. J. Combs, J. A. Dumesic and B. H. Shanks, Top. Catal., 2012, 55, 657 CrossRef CAS
.
- Y. Román-Leshkov and J. A. Dumesic, Top. Catal., 2009, 52, 297 CrossRef
.
-
B. Binder and R. T. Raines, U.S. Patent, 8324376B2, 2012 Search PubMed
.
-
J. A. Dumesic, Y. Roman-Leshkov and J. N. Chheda, International Patent, WO 2007/146636A1, 2007 Search PubMed
.
- M. Brasholz, K. von Känel, C. H. Hornung, S. Saubern and J. Tsanaktsidis, Green Chem., 2011, 13, 1114 RSC
.
- S. De, S. Dutta and B. Saha, Green Chem., 2011, 13, 2859 RSC
.
- Y. J. Pagán-Torres, T. Wang, J. M. R. Gallo, B. H. Shanks and J. A. Dumesic, ACS Catal., 2012, 2, 930 CrossRef
.
- H. Xiong, T. Wang, B. H. Shanks and A. K. Datye, Catal. Lett., 2013, 143, 509 CrossRef CAS
.
- V. V. Ordomsky, J. van der Schaaf, J. C. Schouten and T. A. Nijhuis, J. Catal., 2012, 287, 68 CrossRef CAS
.
-
W. A. Farone and J. E. Cuzens, U.S. Patent, 6054611A, 2000 Search PubMed
.
-
W. A. Farone and J. E. Cuzens, U.S. Patent, 5892107A, 1999 Search PubMed
.
- A. Yamaguchi, N. Hiyoshi, O. Sato, K. K. Bando, Y. Masuda and M. Shirai, J. Chem. Eng. Data, 2009, 54, 2666 CrossRef CAS
.
-
C. B. Bohn, Ph.D. Dissertation, Purdue University, 2014
.
Footnote |
| † Electronic supplementary information (ESI) available. See DOI: 10.1039/c5qo00194c |
| This journal is © the Partner Organisations 2015 |

