Facile preparation, high microwave absorption and microwave absorbing mechanism of RGO–Fe3O4 composites†
Meng Zong, Ying Huang*, Yang Zhao, Xu Sun, Chunhao Qu, Didi Luo and Jiangbo Zheng
Department of Applied Chemistry, The Key Laboratory of Space Applied Physics and Chemistry, Ministry of Education, School of Science, Northwestern Polytechnical University, Xi'an 710072, PR China. E-mail: nwpu_zongmeng@163.com; yingh@nwpu.edu.cn; Tel: +86 29 88431636
First published on 9th September 2013
Abstract
Reduced graphene oxide (RGO)–Fe3O4 composites with obviously enhanced microwave absorption properties were successfully fabricated by a rational one-pot simplified co-precipitation route, which avoided the usage of an inert gas and any additional chemical agents (such as surfactants and stabilizers). Given these advantages, the strategy described in this study can be developed as a simple and large-scale route to yield RGO–Fe3O4 composites. The morphology, structure, thermal stability, magnetic and microwave electromagnetic properties of the as-prepared composites were characterized by XRD, XPS, TEM, FT-IR, Raman, TG and VSM. These composites exhibit excellent microwave absorption properties, which are attributed to effective complementarities between the dielectric loss and the magnetic loss. The microwave absorption mechanism of the RGO–Fe3O4 composites was studied in detail. For the RGO–Fe3O4-3 composite, the maximum RL reaches −44.6 dB at 6.6 GHz with a thickness of 3.9 mm, and the bandwidth of RL less than −10 dB can reach up to 4.3 GHz (from 12.2 to 16.5 GHz) with a thickness of 2.0 mm. Moreover, the microwave absorption properties can be tuned easily by varying the (RGO)/(Fe3O4) ratio and layer thickness of the samples. It is believed that such composites will find wide applications in the microwave absorbing area.
1. Introduction
With the development of electronic technology, electromagnetic (EM) interference has become a pollution problem, not only influencing the operation of electronic devices, but also being harmful to the health of human beings.1,2 Microwave absorbing materials have attracted much attention owing to these expanding EM interference problems.3–5 They can absorb microwaves effectively and convert EM energy into thermal energy or dissipate microwaves by interference. Microwave absorbing materials are now required to have strong absorption characteristics, wide absorption frequencies, be lightweight and have antioxidation properties.4 There are a number of microwave absorbing materials such as ferrites, carbonyl iron, conducting polymers and carbon-based materials etc.6–9 However, the traditional microwave absorbing materials cannot meet all of the requirements such as to be strong, wide, lightweight and thin at the same time. Hence, extensive studies have been made to develop novel microwave absorbing materials with high absorption and wide absorption frequencies.Graphene, a novel carbon nanomaterial consisting of one-atom-thick, hexagonally arranged carbon atoms, has attracted extensive attention owing to its superior electronic, thermal and mechanical properties as well as its chemical stability.10,11 Due to its special surface properties and layered structure, graphene has become a potential nanoscale building block for new hybrid materials.12 Recent research shows that inorganic nanoparticles, such as Au, Ag, Fe3O4 and Co3O4, etc., could be attached to graphene or graphene oxide (GO) to form hybrid materials, which have potential applications in surface enhanced Raman scattering (SERS), lithium ion batteries, hydrogen storage, microwave absorption and as a magnetic resonance imaging (MRI) contrast agent, etc.13–16
As a class of promising microwave absorbing materials, carbon-based materials exhibited several exceptional properties including being lightweight, having wide absorption frequency, high thermal stability, and high chemical stability.1 In previous research, Zhan and co-workers17,18 did some work on the synthesis of the heterojunction of Fe3O4 with carbon nanotubes (CNTs) or graphene, revealing that hybrid materials can reinforce the original properties and extend the applications of simplex materials. In comparison with CNTs, graphene possesses similar physical properties but has larger surface areas, a lower price and more stable properties. Furthermore, more effective absorption could be obtained by platelet-shaped materials than by the rod-shaped and sphere-shaped ones in microwave absorption applications.17 Therefore, graphene is highly expected to be the alternative to CNTs in microwave absorbing materials.
As is known, Fe3O4 has an inverse spinel structure, in which half of the Fe3+ cations occupy tetrahedral (A) sites, while all of the Fe2+ cations and the other half of the Fe3+ cations occupy octahedral (B) sites, resulting in the structural formula of Fe3+AFe3+Fe2+BO4.19 It is an important magnetic material and has physical and chemical properties such as superparamagnetism, half-metallic character and strong spin polarization at room temperature in addition to its low toxicity and high biocompatibility. Moreover, its magnetic properties can be tuned by size, shape, and dimension.4 Thus, Fe3O4 has wide applications in many areas such as gas sensors, magnetic storage media, optoelectronic and spintronic devices, biomedicine, as well as materials for microwave absorbing and shielding research.4,20–22 However, its heavy weight restrain it from being widely used in the field of electromagnetic wave absorption.23 Furthermore, its microwave absorption properties are usually subject to the degradation caused by the eddy current in the high-frequency region.4
Herein, the reduced graphene oxide (RGO) coated with Fe3O4 nanoparticles (NPs) was synthesized through a facile one-pot simplified co-precipitation method, which avoided the usage of an inert gas or any additional surfactants or stabilizers. The strategy described in this study can be developed as a simple and large-scale route to yield RGO–Fe3O4 composites. The crystalline structure, morphology, thermal stability, magnetic properties and microwave electromagnetic properties of the as-prepared composites were investigated. The mechanism of the enhanced reflection loss for the RGO–Fe3O4 composites will also be explained comprehensively.
2. Experimental method
2.1 Preparation of RGO–Fe3O4 composites
GO was prepared by Hummers' method as reported in ref. 24. The composites of RGO–Fe3O4 were prepared by a one-pot simplified co-precipitation route. In a typical procedure, 100 mg GO was dispersed in 150 mL of deionized water and ultrasonicated for 2 h. 88 mg FeCl3·6H2O and 65 mg FeCl2·4H2O (Fe3+ and Fe2+ with a mole ratio of 1![[thin space (1/6-em)]](https://www.rsc.org/images/entities/char_2009.gif) :
:![[thin space (1/6-em)]](https://www.rsc.org/images/entities/char_2009.gif) 1) were dispersed in 50 mL deionized water and were then added to the suspension of GO. 1 M NaOH aqueous solution was added to the suspension until the pH = 11, and the mixture was stirred for 2 h at 80 °C without protection of an inert gas. Subsequently, a freshly prepared NaBH4 aqueous solution (NaBH4 and GO with a mass ratio of 6
1) were dispersed in 50 mL deionized water and were then added to the suspension of GO. 1 M NaOH aqueous solution was added to the suspension until the pH = 11, and the mixture was stirred for 2 h at 80 °C without protection of an inert gas. Subsequently, a freshly prepared NaBH4 aqueous solution (NaBH4 and GO with a mass ratio of 6![[thin space (1/6-em)]](https://www.rsc.org/images/entities/char_2009.gif) :
:![[thin space (1/6-em)]](https://www.rsc.org/images/entities/char_2009.gif) 1) was added dropwise with stirring and the mixture was stirred again for 1 h at 80 °C to ensure complete reduction of GO. The black products were washed several times with deionized water and ethanol, then dried at 60 °C under vacuum and denoted as RGO–Fe3O4-1. With different weights of GO (50 mg, 25 mg, 0 mg) being added to the reaction system, the final samples were labeled as RGO–Fe3O4-2, RGO–Fe3O4-3, and Fe3O4, respectively. For comparison purposes, RGO was also prepared in similar procedures in the absence of Fe3+, Fe2+ and NaOH.
1) was added dropwise with stirring and the mixture was stirred again for 1 h at 80 °C to ensure complete reduction of GO. The black products were washed several times with deionized water and ethanol, then dried at 60 °C under vacuum and denoted as RGO–Fe3O4-1. With different weights of GO (50 mg, 25 mg, 0 mg) being added to the reaction system, the final samples were labeled as RGO–Fe3O4-2, RGO–Fe3O4-3, and Fe3O4, respectively. For comparison purposes, RGO was also prepared in similar procedures in the absence of Fe3+, Fe2+ and NaOH.2.2 Characterization
The crystal structure was determined by X-ray diffraction (XRD, Rigaku, model D/max-2500 system at 40 kV and 100 mA of Cu Kα). XPS analysis was characterized by an X-ray photoelectron spectrometer (K-Alpha; Thermo Fisher Scientific (SID-Elemental), New York, USA). The morphology and the size of the synthesized samples were characterized by transmission electron microscopy (TEM, Tecnai F30 G2, FEI, USA). The Fourier transform infrared spectroscopy (FT-IR) spectra of the composites were obtained by using a Model NIcolETiS10 Fourier transform spectrometer (Thermo SCIENTIFIC Co., USA) with a 2 cm−1 resolution in the range of 4000–400 cm−1. The Raman spectra of the composites were obtained by using an in Via Laser Raman spectrometer (Renishaw Co., England) with 514 nm radiation. The thermal stabilities of the composites were analyzed by using thermogravimetric analysis (TGA, Model Q50, TA, USA) from room temperature to 800 °C in an air atmosphere, with a heating rate of 20 °C min−1. The magnetic properties were measured by a vibrating sample magnetometer (VSM, Riken Denshi, BHV-525) at room temperature. Electromagnetic (EM) parameters were measured by a vector network analyzer (NA, HP8720ES) in the range of 2–18 GHz, in which the synthesized powders were pressed to be toroidal samples (outer diameter: 7 mm, inner diameter: 3.04 mm, and thickness: 3 mm) according to the mass ratio 1![[thin space (1/6-em)]](https://www.rsc.org/images/entities/char_2009.gif) :
:![[thin space (1/6-em)]](https://www.rsc.org/images/entities/char_2009.gif) 1 of paraffin to RGO–Fe3O4 composite.
1 of paraffin to RGO–Fe3O4 composite.3. Results and discussions
The formation of the RGO, Fe3O4 NPs and RGO–Fe3O4 composites is described in Fig. S1 (please refer to ESI†). The graphite was treated with H2SO4 and KMnO4 and GO was obtained which contained a variety of functional groups including –COOH, –OH, epoxy and ketone.17,25 Co-precipitation is a common method to synthesize RGO–Fe3O4 composites. This method always uses an inert gas (such as N2 or Ar) to prevent the oxidation of Fe2+ by O2 when Fe2+![[thin space (1/6-em)]](https://www.rsc.org/images/entities/char_2009.gif) :
:![[thin space (1/6-em)]](https://www.rsc.org/images/entities/char_2009.gif) Fe3+ is 1
Fe3+ is 1![[thin space (1/6-em)]](https://www.rsc.org/images/entities/char_2009.gif) :
:![[thin space (1/6-em)]](https://www.rsc.org/images/entities/char_2009.gif) 2.25 In order to avoid the usage of an inert gas, we increased the ratio of the Fe2+. In our work, Fe3+ and Fe2+ were dispersed in a suspension of GO with a molar ratio of 1
2.25 In order to avoid the usage of an inert gas, we increased the ratio of the Fe2+. In our work, Fe3+ and Fe2+ were dispersed in a suspension of GO with a molar ratio of 1![[thin space (1/6-em)]](https://www.rsc.org/images/entities/char_2009.gif) :
:![[thin space (1/6-em)]](https://www.rsc.org/images/entities/char_2009.gif) 1 and adsorbed onto the surface of the GO by an electrostatic attraction. Part of the Fe2+ cations were oxidized by O2 and GO.26 Then the iron ions were transformed into Fe3O4 NPs on the surface of the GO by addition of NaOH at elevated temperatures. Therefore, there may be a C–O–Fe bond between the RGO and Fe3O4 (Fig. S2†). Finally the GO–Fe3O4 was reduced to RGO–Fe3O4 composites by NaBH4. The overall reaction can be described by the following equations:
1 and adsorbed onto the surface of the GO by an electrostatic attraction. Part of the Fe2+ cations were oxidized by O2 and GO.26 Then the iron ions were transformed into Fe3O4 NPs on the surface of the GO by addition of NaOH at elevated temperatures. Therefore, there may be a C–O–Fe bond between the RGO and Fe3O4 (Fig. S2†). Finally the GO–Fe3O4 was reduced to RGO–Fe3O4 composites by NaBH4. The overall reaction can be described by the following equations: | (1) |
 | (2) |
 | (3) |
The morphologies and structures of the RGO and RGO–Fe3O4 composites were investigated by transmission electron microscopy (TEM), which is shown in Fig. 1 and S1.†Fig. 1a and the inset in Fig. 1a show the low and high magnification TEM image of RGO, respectively, and we can see that the RGO nanosheets are less than 3 nm thick. The RGO sheets from the reduction by NaBH4 of GO are transparent thin films (Fig. S1b†), and comparing with GO (Fig. S1a†), the RGO sheets have a crumpled and rippled structure which is due to deformation during the exfoliation and restacking process. Fig. 1b–d and S1c–e† show the low magnification TEM images of the obtained RGO–Fe3O4 composites with different (RGO)/(Fe3O4) ratios. It is clear that the RGO nanosheets are well loaded by Fe3O4 NPs, and the diameters of the Fe3O4 NPs are 15–25 nm. The mass ratio of (RGO)/(Fe3O4) has an important effect on the loading density of the Fe3O4 NPs on the RGO sheets. As shown in Fig. 1b–d, the densities of the Fe3O4 NPs increase gradually with the decrease of the GO amount used. This result is due to the fact that less GO will take up comparatively more Fe3+ ions to nucleate, thus leading to the increase in density of Fe3O4 NPs. Therefore, the amount of GO can effectively tune the density of the Fe3O4 NPs.23 Moreover, almost no Fe3O4 NPs are found outside of the RGO nanosheets, indicating that the simplified co-precipitation synthesis of RGO–Fe3O4 composites has a high efficiency. The HRTEM image shown in Fig. 1e also reveals the crystalline structure of the Fe3O4 NPs, and the lattice fringes with interplanar distances of 0.258 nm can be assigned to the (311) planes of the cubic spinel crystal Fe3O4. The selected-area electron diffraction pattern (SAED) (Fig. 1f) clearly shows a ring pattern arising from the cubic spinel crystal Fe3O4, further confirming the crystalline nature of the Fe3O4 NPs.27
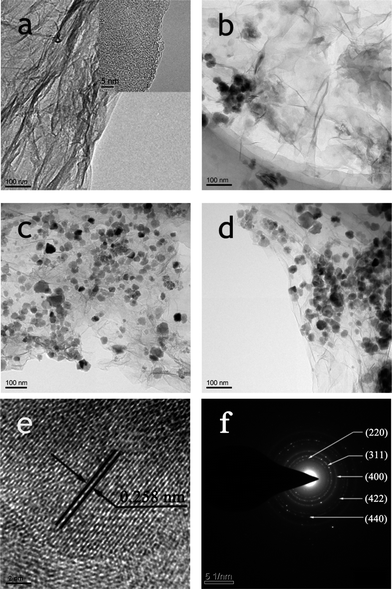 | ||
| Fig. 1 TEM images of RGO (a), RGO–Fe3O4-1 composite (b), RGO–Fe3O4-2 composite (c), RGO–Fe3O4-3 composite (d); HRTEM image (e) and SAED pattern (f) of RGO–Fe3O4-2 composite. | ||
Powder X-ray diffraction (XRD) measurements were utilized to investigate the phase composition and the crystalline structure of the synthesized samples. As shown in Fig. 2a, the XRD pattern of GO shows a sharp peak at 2θ = 11.1°, corresponding to the (001) reflection of GO. The diffraction peak of the as-prepared RGO (Fig. 2b) at 25.6° could be attributed to the graphitic structure (002) of the short-range order in stacked graphene sheets.28 After surface decoration (Fig. 2c–e), six new peaks are observed, which are very similar to that of the pure Fe3O4 NPs (Fig. 2f), and could be indexed as the characteristic (220), (311), (400), (422), (511) and (440) reflections of the pure cubic spinel crystal structure of Fe3O4 (JCPDS no. 19-0629).29 It can be seen that except for the peaks assigned to Fe3O4, no other diffraction peaks resulting from GO or graphene can be found, which indicates that the GO is effectively reduced into graphene and the self-restacking of the as-reduced graphene sheets is effectively prevented.13 In fact, a similar result is also obtained and reported in ref. 16, 23 and 30. No peaks corresponding to impurities are detected, therefore a RGO–Fe3O4 heterostructure has been formed via a simplified co-precipitation method.
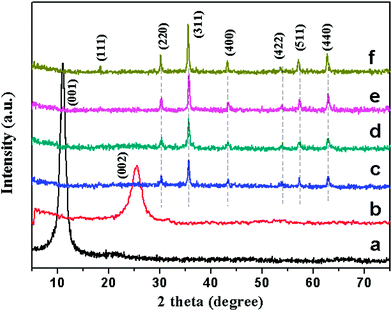 | ||
| Fig. 2 XRD patterns of GO (a), RGO (b), RGO–Fe3O4-1 composite (c), RGO–Fe3O4-2 composite (d), RGO–Fe3O4-3 composite (e) and Fe3O4 NPs (f). | ||
The XRD patterns of magnetite Fe3O4 (JCPDS no. 19-0629) and maghemite γ-Fe2O3 (JCPDS no. 39-1346) are highly similar, so X-ray photoelectron spectroscopy (XPS) measurements have to be consulted to unambiguously assign the crystal phase because XPS is very sensitive to Fe2+ and Fe3+ cations.23,31 Since we have adopted the same synthesis process for all composites, XPS was recorded only for Fe3O4–RGO-1 as a representative and compared with that of GO.
Fig. 3a shows the wide scan spectrum of GO and the RGO–Fe3O4-1 composite. The bands observed in the wide scan XPS spectrum of RGO–Fe3O4-1 confirm the presence of C 1s, O 1s, and Fe 2p. The observed O 1s peak in GO at 533.1 eV is shifted to a lower binding energy (531.4 eV) due to the attachment of the Fe3O4 NPs in the Fe3O4–RGO composites.16 As shown in Fig. 3b, the peaks located at 712.9 eV and 725.3 eV correspond to Fe 2p3/2 and Fe 2p1/2, respectively,32 and there are no satellites for γ-Fe2O3 identified, excluding the presence of γ-Fe2O3 in the Fe3O4 samples,31 which confirms that the oxide in the sample is magnetite Fe3O4. The C 1s spectrum of GO (Fig. 3c) and the Fe3O4–RGO-1 composite (Fig. 3d) consist of four main components, arising from C![[double bond, length as m-dash]](https://www.rsc.org/images/entities/char_e001.gif) C/C–C (284.6 eV) in the aromatic rings, C–O (286.4 eV) of epoxy and alkoxy, C
C/C–C (284.6 eV) in the aromatic rings, C–O (286.4 eV) of epoxy and alkoxy, C![[double bond, length as m-dash]](https://www.rsc.org/images/entities/char_e001.gif) O (287.8 eV) and O–C
O (287.8 eV) and O–C![[double bond, length as m-dash]](https://www.rsc.org/images/entities/char_e001.gif) O (289.3 eV) groups.33 After reduction, it is clear that the C/O ratio in the RGO–Fe3O4-1 composite increases remarkably compared with that of GO, and that most of the epoxide and hydroxyl functional groups are successfully removed, as shown in Fig. 3a, c and d. Such a higher O/C ratio of the RGO–Fe3O4-1 composite implies good electronic conductivity, which may enable the GO sheets to serve as conductive channels between the Fe3O4 NPs, and is favorable for microwave absorbing.
O (289.3 eV) groups.33 After reduction, it is clear that the C/O ratio in the RGO–Fe3O4-1 composite increases remarkably compared with that of GO, and that most of the epoxide and hydroxyl functional groups are successfully removed, as shown in Fig. 3a, c and d. Such a higher O/C ratio of the RGO–Fe3O4-1 composite implies good electronic conductivity, which may enable the GO sheets to serve as conductive channels between the Fe3O4 NPs, and is favorable for microwave absorbing.
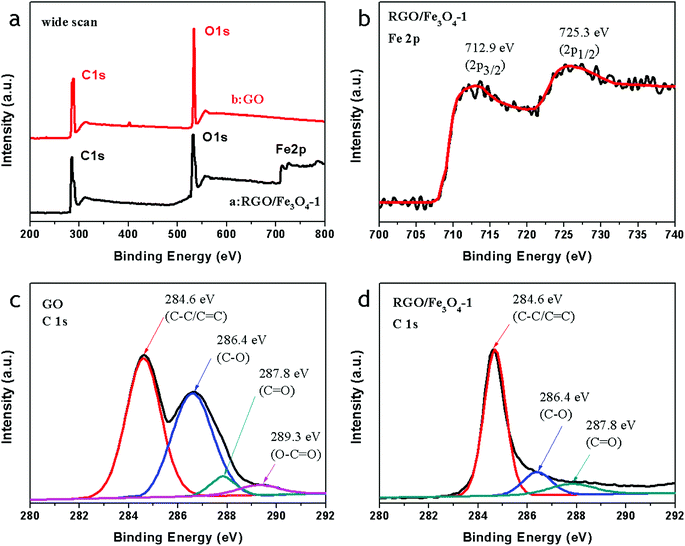 | ||
| Fig. 3 X-ray photoelectron spectroscopy (XPS) spectra: wide scan (a), Fe 2p spectrum of the RGO–Fe3O4-1 composite (b), C 1s spectrum of RGO (c), and C 1s spectrum of the RGO–Fe3O4-1 composite (d). | ||
Fourier transform infrared spectroscopy (FT-IR) was used to indicate the degree of removal of the oxygen-containing functional groups. Fig. 4 shows the FT-IR transmittance spectra of GO (a), the RGO–Fe3O4-3 composite (b), and RGO (c). The spectra are shifted downward for easy viewing. The observed representative peaks in GO confirm the presence of the oxygen-containing functional groups in the carbon frameworks, which include bands at ∼1057 cm−1 (C–O stretching vibration), ∼1220 cm−1 (C–O stretching vibration of epoxide), ∼1415 cm−1 (O–H stretching vibration of carboxyl), ∼1703 cm−1 (C![[double bond, length as m-dash]](https://www.rsc.org/images/entities/char_e001.gif) O stretching of carbonyl and carboxyl groups at edges of the GO networks), while the band at ∼3420 cm−1 could be due to the O–H stretching mode of intercalated water.27,34–37 The band at ∼1623 cm−1 is assigned to skeletal vibrations of the unoxidized graphitic domains.16,27 All the absorption bands related to the oxygen-containing functional groups almost vanish in the RGO–Fe3O4-3 composite (Fig. 4b) and RGO (Fig. 4c), revealing that these oxygen-containing functional groups are removed in the presence of NaBH4, and accordingly the GO is reduced into graphene. The band at ca. 1560 cm−1 in Fig. 4b and c could be ascribed to the formation of –COO− after coating with the Fe3O4 NPs.16 Moreover, an additional peak at ca. 549 cm−1 in Fig. 4c can be ascribed to the lattice absorption of Fe3O4, further confirming the existence of Fe3O4 NPs.27
O stretching of carbonyl and carboxyl groups at edges of the GO networks), while the band at ∼3420 cm−1 could be due to the O–H stretching mode of intercalated water.27,34–37 The band at ∼1623 cm−1 is assigned to skeletal vibrations of the unoxidized graphitic domains.16,27 All the absorption bands related to the oxygen-containing functional groups almost vanish in the RGO–Fe3O4-3 composite (Fig. 4b) and RGO (Fig. 4c), revealing that these oxygen-containing functional groups are removed in the presence of NaBH4, and accordingly the GO is reduced into graphene. The band at ca. 1560 cm−1 in Fig. 4b and c could be ascribed to the formation of –COO− after coating with the Fe3O4 NPs.16 Moreover, an additional peak at ca. 549 cm−1 in Fig. 4c can be ascribed to the lattice absorption of Fe3O4, further confirming the existence of Fe3O4 NPs.27
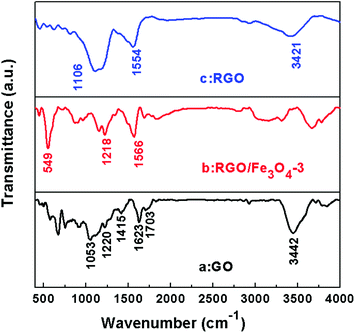 | ||
| Fig. 4 FT-IR spectra of GO (a), the RGO–Fe3O4-3 composite (b) and RGO (c). | ||
Raman spectroscopy is a powerful nondestructive tool to distinguish ordered and disordered crystal structures of carbon.34Fig. 5 shows the Raman spectra of GO, RGO and the RGO–Fe3O4 composites. For the GO, graphene and graphene composites, there are always two peaks appearing at about 1340 cm−1 and 1590 cm−1, which are known as the D-band and G-band.38 The D band is a first-order zone boundary phonon mode associated with defects in the graphene or graphene edge, while the G band is a radial C–C stretching mode of sp2 bonded carbon.34,39 A weak D band indicates a low density of defects and the intensity ratio of D band to G band (ID/IG) reflects the degree of the defects in the graphene or the edges.39 Compared with GO, the ratio of intensities (ID/IG) for the RGO–Fe3O4 composites shows a remarkable increase, and the G band of the RGO–Fe3O4 composites becomes weaker and broader, suggesting a higher degree of defects in the graphene or the edges due to the reduction of NaBH4 and introduction of the Fe3O4 NPs.40 The defects play an important role in microwave absorbing,41 and will further the interpretation of the microwave absorbing mechanism.
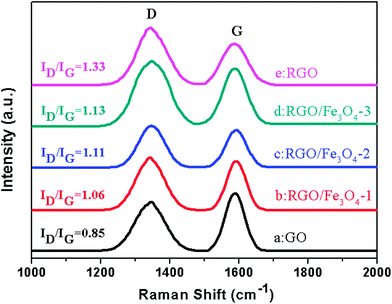 | ||
| Fig. 5 Raman spectra for GO, RGO and RGO–Fe3O4 composites. | ||
We have also examined the thermal stability of the prepared GO, RGO and RGO–Fe3O4 composites using thermogravimetry analysis (TGA). Thermal stability is an important material property of microwave absorption materials. Fig. 6 shows the TG analysis of GO, RGO and the RGO–Fe3O4 composites in an air atmosphere at a heating rate of 20 °C min−1.
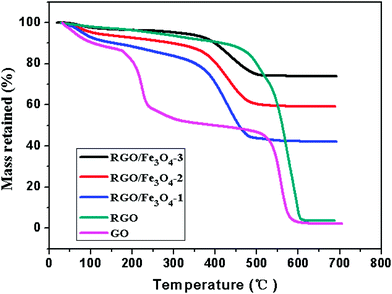 | ||
| Fig. 6 TG curves of GO, RGO and RGO–Fe3O4 composites in air atmosphere. | ||
As shown in Fig. 6, the GO exhibits about 10 wt% loss below 100 °C and more than 41 wt% loss at 240 °C, resulting from the removal of the labile oxygen-containing functional groups such as CO, CO2, and H2O.37,42 It shows a 5 wt% loss in an air atmosphere at 240 °C for the RGO, which is much lower than that of the GO, indicating a decreased amount of oxygenated functional groups. A significant drop in mass of RGO around 600 °C is due to the bulk pyrolysis of the carbon skeleton, which is similar to the drop in mass of GO around 550 °C. Thus, from the above analysis, the removal of the thermally labile oxygen functional groups by chemical reduction increased the thermal stability of graphene.37
From the TG curves, we can see that the RGO–Fe3O4 composites display three weight loss processes.30 The slight mass loss below 100 °C is attributed to the evaporation of absorbed water. Then, a gradual weight loss occurs from 100 °C to 350 °C, which can be assigned to the removal of the labile oxygen-containing functional groups and H2O vapor from the sample caused by the destruction of oxygenated functional groups. Next a significant weight loss occurs between 350 °C and 510 °C, indicating the oxidation and decomposition of graphene in air, leaving the final product as Fe2O3.30 The skeleton of the graphene in the RGO–Fe3O4 composites decomposes at a lower temperature (350–510 °C) compared to that of the RGO (480–620 °C), which might be caused by the reaction of the skeleton carbon atoms and the iron oxide nanoparticles.43
The field dependence of magnetization for the Fe3O4 NPs and RGO–Fe3O4 composites was measured by a vibrating sample magnetometer (VSM) at room temperature, as shown in Fig. 7. The magnetic parameters corresponding to Fig. 7 are also shown in Table 1, including the saturation magnetization (Ms), coercivity (Hc), and remnant magnetization (Mr). It clearly shows that the Ms and Mr of the composites are increased while the Hc decreases with the increase of the Fe3O4 loading amount. The magnetization hysteresis loops of the Fe3O4 NPs and RGO–Fe3O4 composites are S-like, which is typical of a superparamagnetic material because of their high Ms and Mr, and low Hc,30 implying that there is no remaining magnetization when the applied magnetic field is removed.44 The superparamagnetic properties of the composites further confirm that the oxide in the present investigation is Fe3O4 rather than γ-Fe2O3 and is supported by the XPS spectra for Fe 2p.38 These composites could be separated from their dispersion within 15 seconds by holding the samples close to a magnet as shown in Fig. S3,† indicating that it is possible to manipulate these composites by an external magnetic field. Additionally, the Ms value of all the RGO–Fe3O4 composites is lower than that of the pure bulk Fe3O4, which can be attributed to the nanoscale size of the Fe3O4 NPs and the presence of RGO.23,44
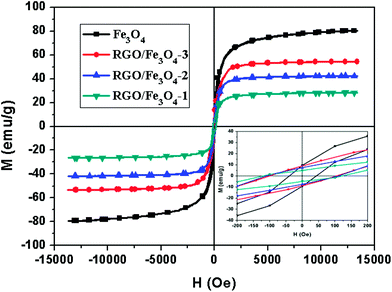 | ||
| Fig. 7 Magnetization curves of Fe3O4 NPs and RGO–Fe3O4 composites at room temperature. Inset: the expanded low field magnetization curves. | ||
| Sample | Ms (emu g−1) | Hc (Oe) | Mr (emu g−1) |
|---|---|---|---|
| RGO–Fe3O4-1 | 27.6 | 114.9 | 4.8 |
| RGO–Fe3O4-2 | 42.4 | 108.9 | 7.4 |
| RGO–Fe3O4-3 | 54.3 | 103.5 | 9.0 |
| Fe3O4 | 80.2 | 42.9 | 9.5 |
The electromagnetic parameters (relative complex permittivity, εr = ε′ − jε′′, and relative complex permeability, μr = μ′ − jμ′′) of the wax composites containing 50 wt% of the samples were measured at room temperature for the investigation of microwave absorption properties of the Fe3O4 NPs and RGO–Fe3O4 composites, and are shown in Fig. 8a–d. The real permittivity (ε′) and real permeability (μ′) symbolize the storage ability of electric and magnetic energy, while the imaginary permittivity (ε′′) and imaginary permeability (μ′′) are related to the dissipation of electric and magnetic energy.20
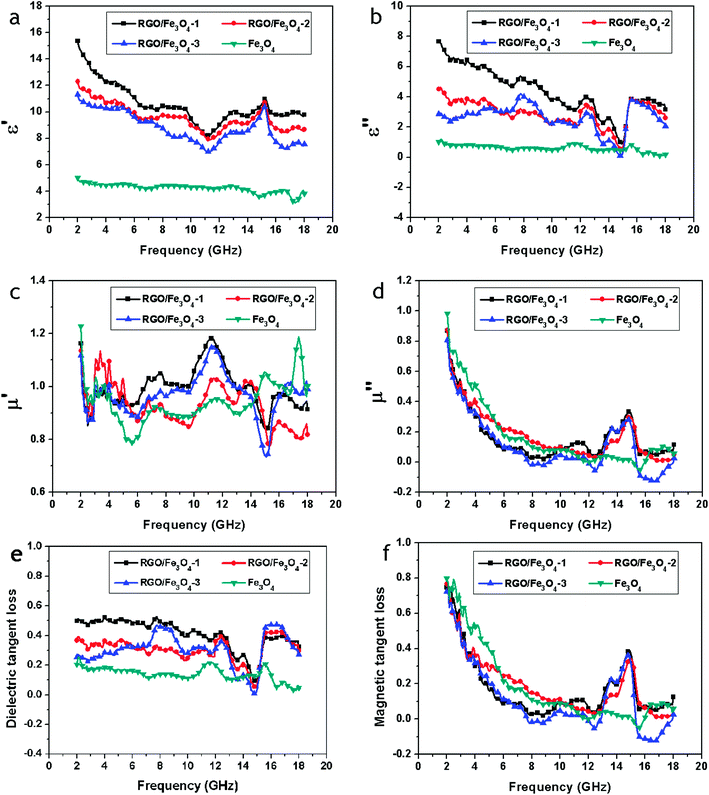 | ||
| Fig. 8 Frequency dependence on real parts (a) and imaginary parts (b) of the complex permittivity, real parts (c) and imaginary parts (d) of the complex permeability, and the corresponding dielectric loss tangents (e) and magnetic loss tangents (f) of Fe3O4 and RGO–Fe3O4 composites. | ||
As shown in Fig. 8a, for the RGO–Fe3O4-1 composite, RGO–Fe3O4-2 composite and RGO–Fe3O4-3 composite, the values of ε′ are in the range of 15.37–8.22, 12.30–7.89, and 11.30–7.89, respectively, in the frequency of 2–18 GHz, and are higher than the pure Fe3O4 NPs (in the range of 5.04–3.13). Meanwhile, for the RGO–Fe3O4-1 composite, RGO–Fe3O4-2 composite and RGO–Fe3O4-3 composite, the values of ε′′ are in the range of 7.67–0.88, 4.61–0.49, and 4.20–0.09, respectively, and are also higher than the pure Fe3O4 NPs (in the range of 1.21–0.10), as presented in Fig. 8b. It is observed that the samples with higher (RGO)/(Fe3O4) ratios show higher values of ε′ and ε′′, which is related to higher conductivities. This is because more RGO sheets increase the electric polarization and electric conductivity, since εr is an expression of the polarizability of a material, which consists of dipolar polarization and electric polarization at microwave frequencies.1
From Fig. 8c, for the RGO–Fe3O4-1 composite, RGO–Fe3O4-2 composite and RGO–Fe3O4-3 composite, we can see that the values of μ′ are in the range of 1.18–0.83, 1.13–0.77, and 1.15–0.73, respectively, and thus have a very serious fluctuation in the 2–18 GHz frequency range. In addition, the values of μ′′ for the RGO–Fe3O4-1 composite, RGO–Fe3O4-2 composite and RGO–Fe3O4-3 composite, as presented in Fig. 8d, are in the range of 0.87–0.03, 0.87–0.01, and 0.80 to (−0.13) in the frequency of 2–18 GHz, which are almost equal to the pure Fe3O4 NPs. Meanwhile, the μ′′ for the RGO–Fe3O4 composites exhibits a broad resonance peak at 12.4–15.6 GHz with a maximum value at 14.8 GHz.
We have also calculated both the dielectric tangent loss (tan![[thin space (1/6-em)]](https://www.rsc.org/images/entities/char_2009.gif) δE = ε′′/ε′) and the magnetic tangent loss (tan
δE = ε′′/ε′) and the magnetic tangent loss (tan![[thin space (1/6-em)]](https://www.rsc.org/images/entities/char_2009.gif) δM = μ′′/μ′) of the Fe3O4 NPs and RGO–Fe3O4 composites based on the permeability and permittivity of samples measured as above, shown in Fig. 8e and f. The values of tan
δM = μ′′/μ′) of the Fe3O4 NPs and RGO–Fe3O4 composites based on the permeability and permittivity of samples measured as above, shown in Fig. 8e and f. The values of tan![[thin space (1/6-em)]](https://www.rsc.org/images/entities/char_2009.gif) δE are mostly larger than 0.2 between 2 to 18 GHz, indicating that the dielectric loss occurs over the whole frequency range. These results suggest the RGO–Fe3O4 composites have distinct dielectric loss properties.
δE are mostly larger than 0.2 between 2 to 18 GHz, indicating that the dielectric loss occurs over the whole frequency range. These results suggest the RGO–Fe3O4 composites have distinct dielectric loss properties.
So far, there is no evidence to support the C–O–Fe bond affect on the microwave absorption properties. But the introduction of Fe3O4 NPs significantly enhanced the microwave absorption performance of the composites. In terms of electromagnetic theory, the dielectric loss of the RGO–Fe3O4 composites may be attributed to natural resonance, Debye dipolar relaxation, electron polarization relaxation and the unique layered nanostructures etc.1,5,45 First, the presence of the Fe3O4 NPs and residual defects and groups in RGO (discussed in the Raman analysis) does not significantly alter the graphene lamellar structure, but they can act as polarized centers, which are in favor of the electromagnetic energy absorption.1 Second, the huge aspect ratio, layered structure and high conductivity of the RGO sheets are another reason why the RGO–Fe3O4 composites exhibit better absorbing abilities.1 Thirdly, there are dipoles present in Fe3O4 especially when their sizes are at the nanoscale. The number of surface atoms with unsaturated bonds greatly increases as the size decreases, causing an increase of the dipoles. Consequently, the dipole polarizations can contribute to the dielectric loss.4 If we just make a mixture of GO with Fe3O4 followed by a reduction, the Fe3O4 NPs will conglomerate, then the dipole polarization will weaken. Moreover, the interfaces between the RGO lamella and Fe3O4 NPs are clearly observed, as shown in Fig. 1. The interfacial polarization and the associated relaxation contribute to the dielectric loss.1 This is another reason why the RGO–Fe3O4 composites have stronger EM absorption than Fe3O4 NPs. Furthermore, according to the free electron theory, ε′′ = 1/2ε0πρf, where ε0 is the permittivity of a vacuum, ρ is the resistivity, f is the frequency of the microwave.30,46,47 The conductivity of graphene is high and a conducting network is formed, which enables a reduction in resistivity ρ of the composites and the ε′′ becomes higher with the increasing content of graphene.30 The resistivity of the nanocomposite will decrease due to the increase of the (RGO)/(Fe3O4) ratios and results in an increase in dielectric loss.46 In addition, such higher dielectric loss is also related to electron hopping between Fe2+ and Fe3+ ions in the B sites as the EM wave field is applied, which has been reported previously.4,46
We adopt the Debye dielectric relaxation model (Cole–Cole model) to further interpret the mechanisms of the permittivity dispersion. According to its expression, the relative complex permittivity can be expressed by the following equation,1,5,47
 | (4) |
 | (5) |
 | (6) |
According to eqn (2) and (3), the relationship between ε′ and ε′′ can be deduced,
 | (7) |
Thus, the plot of ε′ versus ε′′ would be a single semicircle, generally denoted as the Cole–Cole semicircle. Each semicircle corresponds to one Debye relaxation process. Fig. 9a–c show the ε′–ε′′ curves of the RGO–Fe3O4 composites.
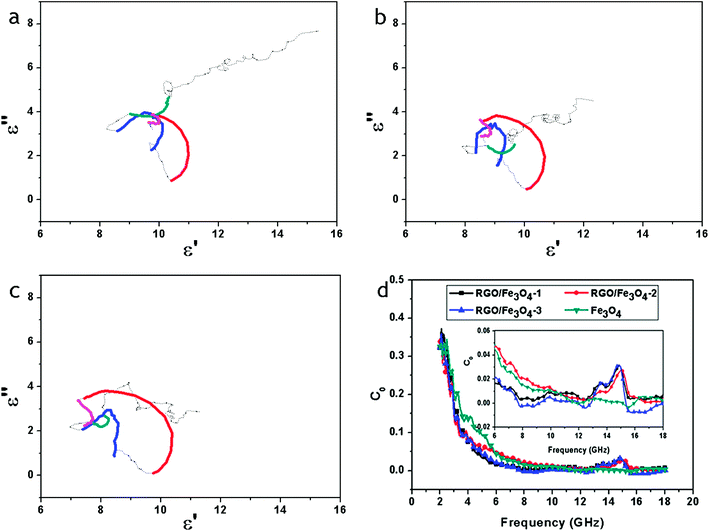 | ||
| Fig. 9 ε′–ε′′ curves of RGO–Fe3O4-1 composite (a), RGO–Fe3O4-2 composite (b) and RGO–Fe3O4-3 composite (c); C0–f curves of Fe3O4 NPs and RGO–Fe3O4 composites (d), inset is the expansion of the curves. | ||
At least four Cole–Cole semicircles are clearly found in the ε′–ε′′ curves of the RGO–Fe3O4 composites. This suggests that there are multiple relaxation processes for the RGO–Fe3O4 composites, representing the contribution of the Debye relaxation process to the enhanced dielectric properties of the RGO–Fe3O4 composites.1 In the composites, the existence of interfaces gives rise to interfacial polarization or the Maxwell–Wagner effect. This phenomenon appears in heterogeneous media due to the accumulation of charges at the interfaces and the formation of large dipoles on particles or clusters.47 Evidently, the Cole–Cole semicircle is distorted, suggesting that except for the dielectric relaxation, other mechanisms such as conductance loss, interfacial polarization and oxygen defects may contribute to the permittivity spectra.45
It reveals that the value of the magnetic loss (tan![[thin space (1/6-em)]](https://www.rsc.org/images/entities/char_2009.gif) δM) of the RGO–Fe3O4 composites first declines at 2.0–8.0 GHz, remains in the 8.0–12.4 GHz range, and then exhibits broad resonance peaks at 12.4–15.6 GHz with a maximum value at 14.8 GHz, as presented in Fig. 8f. The magnetic loss is related to the eddy current effect and the anisotropy energy of the composites. For the ferromagnetic absorber, the microwave absorption properties are usually subject to degradation caused by the eddy current effect in the high-frequency region. The μ′′ can be expressed by4
δM) of the RGO–Fe3O4 composites first declines at 2.0–8.0 GHz, remains in the 8.0–12.4 GHz range, and then exhibits broad resonance peaks at 12.4–15.6 GHz with a maximum value at 14.8 GHz, as presented in Fig. 8f. The magnetic loss is related to the eddy current effect and the anisotropy energy of the composites. For the ferromagnetic absorber, the microwave absorption properties are usually subject to degradation caused by the eddy current effect in the high-frequency region. The μ′′ can be expressed by4
| μ′′ ≈ 2πμ0(μ′)2σd2f/3 | (8) |
| C0 = μ′′(μ′)−2f−1 = 2πμ0σd2/3 | (9) |
If the magnetic loss results from eddy current loss, the values of C0 are constant when the frequency is varied.48
Fig. 9d shows the C0–f curves of the pure Fe3O4 NPs and the RGO–Fe3O4 composites. For the pure Fe3O4 NPs, the values of C0 are almost constant in the high-frequency region (8–18 GHz). However, for the RGO–Fe3O4 composites, those values of C0 exhibit a broad peak in the 12.4–15.6 GHz frequency range. This implies that the pure Fe3O4 NPs have a significant eddy current effect in the high-frequency region (8–18 GHz), and the range of eddy current effect will be decreased with the introduction of RGO. Besides, the magnetic loss in the RGO–Fe3O4 composites was mainly caused by the natural resonance in the frequency range 2.0–8.0 GHz and 12.4–15.6 GHz and the eddy current effect in the frequency range 8.0–12.4 GHz and 15.6–18.0 GHz.
The natural resonance in the frequency range 2.0–8.0 GHz and 12.4–15.6 GHz can be attributed to the small size effect and the introduction of RGO. According to the natural-resonance equation,4,49 for ferromagnetic materials,
| 2πfr = rHa | (10) |
| Ha = 4|K1|/3μ0Ms | (11) |
To further study the microwave absorption properties, the reflection loss (RL) was calculated by the following equations based on the transmit-line theory:
 | (12) |
 | (13) |
Fig. 10 shows the calculated theoretical reflection loss of the RGO–Fe3O4 composites with different thickness in the range of 2–18 GHz. It can be observed that the thickness of the absorbers has a great influence on the microwave absorbing properties. In addition, the maximum RL absorption gradually appeared to shift toward a lower frequency with the increase of thickness.1
 | ||
| Fig. 10 The calculated reflection losses for RGO-Fe3O4-1 (a), RGO-Fe3O4-2 (b) and RGO-Fe3O4-3 (c) with different thicknesses in the frequency range of 2–18 GHz. | ||
As shown in Fig. 10a, the maximum RL reaches −38.4 dB at 11.6 GHz for the RGO–Fe3O4-1 composite with a thickness of only 2.1 mm. With a thickness of 1.5 mm, the maximum RL which can be achieved is −24.2 dB at 16.6 GHz, and a bandwidth of RL less than −10 dB (90% absorption19) can reach up to 4.2 GHz (from 13.8 to 18.0 GHz). The absorption bandwidth with RL below −10 dB is up to 12.7 GHz (from 5.3 to 18.0 GHz) with a thickness in the range of 1.5–4.0 mm. For the RGO–Fe3O4-2 composite (Fig. 10b), the maximum RL reaches −34.9 dB at 9.4 GHz with a thickness of only 2.8 mm, and a bandwidth of RL less than −10 dB can reach up to 3.2 GHz (from 8.0 to 11.2 GHz). Whereas for the RGO–Fe3O4-3 composite (Fig. 10c), the maximum RL even reaches −44.6 dB at 6.6 GHz with a thickness of 3.9 mm, and a bandwidth of RL less than −10 dB can reach up to 2.0 GHz (from 5.7 to 7.7 GHz). With a thickness of 2.0 mm, the maximum RL can be achieved at −15.9 dB at 13.2 GHz, and a bandwidth of RL less than −10 dB can reach up to 4.3 GHz (from 12.2 to 16.5 GHz). It is observed that for the RGO–Fe3O4 composites, the optimal thickness will increase whereas the matching frequency will decrease when the (RGO)/(Fe3O4) ratio decreases. As previously stated, we conclude that the as-prepared RGO–Fe3O4 composites show an excellent absorption performance in the range of 2–18 GHz and the maximum RL can be adjusted to a different frequency by controlling the thickness. Our RGO–Fe3O4 composites exhibit excellent microwave absorption performance in comparison with pure RGO,3,30 Fe3O4 NPs (Fig. S4†) and RGO composites reported.12
The excellent microwave absorbing performance of the RGO–Fe3O4 composites is mainly attributed to two key factors: impedance matching and electromagnetic wave attenuation.30 On one hand, the introduction of Fe3O4 NPs has lowered the εr of the RGO, and improved the equality of the εr and μr, which helps to improve the level of impedance matching. On the other hand, the RGO–Fe3O4 composites have strong electromagnetic wave attenuation, which is determined by their dielectric loss (DL) and magnetic loss (ML) (discussed in Fig. 8e and f). Besides, the enormous aspect ratio, layered structure, and the existence of residual defects and groups of the RGO–Fe3O4 composites could cause multiple reflections, which will further enhance the microwave absorbing ability of the composites.30,41 In general, the enhanced microwave absorbing performance of the composites is attributed to the compensatory effect of the graphene and Fe3O4 NPs.30 To further give a visual demonstration of the microwave absorbing mechanism as discussed above, a schematic diagram is presented in Fig. 11. From the above, the results demonstrate that the RGO–Fe3O4 composites could be used as a microwave absorbing material.
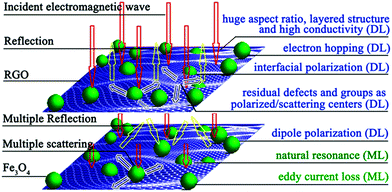 | ||
| Fig. 11 Schematic of possible microwave absorbing mechanisms of the RGO–Fe3O4 composites. | ||
4. Conclusion
In summary, the RGO–Fe3O4 composites with an obviously enhanced microwave absorption property have been successfully synthesized by a rational one-pot simplified co-precipitation route, which avoided the usage of an inert gas and any additional chemical agents (such as surfactants). The results show that the Fe3O4 NPs are very well dispersed on the surface of the RGO nanosheets. The RGO–Fe3O4 composites remarkably improved the electromagnetic performance in comparison with the pure RGO, Fe3O4 NPs and RGO composites reported, which is attributed to effective complementarities between the dielectric loss and the magnetic loss. The dielectric loss of the composites can be attributed to natural resonance, Debye dipolar relaxation, electron polarization relaxation, interfacial polarization and the unique layered nanostructures etc. The magnetic loss of the RGO–Fe3O4 composites is mainly caused by the natural resonance in the frequency range 2.0–8.0 GHz and 12.4–15.6 GHz, and the eddy current effect in the frequency range 8.0–12.4 GHz and 15.6–18.0 GHz. For the RGO–Fe3O4-3 composite, the maximum RL reaches −44.6 dB at 6.6 GHz with a thickness of 3.9 mm, and a bandwidth of RL less than −10 dB can reach up to 4.3 GHz (from 12.2 to 16.5 GHz) with a thickness of 2.0 mm. Additionally, the microwave absorption property can be tuned easily by varying the (RGO)/(Fe3O4) ratio and layer thickness of the samples. It is believed that such composites will find wide applications in microwave absorbing area.Acknowledgements
This work was supported by the Spaceflight Foundation of China (no. 2011XW110001C110001), the Spaceflight Innovation Foundation of China (no. 2011XT110002C110002) and the Basic Research Foundation of Northwestern Polytechnical University (no. JC201269).References
- D. Z. Chen, G. S. Wang, S. He, J. Liu, L. Guo and M. S. Cao, J. Mater. Chem. A, 2013, 1, 5996–6003 CAS.
- J. W. Liu, R. C. Che, H. J. Chen, F. Zhang, F. Xia, Q. S. Wu and M. Wang, Small, 2012, 8, 1214–1221 CrossRef CAS PubMed.
- C. Wang, X. J. Han, P. Xu, X. L. Zhang, Y. C. Du, S. R. Hu, J. Y. Wang and X. H. Wang, Appl. Phys. Lett., 2011, 98, 072906 CrossRef.
- C. L. Zhu, M. L. Zhang, Y. J. Qiao, G. Xiao, F. Zhang and Y. J. Chen, J. Phys. Chem. C, 2010, 114, 16229–16235 CAS.
- H. L. Yu, T. S. Wang, B. Wen, M. M. Lu, Z. Xu, C. L. Zhu, Y. J. Chen, X. Y. Xue, C. W. Sun and M. S. Cao, J. Mater. Chem., 2012, 22, 21679–21685 RSC.
- X. A. Li, B. Zhang, C. H. Ju, X. J. Han, Y. C. Du and P. Xu, J. Phys. Chem. C, 2011, 115, 12350–12357 CAS.
- Y. C. Qing, W. C. Zhou, F. Luo and D. M. Zhu, Carbon, 2010, 48, 4074–4080 CrossRef CAS PubMed.
- X. Bai, Y. H. Zhai and Y. Zhang, J. Phys. Chem. C, 2011, 115, 11673–11677 CAS.
- L. Wang, F. He and Y. Z. Wan, J. Alloys Compd., 2011, 509, 4726–4730 CrossRef CAS PubMed.
- D. Y. Pan, J. C. Zhang, Z. Li and M. H. Wu, Adv. Mater., 2010, 22, 734–738 CrossRef CAS PubMed.
- H. X. Chang, G. F. Wang, A. Yang, X. M. Tao, X. Q. Liu, Y. D. Shen and Z. J. Zheng, Adv. Funct. Mater., 2010, 20, 2893–2902 CrossRef CAS.
- E. L. Ma, J. J. Li, N. Q. Zhao, E. Z. Liu, C. N. He and C. S. Shi, Mater. Lett., 2013, 91, 209–212 CrossRef CAS PubMed.
- G. Goncalves, P. A. A. P. Marques, C. M. Granadeiro, H. I. S. Nogueira, M. K. Singh and J. Grácio, Chem. Mater., 2009, 21, 4796–4802 CrossRef CAS.
- S. Liu, J. Q. Tian, L. Wang, H. L. Li, Y. W. Zhang and X. P. Sun, Macromolecules, 2010, 43, 10078–10083 CrossRef CAS.
- G. P. Kim, I. Nam, N. D. Kim, J. Park, S. Park and J. Yi, Electrochem. Commun., 2012, 22, 93–96 CrossRef CAS PubMed.
- A. Prakash, S. Chandra and D. Bahadur, Carbon, 2012, 50, 4209–4219 CrossRef CAS PubMed.
- Y. Q. Zhan, F. B. Meng, Y. J. Lei, R. Zhao, J. C. Zhong and X. B. Liu, Mater. Lett., 2011, 65, 1737–1740 CrossRef CAS PubMed.
- Y. Q. Zhan, R. Zhao, Y. J. Lei, F. B. Meng, J. C. Zhong and X. B. Liu, Appl. Surf. Sci., 2011, 257, 4524–4528 CrossRef CAS PubMed.
- Y. Yang, X. L. Liu, Y. Yang, W. Xiao, Z. W. Li, D. S. Xue, F. S. Li and J. Ding, J. Mater. Chem. C, 2013, 1, 2875–2885 RSC.
- W. C. Zhou, X. J. Hu, X. X. Bai, S. Y. Zhou, C. Y. Sun, J. Yan and P. Chen, ACS Appl. Mater. Interfaces, 2011, 3, 3839–3845 CAS.
- S. H. Liu, R. M. Xing, F. Lu, R. K. Rana and J. J. Zhu, J. Phys. Chem. C, 2009, 113, 21042–21047 CAS.
- J. S. Chen, Y. M. Zhang and D. Lou, ACS Appl. Mater. Interfaces, 2011, 3, 3276–3279 CAS.
- J. Su, M. H. Cao, L. Ren and C. W. Hu, J. Phys. Chem. C, 2011, 115, 14469–14477 CAS.
- W. Hummers, Jr and R. E. Offeman, J. Am. Chem. Soc., 1958, 80, 1339 CrossRef.
- M. Z. Kassaee, E. Motamedi and M. Majdi, Biochem. Eng. J., 2011, 172, 540–549 CAS.
- P. S. Teo, H. N. Lim, N. M. Huang, C. H. Chia and I. Harrison, Ceram. Int., 2012, 38, 6411–6416 CrossRef CAS PubMed.
- X. P. Shen, J. L. Wu, S. Bai and H. Zhou, J. Alloys Compd., 2010, 506, 136–140 CrossRef CAS PubMed.
- Y. C. Si and E. T. Samulski, Chem. Mater., 2008, 20, 6792–6797 CrossRef CAS.
- H. Wei, W. s. Yang, Q. Xi and X. Chen, Mater. Lett., 2012, 82, 224–226 CrossRef CAS PubMed.
- X. Sun, J. P. He, G. X. Li, J. Tang, T. Wang, Y. X. Guo and H. R. Xue, J. Mater. Chem. C, 2013, 1, 765–777 RSC.
- G. B. Sun, B. X. Dong, M. H. Cao, B. Q. Wei and C. W. Hu, Chem. Mater., 2011, 23, 1587–1593 CrossRef CAS.
- Y. Q. Zhan, F. B. Meng, X. L. Yang, R. Zhao and X. B. Liu, Mater. Sci. Eng., B, 2011, 176, 1333–1339 CrossRef CAS PubMed.
- P. B. Liu, Y. Huang and L. Wang, Mater. Lett., 2013, 91, 125–128 CrossRef CAS PubMed.
- H. L. Guo, X. F. Wang, Q. Y. Qian, F. B. Wang and X. H. Xia, ACS Nano, 2009, 3, 2653–2659 CrossRef CAS PubMed.
- H. K. Jeong, Y. P. Lee, R. J. W. E. Lahaye, M. H. Park, K. H. An, I. J. Kim, C. W. Yang, C. Y. Park, R. S. Ruoff and Y. H. Lee, J. Am. Chem. Soc., 2008, 130, 1362–1366 CrossRef CAS PubMed.
- H. P. Cong, X. C. Ren, P. Wang and S. H. Yu, ACS Nano, 2012, 6, 2693–2703 CrossRef CAS PubMed.
- C. Z. Zhu, S. J. Guo, Y. X. Fang and S. J. Dong, ACS Nano, 2010, 4, 2429–2437 CrossRef CAS PubMed.
- L. L. Ren, S. Huang, W. Fan and T. X. Liu, Appl. Surf. Sci., 2011, 258, 1132–1138 CrossRef CAS PubMed.
- Y. Z. Xue, B. Wu, L. Jiang, Y. L. Guo, L. P. Huang, J. J. Chen, J. H. Tan, D. C. Geng, B. R. Luo, W. P. Hu, G. Yu and Y. Q. Liu, J. Am. Chem. Soc., 2012, 134, 11060–11063 CrossRef CAS PubMed.
- F. J. Zhang, J. Liu, K. Zhang, W. Zhao, W. K. Jang and W. C. Oh, Korean J. Chem. Eng., 2012, 29, 989–993 CrossRef CAS PubMed.
- G. M. Rutter, J. N. Crain, N. P. Guisinger, T. Li, P. N. First and J. A. Stroscio, Science, 2007, 317, 219–222 CrossRef CAS PubMed.
- X. B. Fan, W. C. Peng, Y. Li, X. Y. Li, S. L. Wang, G. L. Zhang and F. B. Zhang, Adv. Mater., 2008, 20, 4490–4493 CrossRef CAS.
- D. Zhou, T. L. Zhang and B. H. Han, Microporous Mesoporous Mater., 2013, 165, 234–239 CrossRef CAS PubMed.
- F. He, J. T. Fan, D. Ma, L. M. Zhang, C. Leung and H. L. Chan, Carbon, 2010, 48, 3139–3144 CrossRef CAS PubMed.
- H. J. Wu, L. D. Wang, S. L. Guo, Y. M. Wang and Z. Y. Shen, Mater. Chem. Phys., 2012, 133, 965–970 CrossRef CAS PubMed.
- Y. J. Chen, G. Xiao, T. S. Wang, Q. Y. Ouyang, L. H. Qi, Y. Ma, P. Gao, C. L. Zhu, M. S. Cao and H. B. Jin, J. Phys. Chem. C, 2011, 115, 13603–13608 CAS.
- S. He, G. S. Wang, C. Lu, J. Liu, B. Wen, H. Liu, L. Guo and M. S. Cao, J. Mater. Chem. A, 2013, 1, 4685–4692 CAS.
- X. F. Zhang, X. L. Dong, H. Huang, Y. Y. Liu, W. N. Wang, X. G. Zhu, B. Lv and J. P. Lei, Appl. Phys. Lett., 2006, 89, 053115 CrossRef.
- Y. J. Chen, P. Gao, R. X. Wang, C. L. Zhu, L. J. Wang, M. J. Cao and H. B. Jin, J. Phys. Chem. C, 2009, 113, 10061–10064 CAS.
- D. L. Leslie-Pelecky and R. D. Rieke, Chem. Mater., 1996, 8, 1770–1783 CrossRef CAS.
Footnote |
| † Electronic supplementary information (ESI) available. See DOI: 10.1039/c3ra43359e |
| This journal is © The Royal Society of Chemistry 2013 |
